Aree
CO₂ EMISSION INTENSITY IN INDUSTRY RELATIVE TO VALUE ADDED
Data aggiornamento scheda:
The efficiency indicator, developed for the years 1995–2023, expresses carbon dioxide emissions per unit of value added in manufacturing and construction industry in Italy. The substantial reduction in emission intensity over time (–45.5% between 1995 and 2023) indicates an improvement in the efficiency level achieved by the Italian manufacturing and construction sectors.
INDUSTRIAL ENTERPRISES
Data aggiornamento scheda:
The indicator measures the number of industrial enterprises in the strict sense, their local operational units, and the employed workforce, providing a snapshot of the national production structure and its evolution.
In 2022, the number of active enterprises in the industrial sector (in the strict sense) amounted to 390,580, a figure that remained essentially stable compared to 2021 (+0.02%). The territorial distribution remains polarized, with over half of the enterprises concentrated in the northern part of the country. In terms of employment, the number of workers totaled 4,137,637, marking a 1.5% increase compared to the previous year. Overall, the manufacturing sector remains the dominant component, accounting for over 90% of industrial employment.
PRTR REGISTER: WATER EMISSIONS (FORMERLY INES REGISTER: WATER EMISSIONS)
Data aggiornamento scheda:

The EPRTR (European Pollutant Release and Transfer Register) is the integrated register established by the EU based on Regulation (EC) No. 166/2006, aimed at making publicly available information on environmental impacts caused by industrial facilities falling under the criteria set out in the regulation.
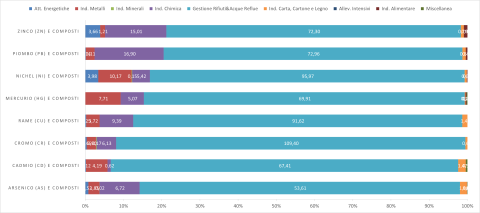
This indicator represents total emissions into surface waters and pollutant transfers in wastewater from industrial facilities that reported such data to the national PRTR register. For the year 2020, 60 substances were reported as present in emissions into surface water bodies, while 49 substances were declared in pollutant transfers via wastewater conveyed through pipelines to external treatment facilities.
The PRTR activity groups that contribute the highest percentages of reported pollutant emissions into both wastewater and surface waters are generally those related to "Waste and Wastewater Management" and "Chemical Industry".