Aree
CONSERVATION STATUS OF HABITATS UNDER DIRECTIVE 92/43/EEC
Data aggiornamento scheda:
The indicator describes the conservation status of the 132 habitats protected by the Habitats Directive 92/43/EEC, one of the main pillars of community policy for nature conservation. The indicator is based on the results of the Italian reports (III Report-2013, IV Report-2019, V Report 2025) drawn up pursuant to art. 17 of the Directive, coordinated by ISPRA on behalf of MASE and officially transmitted to the European Commission.
Specifically, the sheet presents the results of the fifth report in which distribution maps were produced for 124 terrestrial and inland water habitats and 8 marine habitats. Furthermore, 262 reporting forms have been updated, each referring to a habitat in the respective biogeographical regions of presence. In 2025, 42% of habitats are in poor conservation status (SC) (U1), while 48% are in bad conservation status (U2), meaning they are in worrying conditions. Comparing the results of the V Report with the previous ones (III-2013, IV-2019) no improvements in the SC emerge for most of the habitats, even if there was an overall increase in knowledge. The percentages of change in the habitat SC between the 4th and 5th reports show 71% of the assessments in which the habitat SC remains unchanged, 7% in which the SC improves, 19% of assessments in which the SC worsens and a remaining 3% in which the assessments in the two reports are not comparable. The data presented confirm the urgency of implementing the actions envisaged by the EU Regulation 2024/1991 for the Restoration of Nature and by the European and National Strategies for Biodiversity, whose targets envisage that at least 30% of species and habitats in unfavorable SC improve their status by 2030 or show at least a trend of improvement.
CONSERVATION STATUS OF SPECIES UNDER THE HABITATS DIRECTIVE 92/43/EEC
Data aggiornamento scheda:
The indicator illustrates the trends and conservation status of the over 340 Italian species protected by the Habitats Directive 92/43/EEC and is based on the results of the last three Italian reports pursuant to art. 17, coordinated by ISPRA on behalf of MASE and transmitted to the European Commission in 2013, 2019 and 2025. The data from the latest report (referring to the period 2019-2024 and delivered in 2025) are presented in detail, in which the 346 species of community interest present in our territory and in our seas were evaluated (226 animal species and 120 plant species), creating 344 distribution maps and 580 reporting sheets (one for each species in each biogeographical region of presence).
The results show that in 2025, 29% of species are in poor conservation status (SC) and 20% are in bad conservation status, meaning they are in worrying conditions and at risk of extinction. Terrestrial and freshwater fauna is the group with the highest percentage of species in bad SC (22%), followed by terrestrial flora (16%) and marine species (11%).
Comparing the results of the V Report with the previous ones (III Report-2013, IV Report-2019) no improvements in the SC emerge for most species, even if there was an increase in knowledge for marine species. The percentages of change in the SC of the species between IV and V Report show 74% of the assessments in which the SC of the species remains unchanged, 10% in which the SC improves, 11% of assessments in which the SC worsens and a remaining 5% in which the assessments in the two reports are not comparable.
The data presented confirm the urgency of implementing the actions envisaged by the EU Regulation 2024/1991 for the Restoration of Nature and by the European and National Strategies for Biodiversity to 2030, whose targets provide that at least 30% of species and habitats in unfavorable SC improve their status by 2030 or show at least an improvement trend.
DEFOLIATION OF THE CANOPY OF FOREST SPECIES
Data aggiornamento scheda:
The defoliation values indicate the level of resilience or susceptibility of the species to the impact caused by atmospheric deposition and gaseous pollutants. The data collected over the last 29 years (1997-2025) show a fluctuating trend until 2020, with years of attenuation and years of growth of the phenomenon and greater sensitivity of broad-leaved trees. Starting from 2021, however, a worsening of the phenomenon was recorded, with very high defoliation values, never reached before. These values, in 2023, reached 45% for broad-leaved and needle-leaved trees. This trend eased in 2024 and 2025, the year in which values dropped to 36% defoliation for coniferous trees and 39.7% for broadleaf trees.
FOREST ECOSYSTEM AREAS AFFECTED BY WILDFIRES: STATUS AND CHANGES
Data aggiornamento scheda:
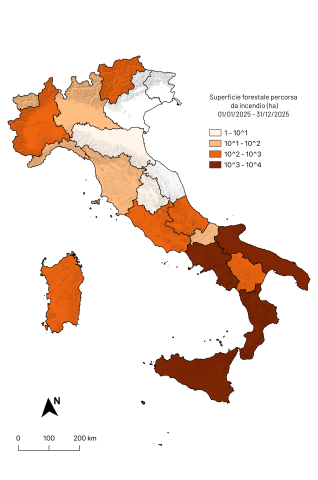
The indicator examines the series of forest areas affected by large fires on a national, regional and protected area scale in the period between 2018 and 2025.
The distribution and extension of these surfaces generally shows significant interannual variability. 2025, in particular, was a year seriously affected by an extension of the forest areas affected by fires, greater than the previous year. Furthermore, the forest area burned is only lower than that burned in 2021, 2022 and 2023.
In 2025, the most affected regions were: Sicily (3,967 hectares - ha), Calabria (2,892 ha) and Campania (1,835 ha), which together represent 71% of the forest area at national level affected by fire.
The forest classes most affected are evergreen broad-leaved trees (e. g. Holm oak forests and tall scrub), followed by deciduous broad-leaved trees (e. g. Oak and beech forests) and decidedly less so by conifers (e. g. Pine forests, fir forests and larch forests).
The linear regression analysis of the national forest cover data series affected by fire does not show an increasing trend, although the length of the series does not allow medium and long-term evaluations. On the contrary, a statistically significant positive trend was observed for the regions of Puglia, Basilicata and Calabria.
NATURA 2000 NETWORK
Data aggiornamento scheda:
The Natura 2000 Network, established under the Habitats and Birds Directives (known as the Nature Directives), consists of 2,649 sites in Italy, covering a total area, net of overlaps, of 5,844,888 hectares on land, equal to 19.4% of the national territory, and a marine area of 2,344,963 hectares, equal to 6.5% of the waters under national jurisdiction (territorial waters and EPZ) (2025 data, transmitted to the Commission in January 2026). The Network is fundamental for the implementation of the Nature Directives, but it is also important in relation to the targets of the European and National Biodiversity Strategies for 2030 (EBS2030 and NBS2030), which call for expanding protected zones to at least 30% of the land surface and 30% of marine waters; in addition to the N2000 Network sites, all areas subject to protection, including National and Regional Parks and all other protected areas, contribute to this target. In the Italian regions and autonomous provinces, the Network has a heterogeneous extension, with percentages of protected regional territories and waters ranging from 12% (Emilia-Romagna) to 36% (Abruzzo) on land and from less than 1% (Marche) to 31% (Puglia) at sea.
WETLANDS OF INTERNATIONAL IMPORTANCE
Data aggiornamento scheda:
To date, there are 63 Italian wetlands included in the official list of sites of the Ramsar Convention, recognized by the Ramsar Secretariat as wetlands of international importance, covering a total of 81,091 hectares. Overall, the 66 Italian Ramsar sites (63 designated by the Convention Secretariat and 3 in the process of designation) are distributed across 15 regions. The regions with the largest and most numerous areas are Emilia-Romagna (10 sites, with an area equal to 23,112 ha), Tuscany (11 sites with an area equal to 20,755 ha), and Sardinia (9 sites, with an area equal to 13,308 ha). The level of implementation of protection and management instruments for these areas, necessary to ensure the conservation of habitats, flora, and fauna linked to aquatic ecosystems, is not sufficiently known.
CITES CONTROLS
Data aggiornamento scheda:
The number and outcomes of inspections carried out over the last 14 years (2010-2023) to verify compliance with the Washington Convention on International Trade in Endangered Species of Wild Fauna and Flora (CITES) are analyzed. The indicator shows a marked increase in the number of detected offences starting from 2018. In the same year, the total amount of imposed fines also rose sharply, averaging approximately €2,091,126 per year between 2018 and 2024, compared with an average of €611,013 during the 2010–2017 period.
In 2024, a total of 6,170 inspections were carried out, identifying 556 offences and resulting in total fines amounting to €1,728,543. Most violations concerned fauna species (258 offences, €1,137,800 in fines) and flora species (279 offences, €550,737).
EXTENT OF WILDFIRE
Data aggiornamento scheda:
The wildfire phenomenon, analyzed on the basis of data collected from 1970 to 2024 by CUFA of the Carabinieri Corps (formerly the State Forestry Corps), shows a fluctuating trend, with peak years (1993, 2007, 2017, 2021) alternating with periods of decline (2013, 2014, 2018, 2024).
Wildfires occurring within Protected Areas (recorded since 2003), although showing annual fluctuations, remain at high levels, with an average of 11,000 hectares burned over the last three years.
The incidence of deliberately caused fires is very high, representing about half of all recorded events and exceeding 60% in some years.
FRAGMENTATION OF NATURAL AND AGRICULTURAL LAND
Data aggiornamento scheda:
Land fragmentation is the process that leads to a progressive reduction in the surface area of natural and semi-natural environments and to an increase in their isolation. This process, which transforms large territorial patches into smaller and more isolated units, is mainly driven by urban expansion—implemented through more or less sustainable development patterns—and by the growth of infrastructure networks aimed at improving connectivity between urbanized areas through linear works. In 2024, 42.41% of the national territory was classified as having high or very high fragmentation. The regions with the largest share of very highly fragmented land are Veneto (39.73%), Lombardy (33.73%), Emilia-Romagna (25.22%), Puglia (25.22%), and Campania (25.76%). These figures confirm the close relationship between fragmentation and urbanization density.
LAND CONSUMPTION IN PROTECTED AREAS
Data aggiornamento scheda:
The consumed soil within the terrestrial portion of Italian protected areas included in the Official List of Protected Areas (EUAP, 2010, updated with newly designated national protected areas established after 2010) is assessed with reference to National Parks, State and Regional Nature Reserves, Regional Nature Parks, and the other categories of national and regional protected natural areas.
As of 2024, 1.88% of the more than three million hectares of terrestrial EUAP areas (58,328 hectares) has been consumed, with the highest percentage in Campania (3.82%) and the lowest in the Alpine regions (Valle d’Aosta, Trentino-Alto Adige, and Friuli Venezia Giulia).
Between 2023 and 2024, Italian protected areas recorded an increase in soil consumption that remained below the national average (0.26 m² of change per hectare, compared to a national value of 2.60 m²/ha), amounting to a total of 80.96 hectares of newly consumed soil, more than 46% of which is concentrated in Abruzzo, Lazio, and Campania.
MARINE PROTECTED AREAS
Data aggiornamento scheda:
Both the number of protected areas and the extent of protected marine surface have steadily increased over time. At present, 30 Marine Protected Areas (MPAs) have been established in Italy, across 10 Italian regions, along with a further 10 areas protecting coastal marine stretches.
Sicily and Sardinia host the largest share of marine protected areas, both in terms of number and area of protected surface. Between 2012 and 2023, at the national level, the surface of Marine Protected Areas (MPAs) increased by 3.1%, following the establishment in 2018 of the two MPAs of Capo Testa–Punta Falcone in Sardinia and Capo Milazzo in Sicily, and in 2023 of the Capo Spartivento MPA in Sardinia.
NATIONAL PROTECTED TERRESTRIAL AND MARINE AREA
Data aggiornamento scheda:
The European Commission adopted the EU Biodiversity Strategy for 2030 (EBS 2030, COM(2020) 380 final), which calls on Member States to protect at least 30% of national land territory and 30% of marine areas, with at least one third of these areas under strict protection. These objectives have been incorporated into the Italian National Biodiversity Strategy for 2030 (NBS 2030).
This indicator integrates spatial data relating to the main biodiversity protection systems in Italy (protected areas and the Natura 2000 Network). It calculates the extent of Italian territory currently protected on land and at sea, assesses changes from 1991 to 2024, and shows the gap between the percentage of protected land and marine areas and the 30% target set by the EBS 2030.
After removing overlaps between protected areas and Natura 2000 sites, national protected coverage currently amounts to approximately 4,071,482 hectares at sea, corresponding to 11.6% of Italian territorial waters and the Ecological Protection Zone (EPZ), and about 6,532,887 hectares on land, corresponding to 21.7% of Italian territory. The extent of overlapping areas—those falling both within a protected area and a Natura 2000 site—has increased over time, reaching 893,839 hectares at sea and 2,447,065 hectares on land in 2024. Trends show that the national percentage of protected surface has stabilised since 2006 for marine areas and since 2011 for terrestrial areas. To achieve the 30% target set by the EBS 2030, an additional gap of about 18% of marine surface still needs to be protected (around 6,600,000 hectares), along with 8% of terrestrial surface (around 2,500,000 hectares).
SPREAD OF ALIEN SPECIES
Data aggiornamento scheda:
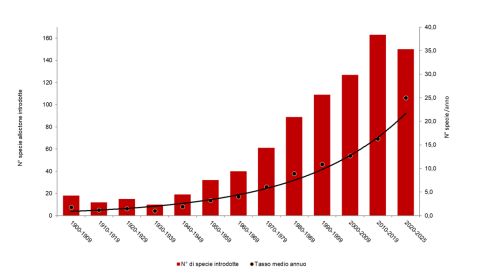
The indicator provides an overview of the current presence of alien animal and plant species in Italy, describing their numbers and trends in introductions over the past century. It reports the average annual introduction rate (the mean number of new alien species introduced each year), the main pathways of introduction (according to CBD categories), and the distribution of invasive alien species of Union concern.
The number of alien species in Italy is steadily and continuously increasing. Based on the data currently available, more than 3,800 alien species have been introduced into the country, of which 3,699 are currently established in the territory. The average number of species introduced per year has grown exponentially over time — from 6 species per year in the 1970s, to 16 per year in the previous decade, and reaching 25 per year in the current one. The cumulative number of alien species introduced in Italy since 1900 also confirms this exponential trend, showing an increase of over 500% in 120 years.
TERRESTRIAL PROTECTED AREAS
Data aggiornamento scheda:
In Italy, a total of 843 terrestrial protected areas (including those with a coastal component) have been established to date, covering more than 3 million hectares, equivalent to about 10.5% of the country’s land surface. An analysis of the historical series (1922–2024) shows consistently positive trends—particularly from the mid-1970s—in both the number and the extent of terrestrial protected areas, while growth trends have tended to stabilize since 2008–2009.
DISTRIBUTION OF ECOLOGICAL VALUE ACCORDING TO CARTA DELLA NATURA
Data aggiornamento scheda:
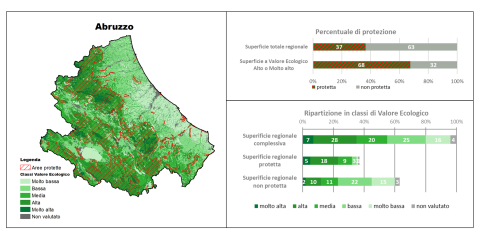
The indicator, based on data processed within the Carta della Natura project, shows the distribution of Ecological Value (VE) across 17 Italian regions, providing a representation categorized into different classes. Ecological Value is understood as a synonym for natural significance and is calculated—starting from the regional habitat maps—for each mapped polygon, excluding those referring to built environments and fully urbanized areas. This indicator offers an overview of the environmental mosaic within various regional contexts, highlighting high-value areas, including their protection status. The analysis presents the percentage of protected areas in each region and the composition of protected and unprotected zones in terms of Ecological Value. The protected areas system (EUAP areas, Natura 2000 sites, and Ramsar areas) covers territories characterized by the highest Ecological Value classes but still leaves significant portions outside protected areas.
HEALTH STATUS OF MIGRATORY BIRD POPULATIONS
Data aggiornamento scheda:
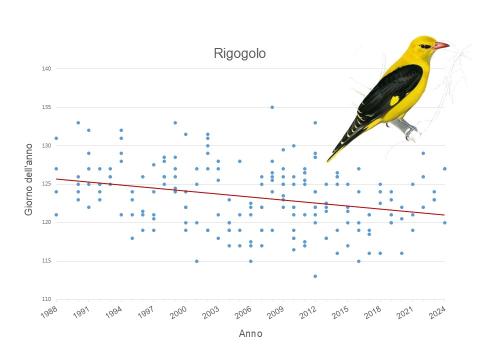
The indicator provides an overview of the health status of common migratory passerine bird populations in Europe through an assessment of their resilience to climate change. The increase in spring temperatures due to global warming causes an earlier seasonal onset of vegetation and, consequently, of the insect peak. As a result, if migratory birds do not advance their arrival at breeding sites to the same extent, they fail to encounter an abundance of prey at the critical time for feeding chicks. A failure to advance migration timing therefore translates into low resilience of migratory populations to climate change, with negative consequences for their survival.
The analysis focuses on the temporal variation in the arrival dates of migratory passerines at stopover sites used after crossing the Sahara and the Mediterranean Sea during their spring journey from Africa to European breeding grounds. Based on an analysis of the migration dates of 10 bird species recorded at 26 ringing stations participating in the ISPRA Small Islands Project from 1988 to 2024 (37 years), it is observed that 60% of the studied species show a migration advance that is too slow (about 1 day every 7+ years) to be considered sufficient to offset the effects of climate change.
CONSERVATION STATUS OF SPECIES PROTECTED UNDER THE BIRDS DIRECTIVE (2009/147/EC)
Data aggiornamento scheda:
This indicator provides a national overview of the conservation status of 268 breeding bird species assessed in the reporting under Article 12 of the Birds Directive 2009/147/EC. The assessment includes species of community interest listed in Annexes I and II of the Directive, as well as those that justify the designation of Special Protection Areas (SPAs).
At the national level, the percentage of species with a favourable conservation status increased from 51% (reporting period 2007-2012) to 56% (reporting period 2013-2018). However, this increase was insufficient to meet the target set by the EU Biodiversity Strategy 2020 (76%).
The short-term population trends, which reflect processes occurring in the last decade, indicate that 46% of species are increasing or stable, while nearly 25% of species are in decline (the population trend of the other 33% remains unknown). Regarding short-term trends in distribution range, the proportion of declining species is lower, as only the most severe declines result in range contractions: 21% of species show a contraction, while the remaining 79% have stable or expanding ranges.
MOUNTAIN GREEN COVER INDEX
Data aggiornamento scheda:
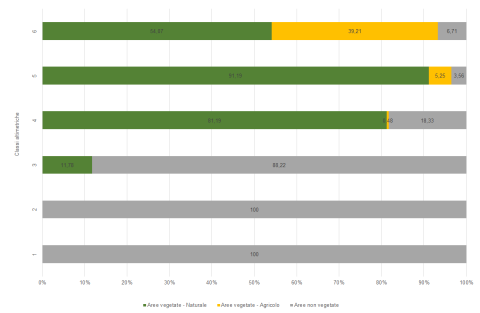
The index evaluates the percentage of vegetation cover in mountain areas, defined according to the six altitude classes with elevations above 300 m above sea level proposed by FAO in 2015 (UNEP-WCMC). The data is expressed in terms of total mountain vegetation area and with reference to the distinction between natural and agricultural areas.
The analysis reveals a significant presence of vegetated areas, especially in classes 5 and 6, which are between 300 and 1,500 m above sea level. The changes observed are mostly associated with a reduction in vegetated areas, while increases are recorded in higher altitude bands, with a maximum of just over 1,800 hectares in Veneto and slightly more than 1,000 hectares in Lombardia. Significant increases in mountain vegetation cover are also found in Marche and Tuscany, which, together with Lombardia and Veneto, are the only regions showing an overall increase in mountain green areas, net of reductions.
PRIMARY EXPENDITURE FOR ENVIRONMENTAL PROTECTION, USE, AND MANAGEMENT OF NATURAL RESOURCES WITH REFERENCE TO BIODIVERSITY
Data aggiornamento scheda:
In 2022, Italy's primary environmental expenditure increased by 163% compared to 2021, reflecting a greater political interest in environmental issues. However, the share of key sectors (biodiversity and landscape protection, forest and wildlife management) in total environmental spending declined from 9.1% to 4.2%.
Despite the increase in available resources, spending capacity varies across sectors, with efficiency rates ranging from 88.5% for biodiversity to 69.1% for forest management. This trend highlights the need to optimize investments to ensure the protection of natural heritage, in alignment with the sustainable development goals of the 2030 Agenda.
RICHNESS AND RED LIST STATUS OF PLANT SPECIES
Data aggiornamento scheda:
Italy hosts a remarkable floristic heritage, both in terms of species and subspecies richness (2,815 lichens, 1,209 bryophytes, and 8,241 native vascular entities) and biogeographical value. Of the 8,241 Italian vascular plant,1,702 species (equal to 20.65%) are endemic, meaning they exist exclusively in the country. Among these, 1,128 species are regionally endemic, with their range restricted to a single Italian region (data updated to April 2024).
The indicator also highlights the IUCN risk status of 2,430 vascular plant entities (representing 29.5% of Italy’s vascular flora), identifying the main threats affecting them. Unfortunately, the overall conservation status cannot be considered satisfactory: 2.2% (54 species) of the 2,430 evaluated entities are extinct or likely extinct; 24.3% (590 species) are at risk of extinction.
Human-induced pressures related to land-use changes represent a major driver of plant species extinction risk. The Red List of vascular flora identifies the most critical pressures affecting species: Modification of natural systems (39% of the 2,430 assessed taxa are subject to this pressure);
Agricultural development (27%); Residential development (27%); Direct human disturbance in natural environments (20%).
ANTHROPOGENIC PRESSURE IN WETLANDS OF INTERNATIONAL IMPORTANCE
Data aggiornamento scheda:
A significant portion of Italy’s Ramsar sites is subject to anthropogenic pressure due to both the presence of settlements and infrastructure and agricultural activities. In 45 out of 65 cases, agricultural areas occupy more than half of the Ramsar site's territory. While urbanized areas and infrastructure have a smaller spatial extent, they still contribute to the pressure affecting Ramsar sites. Approximately one-quarter of these areas experience high or very high levels of urbanization pressure. A total of 68% of wetlands fall within Class III (high pressure) and Class IV (very high pressure), highlighting the fragile balance in which these environments exist. Only 15% of the areas fall into Class I (low pressure), while 17% belong to Class II (moderate pressure).
OVERLAP OF TERRESTRIAL PROTECTED AREAS WITH KEY BIODIVERSITY AREAS
Data aggiornamento scheda:
In order to assess whether protected areas have been designated based on scientific criteria, including ecologically representative areas (Margules & Pressey, 2000; Maxwell et al., 2020), the overlap between terrestrial protected areas in our country and Key Biodiversity Areas (KBA, IUCN, 2016) has been calculated. The protected areas considered include those in the data bank of the Common Database on Designated Areas (CDDA) (now Nationally designated areas of Europe - NatDA), and the Natura 2000 Network. KBAs identify key areas for biodiversity conservation and, according to the European Commission’s guidance document on achieving the 30% target ("Criteria and guidance for protected areas designations," Brussels, 28/1/2022), are among those to be considered for designation as protected areas. The indicator used corresponds to the one adopted internationally to evaluate progress toward the Sustainable Development Goals (SDGs) for 2030 (SO4-3.T1: National estimates of the average proportion of Terrestrial KBAs covered by protected areas in %).
The results indicate that, after accounting for overlaps between CDDA protected areas and Natura 2000 sites, 75.20% of the national terrestrial protected area overlaps with KBAs identified at the national level, demonstrating a fair inclusion of important biodiversity areas.
RELATIVE RICHNESS AND ABUNDANCE OF BIRDS IN ITALY
Data aggiornamento scheda:
The indicator measures the abundance and diversity of bird populations in Italy throughout the year, based on bird ringing data. This assessment helps define Italy’s role in the spatial-temporal distribution of European avifauna. Data from 2019-2020 confirm Italy’s crucial importance as a major migration corridor between Europe and Africa and contribute to identifying critical periods for bird species, which is essential for conservation and management purposes.
RICHNESS AND RED LIST STATUS OF ANIMAL SPECIES
Data aggiornamento scheda:
The Italian fauna is estimated to include over 58,000 species, with the total number reaching approximately 60,000 taxa when considering subspecies. However, this biodiversity is under threat, as indicated by IUCN assessments and population trends. Among the 672 species of Italian vertebrates (576 terrestrial and 96 marine), 6 are extinct in Italy, and 161 are threatened with extinction (accounting for 28% of the assessed species). Different vertebrate groups show varying percentages of risk: 2% for marine bony fish, 19% for reptiles, 21% for cartilaginous fish, 23% for mammals, 36% for amphibians, and up to 48% for freshwater bony fish (considering the CR+EN+VU IUCN categories). Additionally, terrestrial and marine vertebrate populations are generally declining by 27% and 22%, respectively.
Breeding birds are the only group for which two IUCN assessments have been conducted, seven years apart. Of the 278 species assessed in the latest 2019 evaluation, 5 are extinct, and 67 are threatened (compared to 76 in 2013), representing 26% of the evaluated species. Half of Italy's breeding bird species are not at immediate risk of extinction.
Among invertebrates, 9% of corals, 11% of dragonflies, 21% of saproxylic beetles, 6% of butterflies, and 11% of assessed bees are threatened with extinction. Invertebrates also show negative trends; for example, 16% of dragonfly populations are in decline, five times higher than those increasing.