Giovanni Finocchiaro, Silvia Iaccarino, Francesca Palomba
Tourism continues to be strategic for the Italian economy, yet its attractiveness depends on a healthy environment. The indicator quantifies the atmospheric emissions generated by road-based tourist travel in Italy. In 2023 the automobile remains the main source of every pollutant considered: 93.7 % of CO, 96.1 % of VOCs, 90.2 % of NOx, 86.2 % of PM₂.₅ and 93.4 % of CO₂. “Recreational” vehicles—motorhomes, caravans and vans—have their greatest impact on PM₂.₅ (11.9 %) and NOx (8.1 %). After the post-pandemic peak of 2022, total emissions fell in 2023 by roughly 11–18 % (depending on the pollutant) and remain below the pre-pandemic 2019 levels; however, this comparison may have been influenced by a methodological improvement.
The indicator provides an estimate of emissions produced by tourist travel in Italy using road transport, in terms of major atmospheric pollutants. Although the phenomenon is underestimated, as the mileage considered is based only on the distance between the departure and destination cities, excluding local movements during the stay or stopovers in itinerant trips, this analysis aims to fill a significant knowledge gap in the tourism-environment relationship. The indicator integrates environmental monitoring data (National Air Emissions Inventory) with statistical data on tourism demand (ISTAT’s "Trips and Holidays" survey). Thus, it represents a new analytical approach that combines official sources to enhance information on tourism-related emissions.
To estimate emissions generated by tourist travel in Italy using road transport, focusing on major atmospheric pollutants.
The indicator has no specific regulatory references, but it helps address knowledge gaps in the tourism-environment relationship. It aligns with the Glasgow Declaration on Climate Action in Tourism, presented at COP26 in November 2021.
- European Parliament. Research for Tran Committee – From responsible best practices to sustainable tourism development. 2016 edition; ISBN: 978-92-823-8800-6. Available online: https://www.europarl.europa.eu/RegData/etudes/STUD/2015/573421/IPOL_STU(2015)573421_EN.pdf
- ETC/ULS. Tourism and the environment Towards a reporting mechanism in Europe. Report 01/2018. Available online: https://www.eionet.europa.eu/etcs/etc-uls/products/etc-uls-report-01-2018-tourism-and-the-environment-towards-a-reporting-mechanism-in-europe
- Di Torrice M., Sabato, M.; Dattilo, B.; et al. La nuova indagine sulla domanda turistica. Istat, Rome, Italy, 2018; ISBN 978-88-458-1964-3. Available online: https://www.istat.it/it/archivio/222043
- Regulation (EU) No 692/2011 of the European Parliament and of the Council of 6 July 2011 concerning European statistics on tourism and repealing Council Directive 95/57/EC. Available online: https://eur-lex.europa.eu/LexUriServ/LexUriServ.do?uri=OJ:L:2011:192:0017:0032:EN:PDF
- UNWTO, 2010. International Recommendations on tourism statistics 2008 (IRTS 2008), ST/ESA/STAT/SER.M/83/Rev.1, Madrid and New York. Available online: https://unstats.un.org/unsd/publication/Seriesm/SeriesM_83rev1e.pdf
- Eurostat, Methodological manual for tourism statistics – Version 3.1. , 2014 edition. ISBN: 978-92-79-44558-3, (DOI): 10.2785/892233 2015. Available online: http://ec.europa.eu/eurostat/web/products-manuals-and-guidelines/-/KS-GQ-14-013 .
- Di Torrice, M.; et al. Indagine Viaggi e Vacanze, Aspetti metodologici dell’indagine. Available online: https://www.istat.it/it/archivio/178695
- Deville, J.C.; Sarndal, C.E. Calibration Estimators in Survey Sampling. J. Am. Stat. Assoc. 1992, 87, 376-382, doi:10.2307/2290268. - ISPRA. Serie Storiche Emissioni – Dati trasporto stradale 1990-2020. Available online: http://www. http://emissioni.sina.isprambiente.it/serie-storiche-emissioni/
- Sabato, M.; Dattilo, B.; Di Torrice, M. Destinazione Italia: turismo e competitivita’ territoriale. Un’analisi regionale della domanda turistica dei residenti. XL Annual Scientific Conference of A. I. S. Re. (Associazione Italiana di Scienze Regionali), L’Aquila, Italy, 16-18 September 2019. Available online: https://www.aisre.it/images/aisre/2019_papers/Sabato-16-16-Sabato-Mariangela.pdf
- United Nations. Transforming our world: the 2030 Agenda for Sustainable Development. Available online: https://epale.ec.europa.eu/sites/default/files/21252030_agenda_for_sustainable_development_web.pdf - Istat. The SDGs Report. Available online: https://www.istat.it/en/well-being-and-sustainability/sustainable-development-goals/sdgs-report .
- Istat. Nota Metodologica" Indagine Viaggi e vacanze, Istat, anni 2015 e segg; Available online: https://www.istat.it/it/archivio/178695
- Betta, L.; Dattilo, B.; di Bella, E.; Finocchiaro, G.; Iaccarino, S. Tourism and Road Transport Emissions in Italy. Sustainability 2021, 13, 12712. https://doi.org/10.3390/su132212712 - World Tourism Organization (2022), Measuring the Sustainability of Tourism – Learning from Pilots, UNWTO, Madrid, DOI: https://doi.org/10.18111/9789284424061.
- Scott, D., Hall, C. M., & Gössling, S. (2020). Pandemics, tourism and global change: A rapid assessment of COVID-19. Journal of Sustainable Tourism, 29(1), 1-20. DOI: 10.1080/09669582.2020.1758708
The indicator underestimates emissions because it counts neither the local trips taken once the destination is reached nor the route deviations typical of touring journeys.
Despite the 2023 introduction of engine-capacity and fuel-type variables, the retrospective recalibration for 2017-2022 still relies on vehicle-fleet allocation models, introducing additional uncertainty and a slight discontinuity in the time series.
To sharpen, and thus render more accurate, the territorial attribution of pollutants, a future development foresees a more laborious breakdown of each journey into regional segments, assigning to each segment the emissions generated along the route between the trip’s origin and destination.
ISPRA
ISTAT
ISTAT - Indagine "Viaggi e Vacanze"
ISPRA - "Fattori medi di emissioni stradali" https://fetransp.isprambiente.it/#/
National, Regional
2017-2023
The indicator combines the kilometreage of road tourist segments for trips recorded by the Istat survey “Viaggi e vacanze” (“Trips and Holidays”) with the average road-transport emission factors provided by ISPRA. Both information sets require extensive data processing. For methodological details, see: Betta, L.; Dattilo, B.; di Bella, E.; Finocchiaro, G.; Iaccarino, S. Tourism and Road Transport Emissions in Italy. Sustainability 2021, 13, 12712. https://doi.org/10.3390/su132212712
From 2023 the Istat survey contains two new questions on the engine capacity and fuel type (petrol, diesel, hybrid, electric, etc.) of the car actually used for the trip.
-
Previous rounds (2017-2022) lacked these variables: tourist kilometreage was assumed to be distributed across vehicle categories in proportion to their presence in the registered fleet (ACI).
-
The new variables remove that proportionality assumption and align vehicle classification with real tourist behaviour, markedly improving the accuracy of emission attribution.
The use of Istat data sharpens the analysis because, previously—without trip-specific variables—it was clear that holiday vehicle choices did not faithfully reflect the fleet composition; now the analysis is more accurate and genuinely “touristic”.
Ultimately, adopting the engine-capacity and fuel-type variables creates a slight structural break relative to the 2024 edition but greatly refines the indicator.
In 2023 the emission profile of road tourist travel contracted relative to the 2022 post-pandemic peak. As Table 1 shows, total national emissions fell by −11 % (CO₂) to −18 % (PM₂.₅), driven by slightly lower tourist demand and the gradual renewal of the vehicle fleet.
Nevertheless, the private car remains dominant: in 2023 it contributes 93.7 % of CO, 96.1 % of VOCs, 90.2 % of NOx, 86.2 % of PM₂.₅ and 93.4 % of CO₂ (Table 2). “Recreational” vehicles (motorhomes, caravans, vans) rank second, concentrating 11.9 % of PM₂.₅ and 8.1 % of NOx despite carrying a far smaller share of trips. Motorcycles, scooters and residual modes remain marginal (< 5 %).
In short, the 2023 situation is better than 2022 thanks to shorter distances and the Euro 6-plus effect, yet the strong reliance on private cars persists—the real “critical node” for decarbonising road tourism.
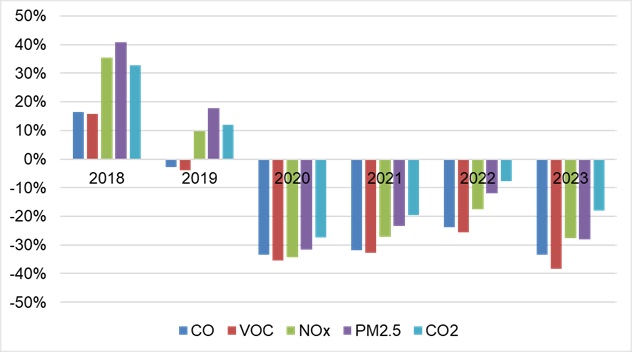
The evolution depicted in Figure 1 traces a four-act arc. In the pre-pandemic phase (2017-2019) emissions rose steadily (+16 % in CO between 2017 and 2018), reflecting expanding domestic tourist demand. The year 2020 brought an abrupt lockdown-related contraction: every pollutant fell by more than one-third versus 2019, underscoring tourism’s environmental weight.
During 2021-2022 a vigorous rebound occurred (+12–15 % per year) as restrictions eased; 2022 recorded series highs for NOx and PM₂.₅. The year 2023, although “tainted” by the methodological change, appears to mark stabilisation: emissions fell below 2017 levels for all components (−18 % PM₂.₅; −12 % NOx; −11 % CO₂) and a slight redistribution of the emission burden occurred—the car share of NOx dropped by 2 percentage points and that of PM₂.₅ by almost 2 points compared with 2022 (Table 2). This suggests that reductions are consolidating and that the modal mix is slowly diversifying. Nonetheless, the indicator’s current trend assessment remains negative, because both the methodological change and the modest hints of modal shift still require verification.
| Allegati |
|---|
Titolo
Table 1: Estimated national emissions Fonte
ISPRA |
Titolo
Table 2: Emissions from trips in Italy by type of vehicle used (tonnes and percentage) Fonte
ISPRA |
Titolo
Table 3: Emissions produced by destination region (2023) Fonte
ISPRA |
Thumbnail
Titolo
Figure 1: Percentage growth of each emission, taking 2017 as the base year Fonte
ISPRA |
Thumbnail
Titolo
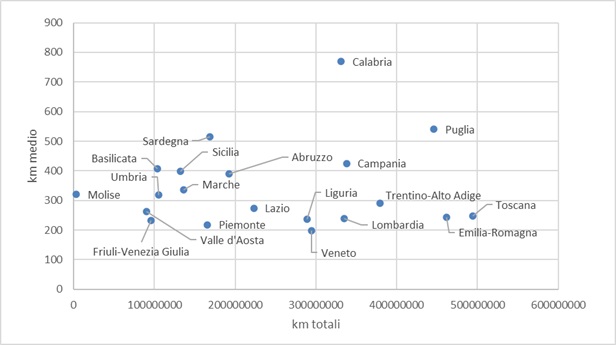
Figure 2: Kilometres travelled and average distance to reach the trip destination regions (2023) Fonte
ISPRA processing of Istat data |
Thumbnail
Titolo
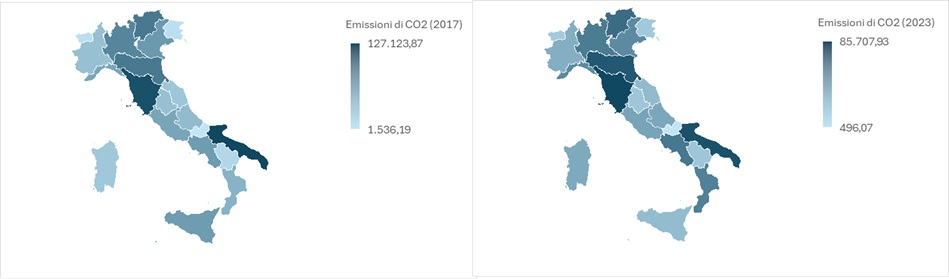
Figure 3: CO₂ emissions produced by region, 2017 – 2023 Fonte
ISPRA |
Spatial analysis confirms uneven emission distribution: Tuscany, Apulia, Emilia-Romagna, Trentino-Alto Adige and Campania were the most emissive regions in 2023—especially for CO₂ and NOx—owing to high-intensity tourist attractors (art cities, seaside, mountains) and longer average travel distances. Molise, Basilicata, Umbria and Aosta Valley remained at low levels (Table 3 and Figure 2).
The 2022–2023 changes—though “tainted” by the methodological shift—show pressure declines in most regions, mirroring the national fall, although Alpine areas display a winter rebound linked to skiing. Comparative CO₂ maps (Figure 3) reveal that nine regions still exceed 2017 levels, indicating that the transition toward low-emission tourist mobility proceeds at differing speeds across the territory.