Data aggiornamento scheda:
The Allergenic and Annual Pollen Integral indicator considers two integrals: the Annual Pollen Integral (IPAn) and the Allergenic Pollen Integral (IPA) which describe the quantity of pollen present in a year in the atmosphere of the locations where the monitoring stations are positioned. The Annual Whole Pollen and the Allergenic Whole Pollen are locally subject to very significant variations from one year to the next caused by the different trends of seasonal weather and climate characteristics. These are cumulative quantitative indicators which therefore do not give indications on the distribution methods of airborne pollen during the year.
Data aggiornamento scheda:
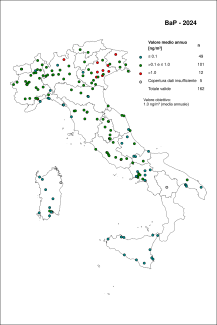
The indicator is based on the concentration data of benzo(a)pyrene in the atmosphere, measured during 2024 in monitoring stations distributed throughout the national territory, collected and archived in ISPRA in the InfoAria database, in accordance with the provisions of Directive 2008/50/EC (and the legislative decree transposing Legislative Decree 155/2010) and Decision 2011/850/EU. The monitoring stations that measured and communicated B(a)P data are 167, of which 162 have data series with sufficient time coverage to verify the reference values. Exceedances of the target value were recorded in 12 stations, equal to 7.4% of cases.
Data aggiornamento scheda:
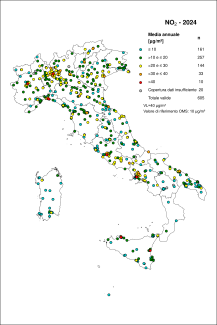
The indicator is based on nitrogen dioxide (NO) concentration data 2) in the atmosphere measured during 2024 in monitoring stations distributed across the national territory, collected and archived by ISPRA in databases InfoAria, in accordance with the provisions of Directive 2008/50/EC (and the legislative decree transposing Legislative Decree 155/2010) and Decision 2011/850/EU. The monitoring stations that measured and reported NO 2 there are 625, of which 605 have data series with sufficient time coverage to verify the reference values. The hourly limit value is respected everywhere: in no station has 200 µg/m³, as an hourly average, been exceeded more than 18 times. The WHO reference value, which does not foresee exceeding 200 µg/m³, is exceeded in 5 stations (equal to 0.83% of stations with sufficient temporal coverage). The annual limit value, equal to 40 µg/m³ as an annual average, is exceeded in 10 stations (1.7%). The WHO reference value for long-term effects on human health, equal to 10 µg/m³ as an annual average, is exceeded in 444 stations (73.4%).
Data aggiornamento scheda:
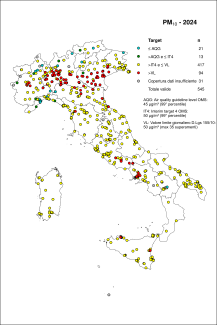
The indicator is based on PM concentration data 10 in the atmosphere measured during 2024 in monitoring stations distributed throughout the national territory, collected and archived in ISPRA in the InfoAria database, in accordance with the provisions of Directive 2008/50/EC (and the legislative decree implementing Legislative Decree 155/2010) and Decision 2011/850/EU. The monitoring stations that measured and reported PM data 10 there are 576., of which those with sufficient time coverage for the verification of the reference values are 545. The annual limit value was exceeded in one station (equal to 0.2% of cases), while exceeding the daily limit value was recorded in 94 stations (equal to 17.2% of cases). Finally, both the annual WHO reference value (90.5% of cases) and the daily one (96.1% of cases) are exceeded in the majority of monitoring stations.
Data aggiornamento scheda:
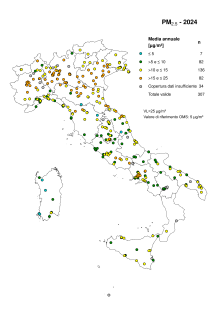
The indicator is based on PM concentration data 2,5 in the atmosphere measured during 2024 in monitoring stations distributed across the national territory, collected and archived in ISPRA in the InfoAria database, in accordance with the provisions of Directive 2008/50/EC (and the legislative decree transposing Legislative Decree 155/2010 and subsequent amendments) and Decision 2011/850/EU. The monitoring stations that measured and reported PM data 2,5 are 341, of these, 207 have data series with sufficient time coverage for the verification of the reference values are 307. The annual limit value of the PM 2,5 (25 µg/m³) is respected in all cases. However, in the majority of monitoring stations, the WHO annual reference value of 5 µg/m³ is exceeded (97.7% of cases).
Data aggiornamento scheda:
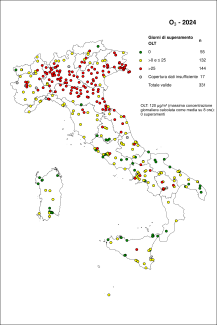
The indicator is based on the ozone concentration data in the atmosphere measured during 2024, in monitoring stations distributed across the national territory, collected and archived in ISPRA in the InfoAria database, in accordance with the provisions of Directive 2008/50/EC (and the legislative decree transposing Legislative Decree 155/2010) and Decision 2011/850/EU. The monitoring stations that measured and for which O. Data were transmitted 3 there are 348., of which those with sufficient time coverage for the verification of the threshold values and the long-term objective for the protection of human health are 331. The suburban, rural and rural background stations that respect the minimum percentage required for the calculation of the long-term objective for the protection of vegetation (AOT40v) are 158. The long-term objective for the protection of human health (OLT) was exceeded in almost all the stations: 83.4%. The percentage of stations where the OLT was exceeded for more than 25 days was 43.5%. The information threshold for health protection was exceeded in 17.5% of the stations while the alarm threshold was exceeded in only 1 station. The WHO reference value, equal to 100 µg/m³ as the 99th percentile, is exceeded in 310 stations (equal to 94% of the stations with sufficient temporal coverage). The long-term objective for vegetation protection (AOT40v) was exceeded in almost all stations (92.4%).
Data aggiornamento scheda:
Estimates of the average annual exposure weighted for the population were developed ( Population Weighted Exposure , PWE) to nitrogen dioxide (NO 2) aggregated at municipal level, through the integrated use of statistical measures and models. The data obtained, relating to the period 2016-2024, allow the comparison of PWE between all municipalities and to have a complete picture of the average exposure at a national level.
In 2024, 77% of the population was exposed to levels above the WHO guideline value (10 µg/m 3).
The national average of PWE was 11 µg/m³ ( range minimum-maximum: 3 – 36 µg/m 3).
In the period 2016-2024, a trend towards a reduction in exposure levels equal to 29% on average is observed, mainly linked to the reduction of emissions from vehicular traffic.
Data aggiornamento scheda:
Estimates of the average annual exposure weighted for the population were developed ( Population Weighted Exposure , PWE) to ozone (O 3) aggregated at municipal level, through the integrated use of statistical measures and models. The data obtained, relating to the period 2016-2024, allow the comparison of PWE between all municipalities and to have a complete picture of the average exposure at a national level.
In 2024, 100% of the population was exposed to levels above the WHO guideline value (60 µg/m 3 as the average of the distribution of the daily maximums of the 8-hour moving averages in the period from April to September).
The national average of PWE was 96 µg/m 3 ( range minimum-maximum: 50 – 119 µg/m 3).
In the period observed, there was no trend towards a reduction in exposure levels.
Data aggiornamento scheda:
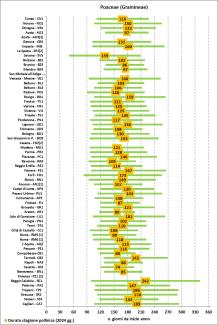
The indicator describes the times of pollination of a specific botanical family during the year. The start and end dates and duration of a family's pollen season change based on location, because pollination is extremely sensitive to weather and climate differences. It should be noted that the duration of the pollen season is not related to the greater or lesser quantity of airborne pollen. The comparative examination of the data of the beginning and end of pollination of the monitored families can highlight the presence of airborne pollen, for some locations, even in the months of January and December.
Data aggiornamento scheda:
Estimates of the average annual exposure weighted for the population were developed ( Population Weighted Exposure , PWE) to PM10 aggregated at municipal level, through the integrated use of statistical measures and models. The data obtained, relating to the period 2016-2024, allow the comparison of PWE between all municipalities and to have a complete picture of the average exposure at a national level.
In 2024, 95% of the population was exposed to levels above the WHO guideline value (15 µg/m 3).
In the period observed there is no trend towards reduction in exposure levels with the national average which in 2024 is equal to 20 µg/m 3 ( range minimum-maximum: 6 – 35 µg/m 3).
Data aggiornamento scheda:
Estimates of the average annual exposure weighted for the population were developed ( Population Weighted Exposure , PWE) to the PM 2.5 aggregated at municipal level, through the integrated use of statistical measures and models. The data obtained, relating to the period 2016-2024, allow the comparison of PWE between all municipalities and to have a complete picture of the average exposure at a national level.
In 2024, 100% of the population was exposed to levels above the WHO guideline value (5 µg/m 3). The national average of PWE was 12 µg/m 3 (minimum-maximum range: 4 – 24 µg/m 3).
In the period 2016-2024, the national average goes from 15 µg/m 3 of 2016 at 12 µg/m 3 of 2024, recording a reduction of 20%.
Data aggiornamento scheda:
The indicator is based on information related to air quality plans which, according to Directive 2008/50/EC (and its national transposition, Legislative Decree 155/2010), must be adopted in case of exceedances of the limits set for major air pollutants.
At the national level, information on air quality plans, communicated by the regions and autonomous provinces in the format required by Decision 2011/850/EU, is collected and stored by ISPRA in the InfoAria database, and subsequently transmitted to the European Commission (EC) "within two years of the end of the year in which the first exceedance was observed" (Directive 2008/50/EC, Article 23).
This information does not need to be transmitted annually, but only when new elements are to be reported. Therefore, both the information submitted in 2024 and the data provided in previous years by regions/autonomous provinces that were not required to submit new data are analysed.
The analysis shows that the measures reported in 2023 (adopted following exceedances recorded in 2021) and those previously submitted and still in force total 517, of which 50% fall within the Road Transport sector and 17% within the Residential and Commercial sector.
The above-mentioned analysis shows that the measures reported in 2024 (adopted following exceedances of limit values recorded in 2022), together with those submitted in previous years and still in force, amount to a total of 527. Of these, 50.1% fall within the Road transport sector and 17.5% within the Residential and commercial sector.