Panel 1
Giorgio Cattani, Mariacarmela Cusano, Alessandro Di Menno di Bucchianico, Raffaela Gaddi, Alessandra Gaeta, Giuseppe Gandolfo, Gianluca Leone
The indicator is based on nitrogen dioxide (NO₂) concentration data measured in 2023 at monitoring stations distributed across the national territory, collected and archived by ISPRA in the InfoAria database, in accordance with Directive 2008/50/EC (and its national transposition, Legislative Decree 155/2010) and Commission Implementing Decision 2011/850/EU. A total of 630 monitoring stations measured and reported NO₂ data. Of these, 600 provided data series with sufficient temporal coverage to verify compliance with reference values.
The hourly limit value was respected at all stations: no exceedance of 200 µg/m³ (hourly average) for more than 18 occasions was recorded. The WHO reference value, which does not permit any exceedances of 200 µg/m³, was exceeded at 8 stations (1.3% of those with sufficient data coverage). The annual limit value, set at 40 µg/m³ (annual mean), was exceeded at 13 stations (2.2%). The WHO guideline value for long-term human health protection, set at 10 µg/m³ as an annual mean, was exceeded at 450 stations (75.0%).
Nitrogen dioxide (NO₂) is a reddish-brown gas, poorly soluble in water, toxic, with a strong and pungent odor, and a potent respiratory irritant. It is predominantly a secondary pollutant, as it is formed in the atmosphere through the oxidation of nitric oxide (NO); only a smaller fraction is directly emitted into the atmosphere. The main source of nitrogen oxides (NOₓ = NO + NO₂) is road traffic; other sources include residential and industrial heating systems, power generation plants, and a wide range of industrial processes.
NO₂ is a widespread air pollutant with well-documented adverse effects on human health. Along with nitric oxide, it contributes to photochemical smog, acting as a precursor to secondary pollutants such as tropospheric ozone and secondary fine particulate matter. It also plays a role in eutrophication and acid rain phenomena.
The indicator was developed using NO₂ concentration data measured in 2023 at monitoring stations distributed throughout the national territory, collected and archived by ISPRA in the InfoAria database, in compliance with Commission Implementing Decision 2011/850/EU. In addition to parameters used for comparison with the regulatory limit values for human health protection (Legislative Decree 155/2010) and WHO guideline values (WHO-AQG, 2021), the following hourly mean percentiles were calculated: 5th, 25th, 50th, 75th, 98th, 98.8th, 99.9th, and maximum.
To provide information on the state of air quality through statistical parameters calculated from ambient nitrogen dioxide (NO₂) concentration data, verifying compliance with the regulatory limit values and comparing the results with the reference levels established by the World Health Organization (WHO).
Directive 2008/50/EC of the European Parliament and of the Council of 21 May 2008 on ambient air quality and cleaner air for Europe.
Legislative Decree 155/2010 – Legislative Decree of 13 August 2010, No. 155, implementing Directive 2008/50/EC on ambient air quality and cleaner air for Europe (Official Gazette No. 216 of 15/09/2010 – Ordinary Supplement No. 217 – in force since 30/09/2010).
Commission Implementing Decision 2011/850/EU – laying down rules for Directive 2004/107/EC and Directive 2008/50/EC of the European Parliament and of the Council as regards the reciprocal exchange of information and reporting on ambient air quality.
The objective of Directive 2008/50/EC is to enable the assessment of ambient air quality on a harmonized basis, to gather information on air quality status for the purpose of combating air pollution, to ensure public availability of such information, and to promote cooperation among Member States.
Legislative Decree 155/2010, which transposes the above-mentioned directive into national law, also aims to enable regions and autonomous provinces to assess and manage ambient air quality. The limit values set by Legislative Decree 155/2010 represent ambient air quality objectives to be pursued in order to avoid, prevent, and reduce harmful effects on human health and the environment. The WHO reference values serve as guidance for reducing the health impacts of air pollution.
The NO₂ ambient air quality limit values established by Legislative Decree 155/2010 are as follows:
- 1-hour averaging period: 200 µg/m³, not to be exceeded more than 18 times per calendar year;
- Annual averaging period: 40 µg/m³.
The WHO guideline values for nitrogen dioxide in ambient air, as indicated in the WHO Global Air Quality Guidelines 2021, are:
- 1-hour averaging period: 200 µg/m³, not to be exceeded at any time during the calendar year;
- Annual averaging period: 10 µg/m³.
Panel 2
WHO-AQG, 2021, Global air quality guidelines. Particulate matter (PM2.5 and PM10), ozone, nitrogen dioxide, sulfur dioxide and carbon monoxide. Geneva: World Health Organization; 2021.
SNPA, 2024, La qualità dell’aria in Italia. Edizione 2023. Report di sistema SNPA 40/2024.
ISPRA, Annuario dei dati ambientali, various editions
Data quality assessment
Autonomous Provinces
Regions
SNPA (National System for Environmental Protection)
ISPRA, Database InfoAria
National
Regional: (20/20)
Provincial: (104/110)
Municipal: (420/8047)
2014-2023
Indicator assessment
The indicator is based on atmospheric nitrogen dioxide (NO₂) concentration data measured at monitoring stations distributed across the national territory, collected and archived by ISPRA in the InfoAria database, in accordance with Commission Implementing Decision 2011/850/EU. Parameters were calculated for comparison with the limit values for human health protection established by the reference legislation (Legislative Decree 155/2010) and with the WHO guideline values for health protection. All parameters were calculated following European standards and were validated by the National System for Environmental Protection (SNPA).
For the comparison with the hourly and annual limit values set by Legislative Decree 155/2010 and the WHO reference values (both shown in Figures 2 and 3), only data series with a minimum temporal coverage of 90% (excluding gaps due to periodic calibration or routine maintenance) were considered.
The statistical trend analysis for the period 2014–2023 was conducted using the Mann-Kendall method corrected for seasonality. Implementing a deseasonalization method helps to minimize the effect of interannual fluctuations caused by variations from the average seasonal cycle, to reveal underlying trends, to quantify their statistical significance, and to estimate the annual average concentration change over the observation period.
The hourly limit value was respected at all monitoring stations: no station recorded more than 18 exceedances of the 200 µg/m³ hourly mean threshold. The WHO reference value, which does not allow any exceedance of 200 µg/m³, was exceeded at 8 stations (1.3% of those with sufficient temporal coverage, Figure 2). The annual limit value of 40 µg/m³ (annual mean) was exceeded at 13 stations (2.2%). The WHO reference level for long-term human health protection, set at 10 µg/m³ as an annual mean, was exceeded at 450 stations (75.0%; Figure 3).
Almost all exceedances occurred at traffic-oriented monitoring stations located in major urban areas.
Based on the statistical analysis conducted using the Mann-Kendall method corrected for seasonality, a statistically significant decreasing trend in NO₂ concentrations was observed in 85% of cases (443 monitoring stations out of 520), with an estimated average annual variation of -0.9 µg/m³ per year [-4.0 µg/m³y to -0.1 µg/m³y] (Figures 4 and 5). Among the subset of stations exhibiting a statistically significant downward trend, the average annual reduction was 3.5% [-9.3% to -0.8%], indicating a consistent underlying trend of decreasing NO₂ concentrations across Italy (Table 4).
Data
Figura 1: NO2 - Classificazione dei punti di campionamento secondi i criteri di ubicazione su macroscala (Allegato III, D.Lgs.155/2010) (2024)
Elaborazione ISPRA su dati SNPA
Figura 2: NO2 - Stazioni di monitoraggio e superamenti del valore limite orario per la protezione della salute (2024)
Elaborazione ISPRA su dati SNPA

Figura 3: NO2 - Stazioni di monitoraggio e superamenti del valore limite annuale per la protezione della salute (2024)
Elaborazione ISPRA su dati SNPA
Figura 4: NO2 - Distribuzione sul territorio delle stazioni analizzate e variazione percentuale media annua stimata della concentrazione.
Elaborazione ISPRA su dati SNPA
Risultati dell’analisi del trend con il test di Kendall corretto per la stagionalità su un campione di 520 stazioni (2015-2024).
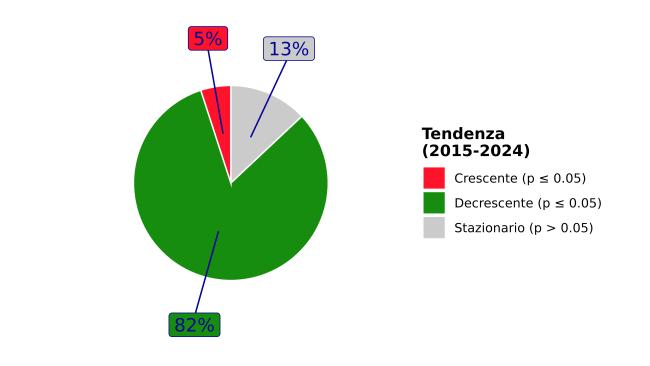
Figura 5: NO2 - Distribuzione percentuale delle stazioni di monitoraggio in base all’andamento del trend osservato nel periodo 2015 - 2024
Elaborazione ISPRA su dati SNPA
p≤ 0,05: il trend osservato è statisticamente significativo
p>0,05: non può essere esclusa l'ipotesi nulla (assenza di trend)
Sintesi dei risultati dell’analisi del trend (2015 - 2024) con il test di Kendall corretto per la stagionalità delle concentrazioni di NO2 in Italia su una selezione di 520 stazioni di monitoraggio distribuite sul territorio nazionale
Tabella 1 – NO2 - Stazioni di monitoraggio: dati e parametri statistici per la valutazione della qualità dell'aria (2024)
Elaborazione ISPRA su dati SNPA
“1” tipo di zona: U = URBANA; S = SUBURBANA; R = RURALE
“2” tipo di stazione: T = TRAFFICO; F = FONDO; I = INDUSTRIALE
"3" in grassetto i dati riportati in mappa. Valore evidenziato in grassetto soltanto per serie di dati con almeno il 90% di dati validi al netto delle perdite dovute alla taratura periodica o alla manutenzione ordinaria (in accordo ai criteri di qualità definiti nella normativa vigente, D.Lgs.155/2010).
“-” valore non calcolato per mancanza di dati.
Tabella 2 - NO2. Classificazione delle zone rispetto alle soglie di valutazione e verifica della presenza di superamenti del valore limite orario ai sensi del D.Lgs.155/2010 (2024)
Elaborazioni ISPRA su dati SNPA
zona: parte del territorio nazionale delimitata, ai sensi del D.Lgs 155/2010, ai fini della valutazione e della gestione della qualità dell'aria ambiente;
"agglomerato: zona costituita da un'area urbana o da un insieme di aree urbane che distano tra loro non più di qualche chilometro oppure da un'area urbana principale e dall'insieme delle aree urbane minori che dipendono da quella principale sul piano demografico, dei servizi e dei flussi di persone e merci, avente: 1) una popolazione superiore a 250.000 abitanti oppure; 2) una popolazione inferiore a 250.000 abitanti e una densità di popolazione per km 2 superiore a 3.000 abitanti;"
Superamento VL giornaliero: Si intende superato qualora sia stato determinato il superamento in almeno una stazione di monitoraggio collocata nel territorio della zona.
Classificazione: aboveUAT: superiore alla soglia di valutazione superiore (70% del valore limite orario, 140 μg/m³ da non superare più di 18 volte per anno civile) LAT-UAT : compresa tra la soglia di valutazione inferiore e la soglia di valutazione superiore belowLAT : inferiore alla soglia di valutazione inferiore (50% del valore limite orario, 100 μg/m³ da non superare più di 18 volte per anno civile)
(a) Valutazione del superamento ottenuta mediante modello
Il superamento delle soglie di valutazione superiore e delle soglie di valutazione inferiore deve essere determinato in base alle concentrazioni degli inquinanti nell'aria ambiente nei cinque anni civili precedenti. Il superamento si realizza se la soglia di valutazione è stata superata in almeno tre sui cinque anni civili precedenti.
Tabella 3 - NO2. Classificazione delle zone rispetto alle soglie di valutazione e verifica della presenza di superamenti del valore limite annuale ai sensi del D.Lgs.155/2010 (2024)
Elaborazioni ISPRA su dati SNPA
zona: parte del territorio nazionale delimitata, ai sensi del D.Lgs 155/2010, ai fini della valutazione e della gestione della qualità dell'aria ambiente;
"agglomerato: zona costituita da un'area urbana o da un insieme di aree urbane che distano tra loro non più di qualche chilometro oppure da un'area urbana principale e dall'insieme delle aree urbane minori che dipendono da quella principale sul piano demografico, dei servizi e dei flussi di persone e merci, avente: 1) una popolazione superiore a 250.000 abitanti oppure; 2) una popolazione inferiore a 250.000 abitanti e una densità di popolazione per km2 superiore a 3.000 abitanti;"
Superamento VL annuale: Si intende superato qualora sia stato determinato il superamento in almeno una stazione di monitoraggio collocata nel territorio della zona.
Classificazione: aboveUAT: superiore alla soglia di valutazione superiore (80% del valore limite annuale, 32 μg/m³) LAT-UAT : compresa tra la soglia di valutazione inferiore e la soglia di valutazione superiore belowLAT : inferiore alla soglia di valutazione inferiore (65% del valore limite annuale, 26 μg/m³) .
(a) Valutazione del superamento ottenuta mediante modello
Il superamento delle soglie di valutazione superiore e delle soglie di valutazione inferiore deve essere determinato in base alle concentrazioni degli inquinanti nell'aria ambiente nei cinque anni civili precedenti. Il superamento si realizza se la soglia di valutazione è stata superata in almeno tre sui cinque anni civili precedenti.
Tabella 4: NO2 - Analisi dei trend per stazione di monitoraggio (2015-2024)
Elaborazioni ISPRA su dati SNPA
p≤ 0,05: il trend osservato è statisticamente significativo
p>0,05: non può essere esclusa l'ipotesi nulla (assenza di trend)
Δy: variazione media annuale stimata sulla base dei risultati del test di kendall corretto per la stagionalità
A total of 630 monitoring stations measured and reported NO₂ data. Of these, 600 stations (95.2% of the total) met the minimum requirement of 90% temporal data coverage, excluding losses due to periodic calibration or routine maintenance. All regions are represented. The classification of NO₂ monitoring stations according to macroscale siting criteria, as defined by the legislation, is shown in Figure 1.
The entire national territory is divided into zones and agglomerations for the purpose of ambient air quality assessment, as established by Legislative Decree 155/2010. Each zone is classified based on threshold criteria set out in the same decree.
This classification is essential, as it defines the obligations for air quality assessment and is generally updated every five years. If a limit value exceedance is recorded at even one monitoring station during the year, the entire zone is considered in exceedance.
In 2023, exceedance of the annual limit value occurred in 10 out of 83 zones, spanning 8 regions (Table 3). The zones exceeding the limits are listed in Tables 2 and 3.
A statistical trend analysis of NO₂ concentrations for the period 2014–2023 was also conducted across 520 monitoring stations nationwide. The sample is homogeneous, meaning all included stations continuously produced data during the observation period, with an annual coverage of at least 75% (Table 4).