PERCENTAGE OF TREATED WASTEWATER
Data aggiornamento scheda:The percentage of treated wastewater reflects the amount of biodegradable organic load that reaches urban wastewater treatment plants compared to the total organic load produced by agglomerations (2,000 PE or more) across the national territory. In 2022-2023, this percentage is 93.51%, an increase compared to 2020 (93.3%).
STATE OF PROGRESS OF THE RIVER BASIN DISTRICT MANAGEMENT PLANS
Data aggiornamento scheda:
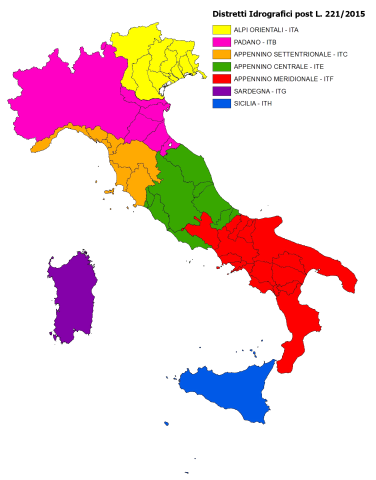
The Water Framework Directive, 2000/60/EC (WFD) requires the review and update of River Basin Management Plans (RBMPs) within 15 years of the directive’s entry into force and subsequently every six years (Article 13). Accordingly, to develop the planning cycle for the 2015-2021 period, the review and update of the first RBMPs adopted in 2010, began in 2012. This process was completed with the approval of the plans between March and June 2016. Subsequently, the second update of the RBMPs began, as required by Article 117, paragraph 2bis of Legislative Decree 152/2006. This update was finalized in December 2021 with the adoption of the RBMPs (for all river basin districts) by the Permanent Institutional Conference.
The Water Protection Plans (WPPs) are the plans through which regions, based on the objectives set at the river basin district level by the RBMPs, define the measures to ensure the achievement or maintenance of water bodies' quality objectives and the necessary actions for their qualitative and quantitative protection at the regional level.
To date, three Regions and the Autonomous Provinces of Trento and Bolzano have an updated WPP based on the 2021 RBMPs. Another seven regions have a WPP adopted or approved after the publication of the 2015 RBMPs. The remaining nine Regions have a WPP predating the 2015 RBMPs.
In 2024, none of the regions with a WPP approved or updated before the 2021 RBMP has aligned their WPP with the latest management cycle of the RBMP and its related updates.
WASTEWATER TREATMENT PLANTS - COMPLIANCE OF THE URBAN WASTEWATER SEWAGE SYSTEM
Data aggiornamento scheda:The presence or absence of a sewage network and the percentage of wastewater conveyed into collection systems indicate the degree of compliance with the requirements of the applicable regulations. In 2022-2023, the national compliance rate is 99.1%. Of the organic load, 95.7% is conveyed into the sewer system, 3.6% is treated through individual systems, while 0.7% is not connected.
WASTEWATER TREATMENT PLANTS - COMPLIANCE OF URBAN WASTEWATER TREATMENT SYSTEMS
Data aggiornamento scheda:Compliance monitoring allows for an understanding of the technological adaptation status of urban wastewater treatment systems for agglomerations greater than or equal to 2,000 PE (Population Equivalent). This is particularly useful for planning potential actions aimed at water protection.
Between 2022 and 2023, out of the 3,037 agglomerations analyzed, approximately 77% were found to be compliant, 13.8% non-compliant, 4.6% partially compliant, and 4.6% with data unavailable. A 100% compliance rate is recorded in Piedmont, Emilia-Romagna, Umbria, and the Autonomous Provinces of Trento and Bolzano.