Cristina Frizza
Statistical information on environmental taxes can be broken down by tax category, corresponding units, environmental activity category, and revenue destination. In Italy, environmental taxes will amount to €62.4 billion in 2025 (+3.1% compared to the previous year). In 2025, environmental tax revenue will correspond to 6.4% of total taxes and social security contributions and approximately 3% of gross domestic product.
The indicator measures environmental tax revenue in Italy, distinguishing it by type of tax and category of taxpayers (residents and non-residents). An environmental tax is a tax whose taxable base is a physical quantity, or its equivalent, that has a recognized negative impact on the environment. Environmental taxes are classified into three categories: Energy, which includes taxes on energy products and electricity, including those applied to fuels used in transportation and revenues related to greenhouse gas emission permits; Transport, which includes taxes on the ownership and use of vehicles and other means of transportation, excluding taxes on fuels, which fall into the energy category; Pollution and Natural Resources, which includes taxes on emissions into the atmosphere and water, waste management, noise, other forms of environmental pressure, and taxes on the extraction or use of natural resources. Currently, the natural resources category It does not include any taxes recorded in Italy, with the exception of specific levies related to oil and gas extraction. The indicator allows for an analysis of both the composition of environmental tax revenue and the contribution of different taxpayer categories to financing public revenues from environmental taxation.
Monitor the trend of environmental tax revenue, its composition by tax category, and its distribution among different taxpayer types. The indicator supports the evaluation of the role of environmental taxation in public policy and provides an information base for analyzing the economic effects of environmental taxes on productive sectors, competitiveness, public revenue, and the transition to a more sustainable economy.
Regulation (EU) No. 691/2011 on European environmental economic accounts
Environmental taxes – A statistical guide – 2024 edition (https://ec.europa.eu/eurostat/en/web/products-manuals-and-guidelines/w/ks-gq-23-016)
Data on environmental taxes relating to pollution and natural resources are presented together because for some countries it is not possible to distinguish between the two types of taxes.
Istat (National Institute of Statistics)
IstatData: https://esploradati.istat.it/databrowser/#/it/dw/categories/IT1,DATAWAREHOUSE,1.0/UP_ACC_AMBIEN
National
2008-2025
Proceeds from environmental taxes
Green Deal (Enabling)
The indicator is constructed according to the Eurostat methodology for environmental tax statistics, consistent with Regulation (EU) No. 691/2011 on environmental economic accounts and the European System of Accounts (ESA 2010). Environmental taxes are all tax revenues whose tax base is a physical unit (or its proxy) of an activity or product that has a proven negative effect on the environment and that is classified as a tax in the national accounts. Revenues are attributed to the following categories: taxes on energy, transport, pollution, and resource use. The indicator is calculated as the total amount of revenue from environmental taxes and, where applicable, related to GDP or total taxes and social contributions to allow for comparisons over time and internationally.
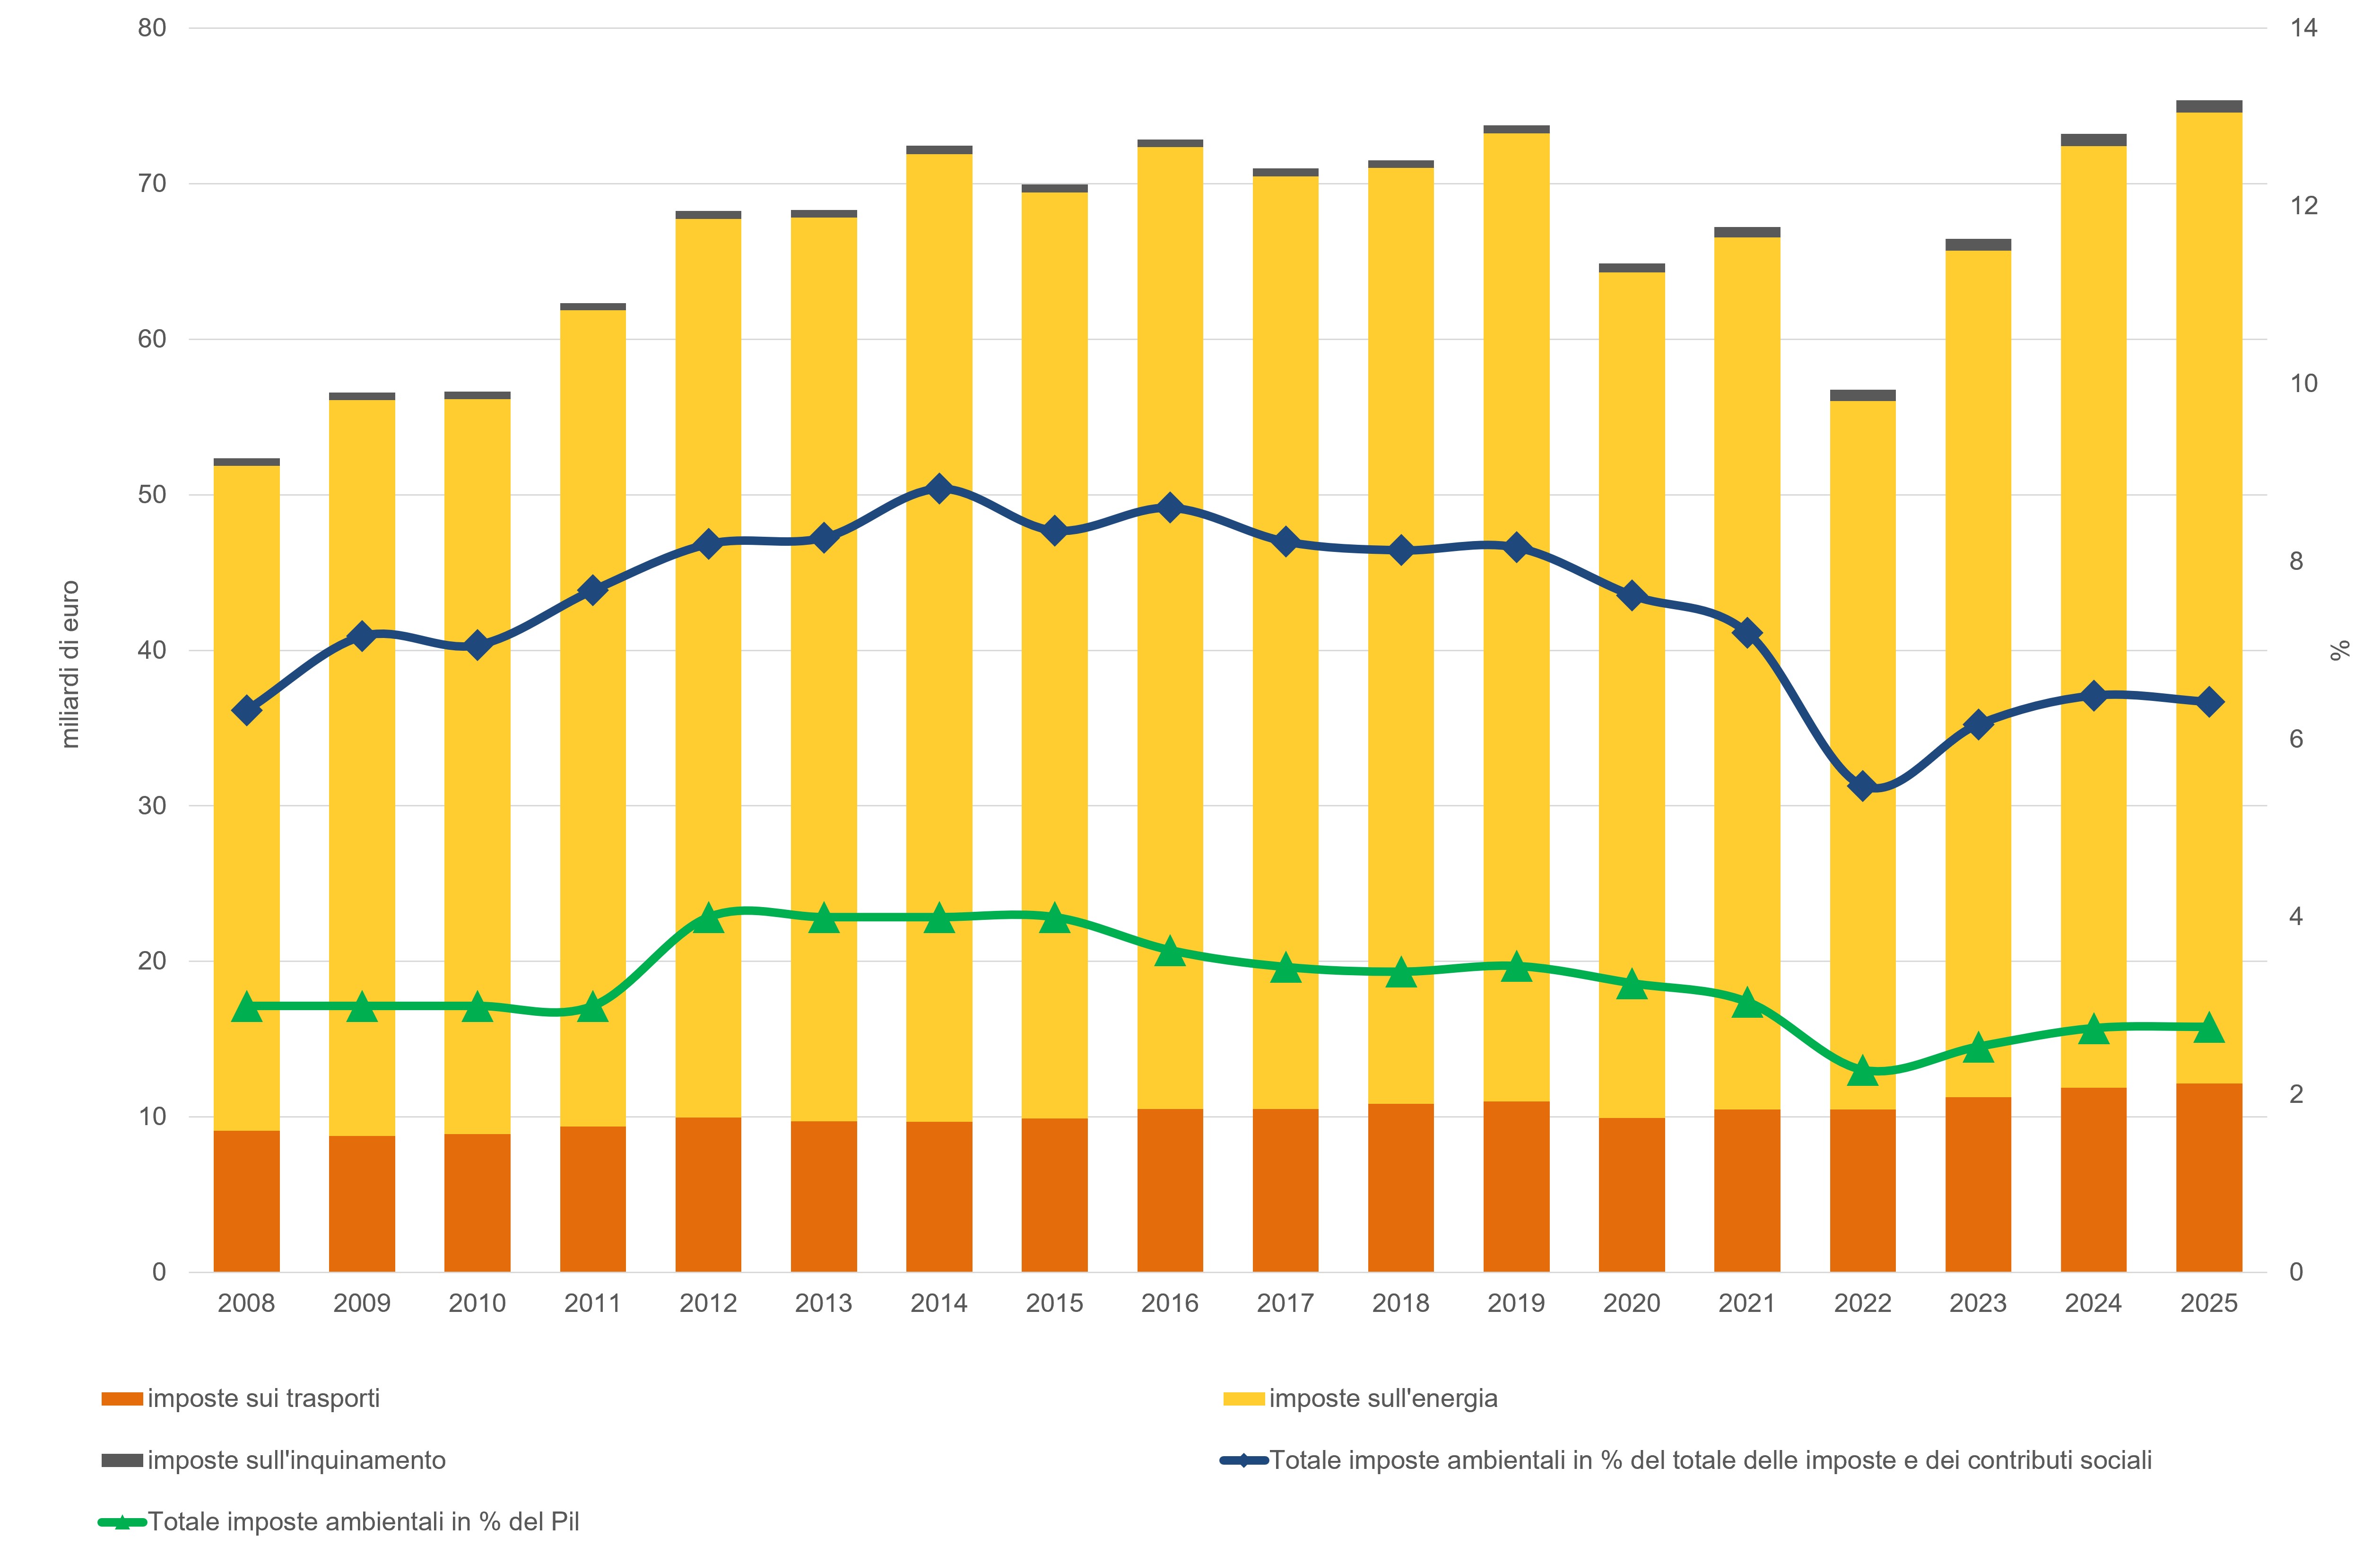
In 2025, environmental tax revenue in Italy will amount to €62.4 billion, equal to 6.4% of total taxes and social contributions and 2.8% of gross domestic product. The share of environmental taxes in GDP is higher than the European Union average, which according to Eurostat stands at around 2.1% of GDP (2024 data), just as the share of total taxes and social contributions is higher than the European average (5.1%). This highlights the relatively high incidence of environmental taxation in Italy compared to other European countries (Table 1).
After a period of substantial stability between 2014 and 2019, environmental tax revenues saw a marked decline until 2022 (approximately -27% compared to 2019), mainly due to reduced energy consumption and measures adopted to mitigate the effects of the energy crisis. In subsequent years, revenues began to grow again, with a 37% increase between 2022 and 2025, reaching €62.4 billion. The recovery led to an increase in the incidence of environmental taxes on total tax and social security revenues, up to 6.4%, while the ratio to GDP remained essentially stable, around 3%, indicating revenue growth in line with that of the economy. (Table 1).
| Data |
|---|
Titolo
Table 1: Revenue from environmental taxes by tax category Fonte
Istat |
Titolo
Table 2: Revenue from environmental taxes per unit corresponding to the tax and per tax Fonte
Istat Note
The unit of measurement is expressed at current prices |
Titolo
Table 3: Revenue from environmental taxes by destination of revenue Fonte
Istat |
Thumbnail
Titolo
Figure 1: Revenue from environmental taxes by type of tax Fonte
ISPRA processing based on Istat data |
Over the period 2008-2025, among the categories of environmental taxes, energy taxes accounted for an average of over 80% of the total; transportation taxes, mostly on vehicle ownership, accounted for about 19%; and pollution taxes accounted for over 1%. In Italy, no tax measures are planned for the extraction of natural resources (Table 1, Figure 1). In 2025, economic activities, households, and non-resident units contributed 45%, 54%, and 1% of environmental taxes, respectively (Table 2). In the same year, approximately 50% of the total energy taxes were paid by economic activities and approximately 49% by households. Also in 2025, the main contributors to transportation tax revenues were households (74% of the total revenue from this category), followed by economic activities for the remainder. Nearly 60% of the total pollution tax revenue comes from households and 38% from economic activities (Table 2). If we analyze the allocation of environmental tax revenue based on the type of specific tax (purpose taxes), whose revenue is intended to finance environmental protection expenditures (therefore the remainder concerns environmental taxes whose revenue is not used to finance environmental protection expenditures), we note that purpose taxes recorded their lowest point in the period considered in 2022, as their share of the total stood at 3.7% of total environmental tax revenue, rising to 14.2% in 2025 (Table 3).