Cristina Frizza
Statistical information on environmental taxes can be broken down by tax category, the units paying the tax, the class of environmental activity, and the destination of the revenue. In Italy, environmental taxes amounted to €60.8 billion in 2024 (+11.6% compared to the previous year). In 2023, revenue from environmental taxes accounted for about 6.1% of total tax and social contribution revenue and about 3% of Gross Domestic Product in 2024.
This indicator provides information on revenue by category of environmental tax and on the units paying the taxes. An environmental tax is characterized by having a tax base in a physical unit, or a proxy thereof, that has proven negative effects on the environment. Four main areas of environmental taxation can be identified: energy, transport, pollution, and natural resources. For energy, taxes apply to energy products used both for stationary and mobile pollution sources (i.e., for transport purposes); carbon dioxide taxes also fall within this area, as they are levied on energy products. The transport category does not include fuel use for transport; instead, it mainly includes taxes on ownership and use of vehicles and other means of transport. The pollution category includes taxes on atmospheric emissions (e.g., NOx and SOx), water discharges, waste management, and noise. The last area, for which there are no taxes in Italy, includes taxes on the extraction of natural resources except for oil and gas. The indicator measures revenue by tax category and the revenue from environmental taxes by unit (resident or non-resident) paying the tax. Below is the breakdown of Italy’s environmental tax categories: - Energy: border surcharge on non-condensable gases; border surcharge on mineral oils; tax on mineral oils and derivatives; tax on non-condensable gases; additional electricity tax by municipalities and provinces; electricity tax and system charges for renewable sources; natural gas tax; coal consumption tax; contribution on revenues of energy sector operators to the Energy, Gas and Water Authority; revenues from the Central Italian Storage Organization; proceeds from the use of emission permits. - Transport: Public Motor Vehicle Register (PRA); tax on motor liability insurance; vehicle taxes for businesses; vehicle taxes for households; air taxi tax; tax on boats and aircraft. -Pollution: special landfill levy; tax on sulfur dioxide and nitrogen oxides emissions; provincial tax for environmental protection; regional tax on aircraft noise emissions.
Environmental policies may use, in addition to 'command and control' instruments, more flexible tools such as economic instruments based on incentives to achieve solutions to environmental problems at lower costs, correct environmental externalities, or generate tax revenues for specific purposes. Economic instruments like environmental taxes aim to reinforce the "polluter pays" principle and achieve targeted goals. Environmental taxes can help discourage environmentally harmful behavior by providing incentives to reduce environmental impact and preserve natural resources by altering price signals. The aim of this indicator is to meet the growing need for knowledge regarding the role of economic instruments in environmental policy. This indicator may serve both directly and as an input for models used in economic analysis, such as estimating the impact of fiscal instruments on costs across economic sectors, inflation, or international competitiveness in specific sectors.
Regulation (EU) No. 691/2011 on European environmental economic accounts.
Environmental taxes – A statistical guide – 2024 edition (https://ec.europa.eu/eurostat/en/web/products-manuals-and-guidelines/w/ks-gq-23-016)
Data on environmental taxes concerning pollution and natural resource areas are presented jointly, as some countries cannot distinguish between the two types.
Istat
IstatData: https://esploradati.istat.it/databrowser/#/it/dw/categories/IT1,DATAWAREHOUSE,1.0/UP_ACC_AMBIEN
National
2008-2024
The methodology is available in the document: Environmental taxes – A statistical guide – 2024 edition (https://ec.europa.eu/eurostat/en/web/products-manuals-and-guidelines/w/ks-gq-23-016)
Environmental tax revenue in 2024 amounts to €60.8 billion, corresponding to 6% of total tax and social contribution revenue (in 2023) and about 3% of Gross Domestic Product (Table 1).
In Italy, after a period of substantial stability from 2014 to 2019, environmental tax revenue (at current prices) declined (–27% between 2019 and 2022) and then increased in subsequent years (+33% between 2022 and 2024). Changes in revenue are also reflected in the ratio of environmental taxes to total taxes, which stands at 6% (2023), while they are not reflected in the ratio to Gross Domestic Product, which remains at 3% (Table 1).
| Data |
|---|
Thumbnail
Headline
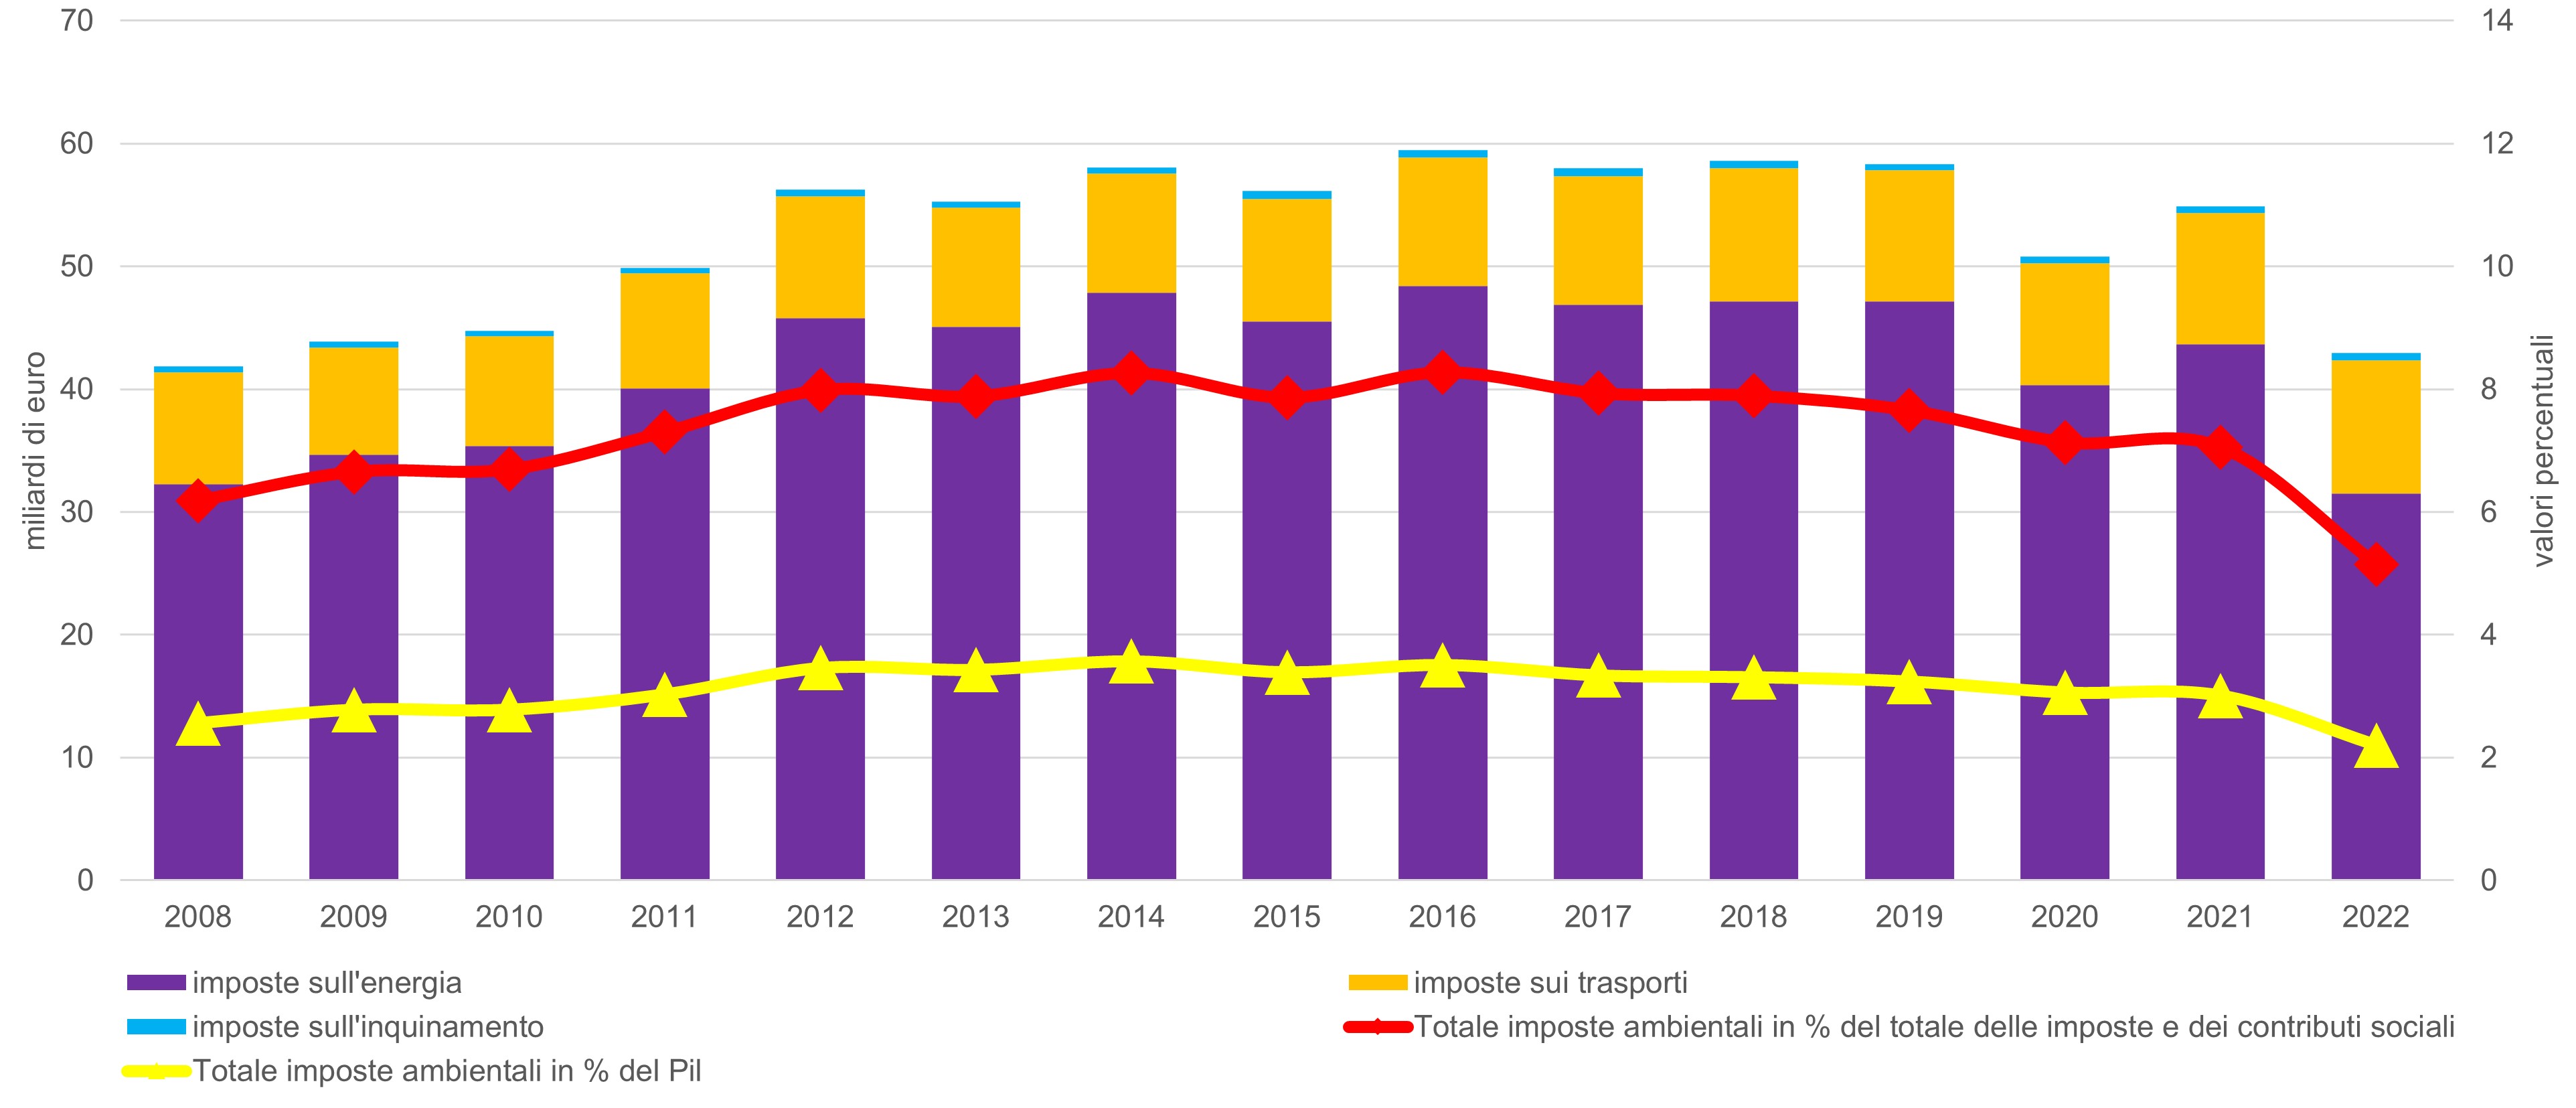
Figure 1: Environmental tax revenue by type of tax. Italy Data source
ISPRA elaboration of Istat data Note
The category of environmental taxes on natural resources is not present in Italy. |
Headline
Table 2: Revenue from environmental taxes per unit corresponding to the tax and by tax. Italy, 2008, 2015, and 2022 Data source
Istat Note
The unit of measurement is expressed at current prices. |
Headline
Table 3: Revenue from environmental taxes by CEPA Class and allocation of revenue. Italy Data source
Istat Note
CEPA: Classification of Environmental Protection Activities and Expenditures; the unit of measurement in millions of euros is expressed at current prices. |
Headline
Table 1: Revenue from environmental taxes by tax category. Italy Data source
Istat Note
The 'total taxes and social contributions' includes imputed social contributions borne by employers |
Environmental tax revenue in Italy in 2024 amounts to €60.8 billion. Among the categories of environmental taxes, energy taxes accounted on average for over 80% of the total in the period 2008–2024; transport taxes, mostly related to vehicle ownership, accounted for about 19%; and pollution taxes for about 1%. In Italy, no tax measures are envisaged for the extraction of natural resources (Table 1, Figure 1).
In 2024, economic activities, households, and non-resident units contributed to environmental taxes by 45%, 53%, and 2%, respectively (Table 2). In the same year, energy taxes were paid for about 50% by economic activities and about 49% by households. Also in 2024, households were the main contributors to transport tax revenue (74% of total revenue for this category), followed by economic activities for the remaining share. Revenue from pollution taxes came almost 60% from households and 39% from economic activities.
If the destination of environmental tax revenue is analyzed according to the type of specific-purpose taxes—whose revenue is earmarked to finance environmental protection expenditure (the remaining part concerns environmental taxes whose revenue is not used to finance environmental protection expenditure)—it can be observed that earmarked taxes reached their lowest point in 2022 over the period considered, accounting for about 4% of total environmental tax revenue, before rising to 15.5% in 2024.