Daniela Romano, Marina Vitullo
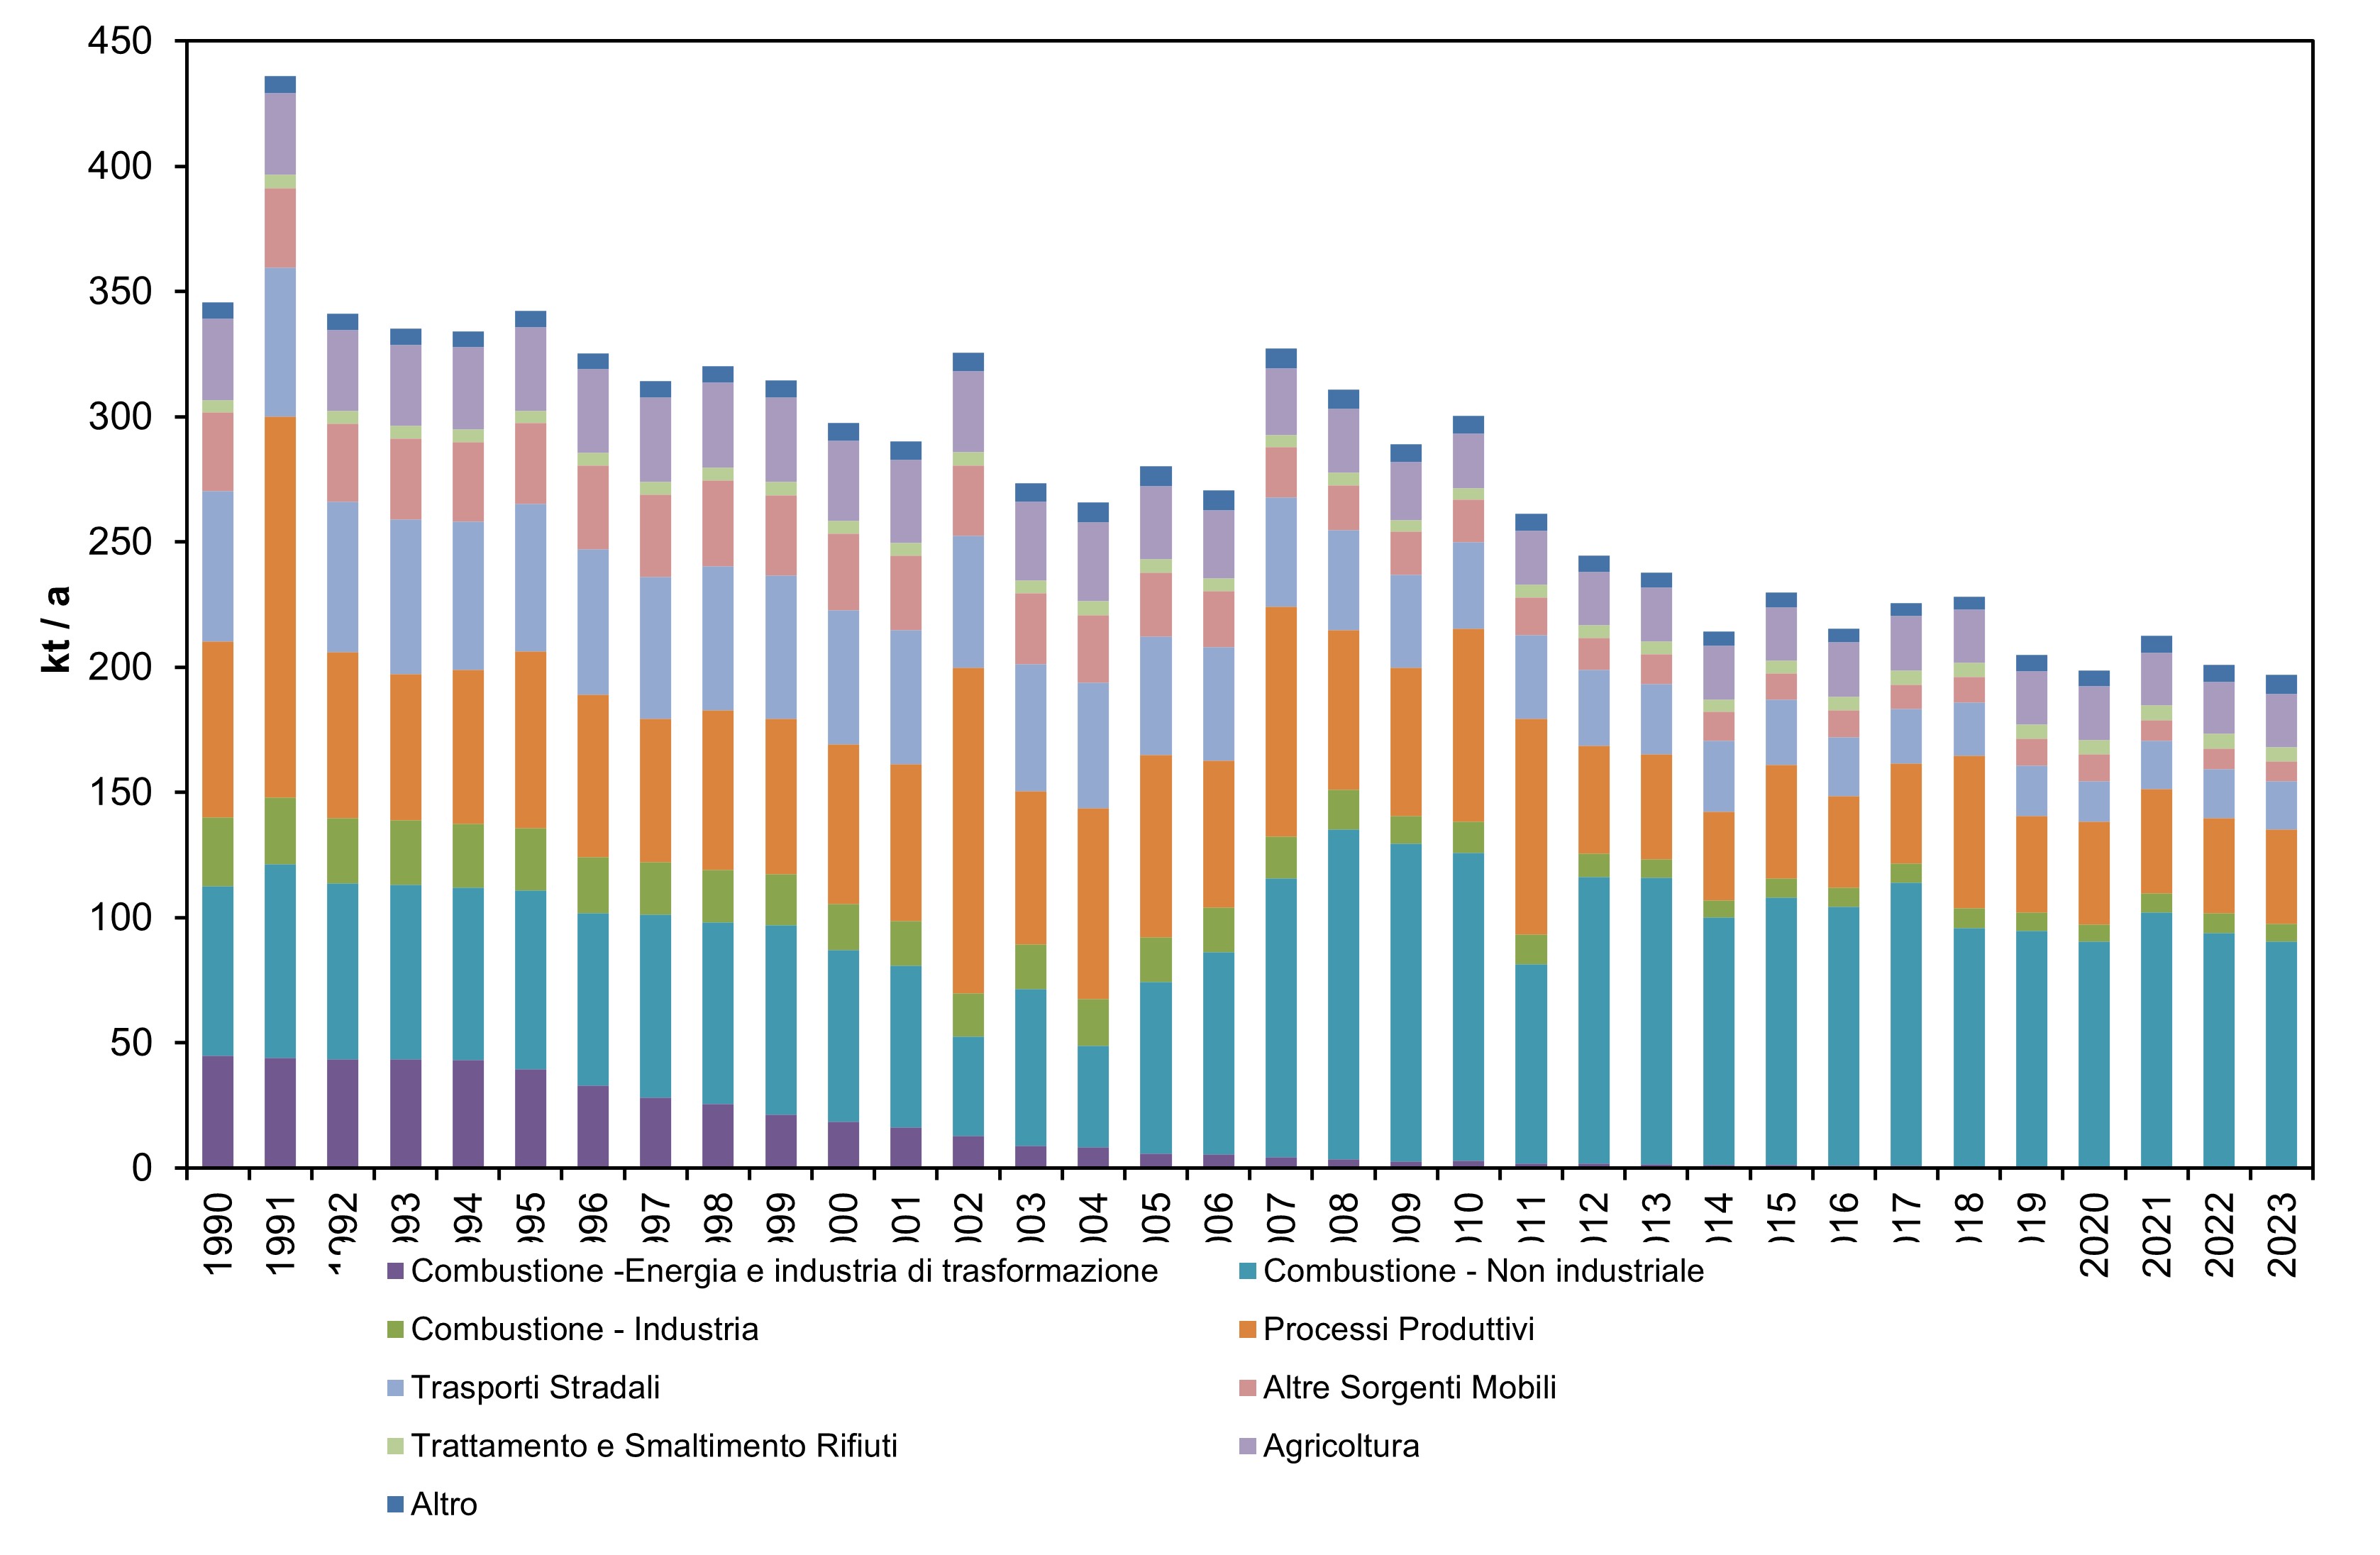
The indicator represents the trend in national emissions of particulate matter (PM10) by sector of origin from 1990 to 2023, highlighting a marked reduction over the years on a total level (-42.9%). The road transport sector, which contributes to total emissions with an emission share of 9.8% in 2023, presents a reduction of 67.8% over the entire period. Emissions from non-industrial combustion, in the same period, grew by approximately 33.7%, representing the most important sector in 2023 with 45.9% of total emissions.
Particulate matter with a diameter smaller than 10 µm originates from both natural and anthropogenic sources. Natural sources include soil erosion, sea spray, biogenic aerosol production (plant fragments, pollen, spores), volcanic emissions, and long-range transport of desert dust. A significant portion of atmospheric particulate matter has a secondary origin, resulting from reactions involving gaseous compounds such as nitrogen oxides, sulfur oxides, ammonia, and organic compounds. In addition, particulate matter contains substances such as polycyclic aromatic hydrocarbons (PAHs) and heavy metals. Fine particles, particularly in their smaller size fractions, have considerable health relevance due to their high capacity to penetrate the respiratory system. The estimates presented refer only to primary emissions and do not include secondary particulate formation or emissions resulting from the resuspension of dust deposited on the ground.
The purpose is to assess the temporal trend of PM10 emissions (particles with a diameter smaller than 10 µm) disaggregated by sector, which is relevant for monitoring the effectiveness of emission reduction regulations, with particular attention to urban areas.
Convention on Long-Range Transboundary Air Pollution (CLRTAP, 1979)
Presidential Decree (DPR) 203/88
Ministerial Decree (DM) of 12 July 1990
Legislative Decree No. 152/2006
Legislative Decree No. 128/2010
Legislative Decree No. 46/2014
Directive (EU) 2015/2193
Directive 2010/75/EU
Regulation (EC) 715/2007
Regulation (EC) 595/2009
As a Party to the UNECE Convention on Long-Range Transboundary Air Pollution (CLRTAP), Italy is required to annually update and report the national atmospheric emission inventory, which includes PM10 among other pollutants.
In the energy and industrial sectors, DPR 203/88 establishes authorization requirements for plants, while the Ministerial Decree of 12 July 1990 introduces emission limits for industrial installations.
The main national legislative reference for air protection and emission reduction is Legislative Decree 3 April 2006, No. 152 (“Environmental Regulations”, Part V). The Decree was subsequently updated by Legislative Decree No. 128/2010 and further amended following the entry into force of Legislative Decree No. 46 of 4 March 2014.
Several regulations impose limits on dust emissions in specific sectors, particularly road transport and industry. For stationary sources, Directive 2010/75/EU establishes particulate emission limit values for solid, liquid, and gaseous fuels used in large combustion plants. For medium combustion plants, Directive (EU) 2015/2193 sets rules for controlling emissions of dust into the air, in order to reduce potential risks to human health and the environment.
For mobile sources, the most recent provisions concerning particulate matter emissions derive from Regulation (EC) 715/2007 on type approval of motor vehicles with respect to emissions from passenger cars and light commercial vehicles (Euro 5 and Euro 6 standards) and Regulation (EC) 595/2009 on type approval of motor vehicles and engines with respect to emissions from heavy-duty vehicles (Euro VI standard).
ISPRA, 2022. The provincial-level disaggregation of the national emissions inventory. Available at http://www. isprambiente. gov. it/it/pubblicazioni/rapporti. Reports 369/2022.
ISPRA, 2025. Italian Emission Inventory 1990-2023. Informative Inventory Report 2025. (https://www. isprambiente. gov. it/it/pubblicazioni/rapporti; https://www. ceip. at/status-of-reporting-and-review-results/2025-submission).
ISPRA
Used ISPRA data from the National Inventory of Atmospheric Emissions (http://emissioni. sina. isprambiente. it/interno-nazionale/).
National, Regional
1990-2023
The estimate is calculated as part of the development of the national atmospheric emission inventory. For air pollutants, the methodology applied is that indicated by the European Environment Agency (EMEP/EEA Air Pollutant Emission Inventory Guidebook 2019).
For a detailed description of the estimation methodology, reference is made to the Informative Inventory Report – IIR (https://www.isprambiente.gov.it/it/pubblicazioni/rapporti/; https://www.ceip.at/status-of-reporting-and-review-results/2025-submission).
In 2023, PM10 emission levels amounted to approximately 198 kt, showing a reduction of about 2% compared to 2022.
This decrease is mainly attributable to emissions from non-industrial combustion, which account for 46% of total PM10 emissions and decreased by 3% over the same period, also due to favourable climatic conditions.
A “positive” evaluation is therefore assigned (Table 1).
National PM10 emissions decreased by 42.9% over the period 1990–2023, showing a positive trend from an environmental standpoint (Table 1).
| Allegati |
|---|
Titolo
Table 1: National PM10 emissions by source sector Fonte
ISPRA Legenda
A: Combustion in energy production and transformation industries Note
Emission values have been updated in line with the annual update of the national emission inventory. |
Thumbnail
Titolo
Figure 1: National PM10 emissions by source sector Fonte
ISPRA Note
Emission values have been updated in line with the annual update of the national emission inventory. |
Titolo
Table 2: Regional emissions of particulate matter (PM10) Fonte
ISPRA Legenda
a) Emissions from offshore point sources, such as vessel cruising phases or activities related to the extraction of liquid or gaseous fuels. Note
Regional data for the years 1990, 1995, 2000, 2005, 2010, 2015, 2019 and 2023 were disaggregated using a top-down methodology based on the data reported in the national inventory submitted in 2025, through ad hoc proxy variables specific to each inventory activity. Emissions from international aviation and from LULUCF (Land Use, Land Use Change and Forestry), in particular those from fires, are excluded. These selections explain the differences between the sum of regional data and national totals for the various pollutants. |
Thumbnail
Titolo
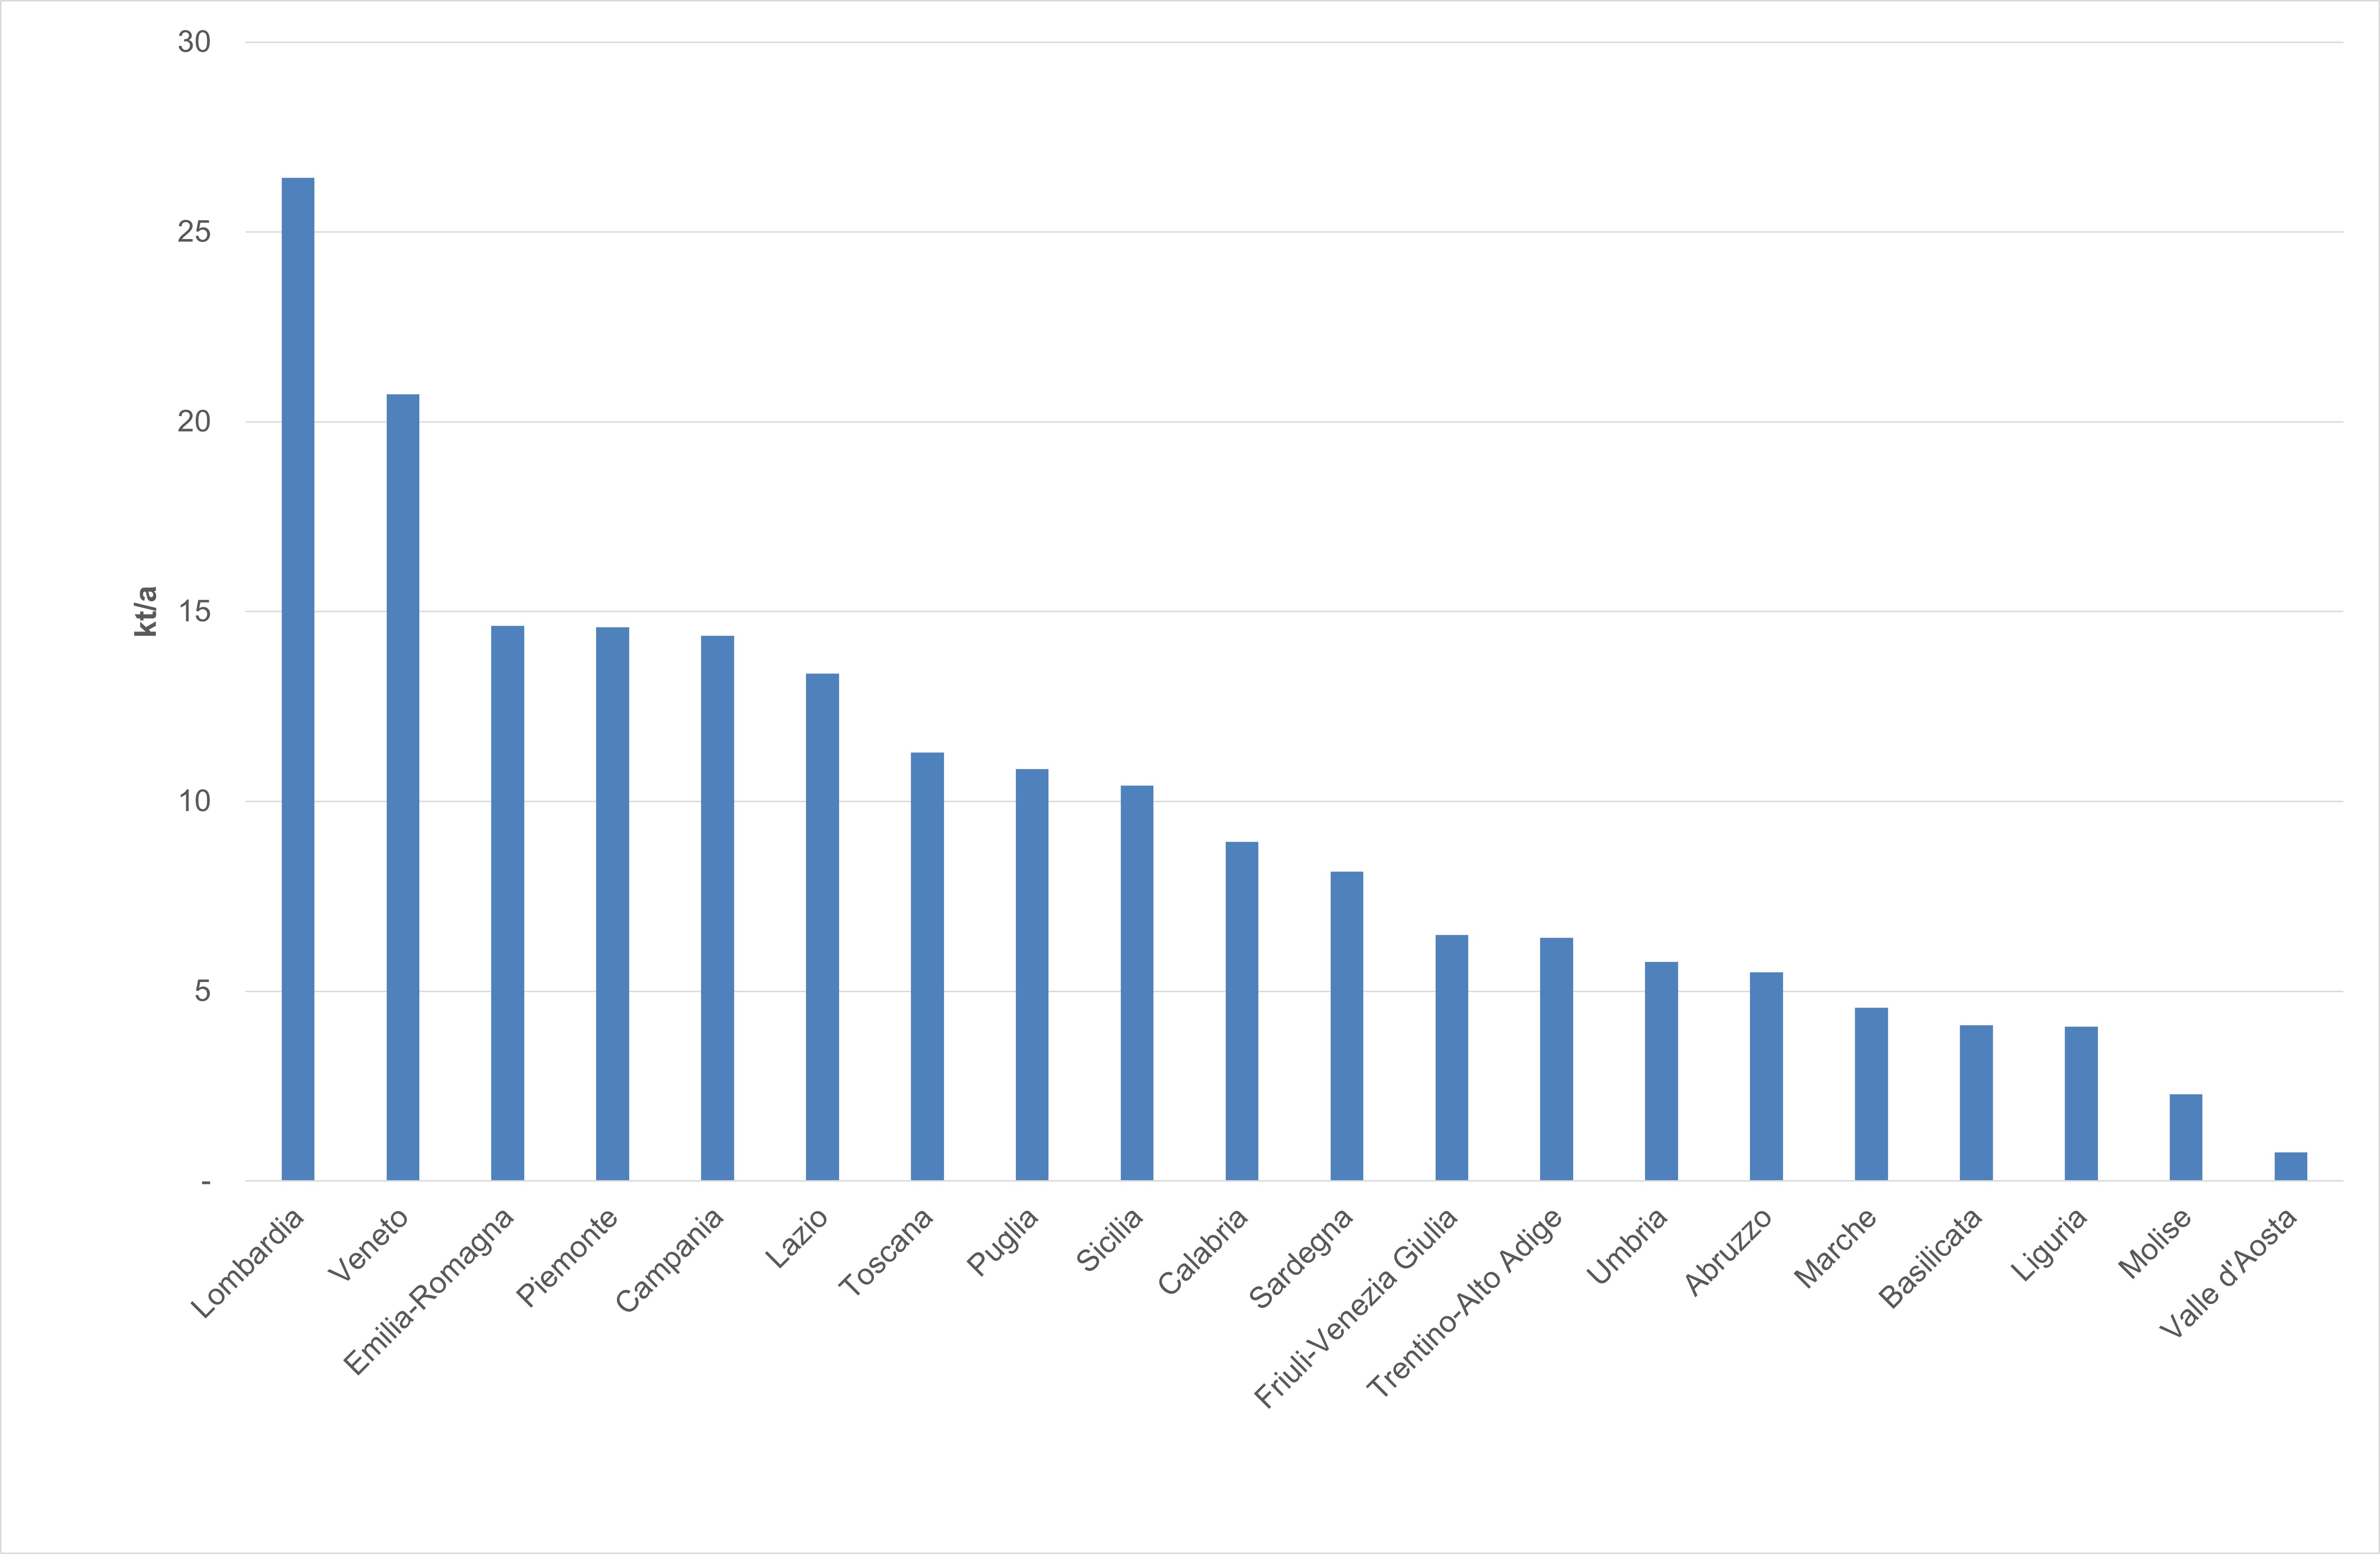
Figure 2: Regional emissions of particulate matter (PM10) (2023) Fonte
ISPRA Note
Regional data for 2023 were disaggregated using a top-down methodology based on the data reported in the national inventory submitted in 2025, through ad hoc proxy variables specific to each inventory activity. |
National emissions are calculated in accordance with the estimation methodology adopted at the European level and described in the EMEP/EEA Air Pollutant Emission Inventory Guidebook – 2019.
Natural sources (other emission sources and sinks) are excluded from the total, consistent with the classification used in the estimation of the national emission inventory. Between 1990 and 2023, the road transport sector recorded a 67.8% decrease and contributed about 10% to total emissions in 2023. Emissions from non-industrial combustion increased by 33.7%, representing in 2023 the most significant sector with a 45.9% share of total emissions. Other combustion processes recorded significant decreases in particulate emissions.
In particular, emissions from combustion for energy production and transformation industries decreased by 98.9%, accounting for only 0.2% of total emissions in 2023, compared to an average share of over 12% until 1995.
Emissions from combustion processes in manufacturing industries decreased by 74.7%, reaching a share of 3.5% of the total in 2023. Reductions observed in the energy and industrial sectors are mainly due to the introduction of two regulatory instruments: - Presidential Decree 203/88, establishing authorization rules for plants, and -Ministerial Decree of 12 July 1990, introducing emission limits for industrial facilities. In 2023, emissions from agricultural activities, production processes, and other mobile sources accounted respectively for 10.7%, 19.1%, and 3.9% of the total, with reductions since 1990 of -34.7%, -46.2%, and -75.7%. Emissions related to waste treatment and disposal increased by 19.1% compared to 1990, reaching a share of 2.9% of total emissions in 2023 (Table 1, Figure 1).
An analysis of the data at a regional level shows that the regions that contribute most to PM10 emissions are Lombardy (26.4 kt/a) and Veneto (20.7 kt/a), while those with a lower impact are Molise (3.3 kt/a) and Valle d'Aosta (0.8 kt/a) (Table 2 and Figure 2).