Daniela Romano, Marina Vitullo
This indicator represents the national trend of emissions of tropospheric ozone precursors: nitrogen oxides (NOx) and non-methane volatile organic compounds (NMVOCs), disaggregated by source sector. A marked decrease is observed between 1990 and 2023 (-74% for NOx and -57% for NMVOCs), mainly driven by the strong reduction of emissions from the transport sector.
Emissions are estimated according to the methodology indicated by the European Environment Agency (EMEP/EEA Air Pollutant Emission Inventory Guidebook 2019).
Tropospheric ozone is an important issue both in urban areas, where acute pollution episodes occur, and in rural areas, where it impacts crops.
Emissions of nitrogen oxides (NOx) and non-methane volatile organic compounds (NMVOCs), which are precursors of tropospheric ozone, also have transboundary relevance due to long-range transport phenomena.
Ozone formation occurs through photochemical reactions under typical summer meteorological conditions. Ozone has a high oxidizing potential and causes harmful effects on human health, ecosystems, and cultural heritage.
The main sources of these pollutants are transport and other combustion processes, as well as the use of solvents in the case of NMVOCs.
The purpose is to assess the pressures from tropospheric ozone precursors and their trends over time in relation to national and international emission reduction targets (Legislative Decree 171/2004, Gothenburg Protocol, and NEC Directive).
The Gothenburg Protocol of 1999 to the 1979 Convention on Long-Range Transboundary Air Pollution, amended in 2012, aims to reduce acidification, eutrophication, and tropospheric ozone (the European Community adheres to the Protocol via Council Decision 2003/507/EC).
Directive (EU) 2015/2193 (transposed by Legislative Decree 183/2017) applies to medium combustion plants and sets rules for controlling emissions of sulfur dioxide (SO2), nitrogen oxides (NOx), and particulate matter, in order to reduce air emissions and potential risks to human health and the environment.
The new NEC Directive 2016/2284 of the European Parliament and Council (transposed by Legislative Decree 81/2018) concerning the reduction of national emissions of certain air pollutants defines national emission reduction commitments relative to 2005, applicable from 2020 to 2029 and from 2030 onwards: - for NOx, reduction commitments of 40% (2020–2029) and 65% (from 2030); - for NMVOCs, reduction commitments of 35% (2020–2029) and 46% (from 2030).
ISPRA, 2024. Italian Emission Inventory 1990-2023. Informative Inventory Report 2025 (https://www. isprambiente. gov. it/it/pubblicazioni/rapporti/)
ISPRA
Used ISPRA data from the National Inventory of Atmospheric Emissions (https://emissioni. sina. isprambiente. it/interno-nazionale/).
National, Regional
1990 - 2023
The estimate has been produced as part of the development of the national atmospheric emission inventory. Data can be aggregated using the Tropospheric Ozone-Forming Potential (TOFP). These conversion factors are those used by the European Environment Agency (EEA) in environmental reports and are particularly useful for aggregated validation at the European level.
For air pollutants, the methodology applied is that indicated by the European Environment Agency (EMEP/EEA Guidebook – 2019). For a detailed description of the estimation methodology, reference is made to the Informative Inventory Report – IIR (https://www.isprambiente.gov.it/it/pubblicazioni/rapporti; https://www.ceip.at/status-of-reporting-and-review-results/2025-submission/).
In 2023, nitrogen oxide (NOx) emissions amounted to 557 kt, while NMVOC emissions reached 871 kt. NOx had already achieved the reduction target established by Directive 2016/2284 for 2020 (-40%) by 2014; in 2023, relative to 2005, this reduction was -57%. NMVOCs also met the target (-35%) already by 2020, and the reduction relative to 2005 is confirmed at 37% in 2023 (Table 1).
Between 1990 and 2023, emissions of tropospheric ozone precursors showed a marked reduction (-74% for NOx and -54% for NMVOCs), mainly driven by a strong decrease in emissions from the transport sectors (road transport and other mobile sources) and solvent use (particularly for NMVOCs) (Tables 1, 2, and Figure 3).
| Data |
|---|
Headline
Table 1: National emissions of ozone precursors by sector Data source
ISPRA Data legend
A: Combustion – Energy production and transformation industries Note
Emission values have been updated in line with the annual update of the national emission inventory. |
Headline
Table 2: National emissions of ozone precursors in tropospheric ozone formation potential Data source
ISPRA Data legend
TOFP conversion factor: NOx = 1.22; NMVOCs = 1 Note
Emission values have been updated in line with the annual update of the national emission inventory. |
Thumbnail
Headline
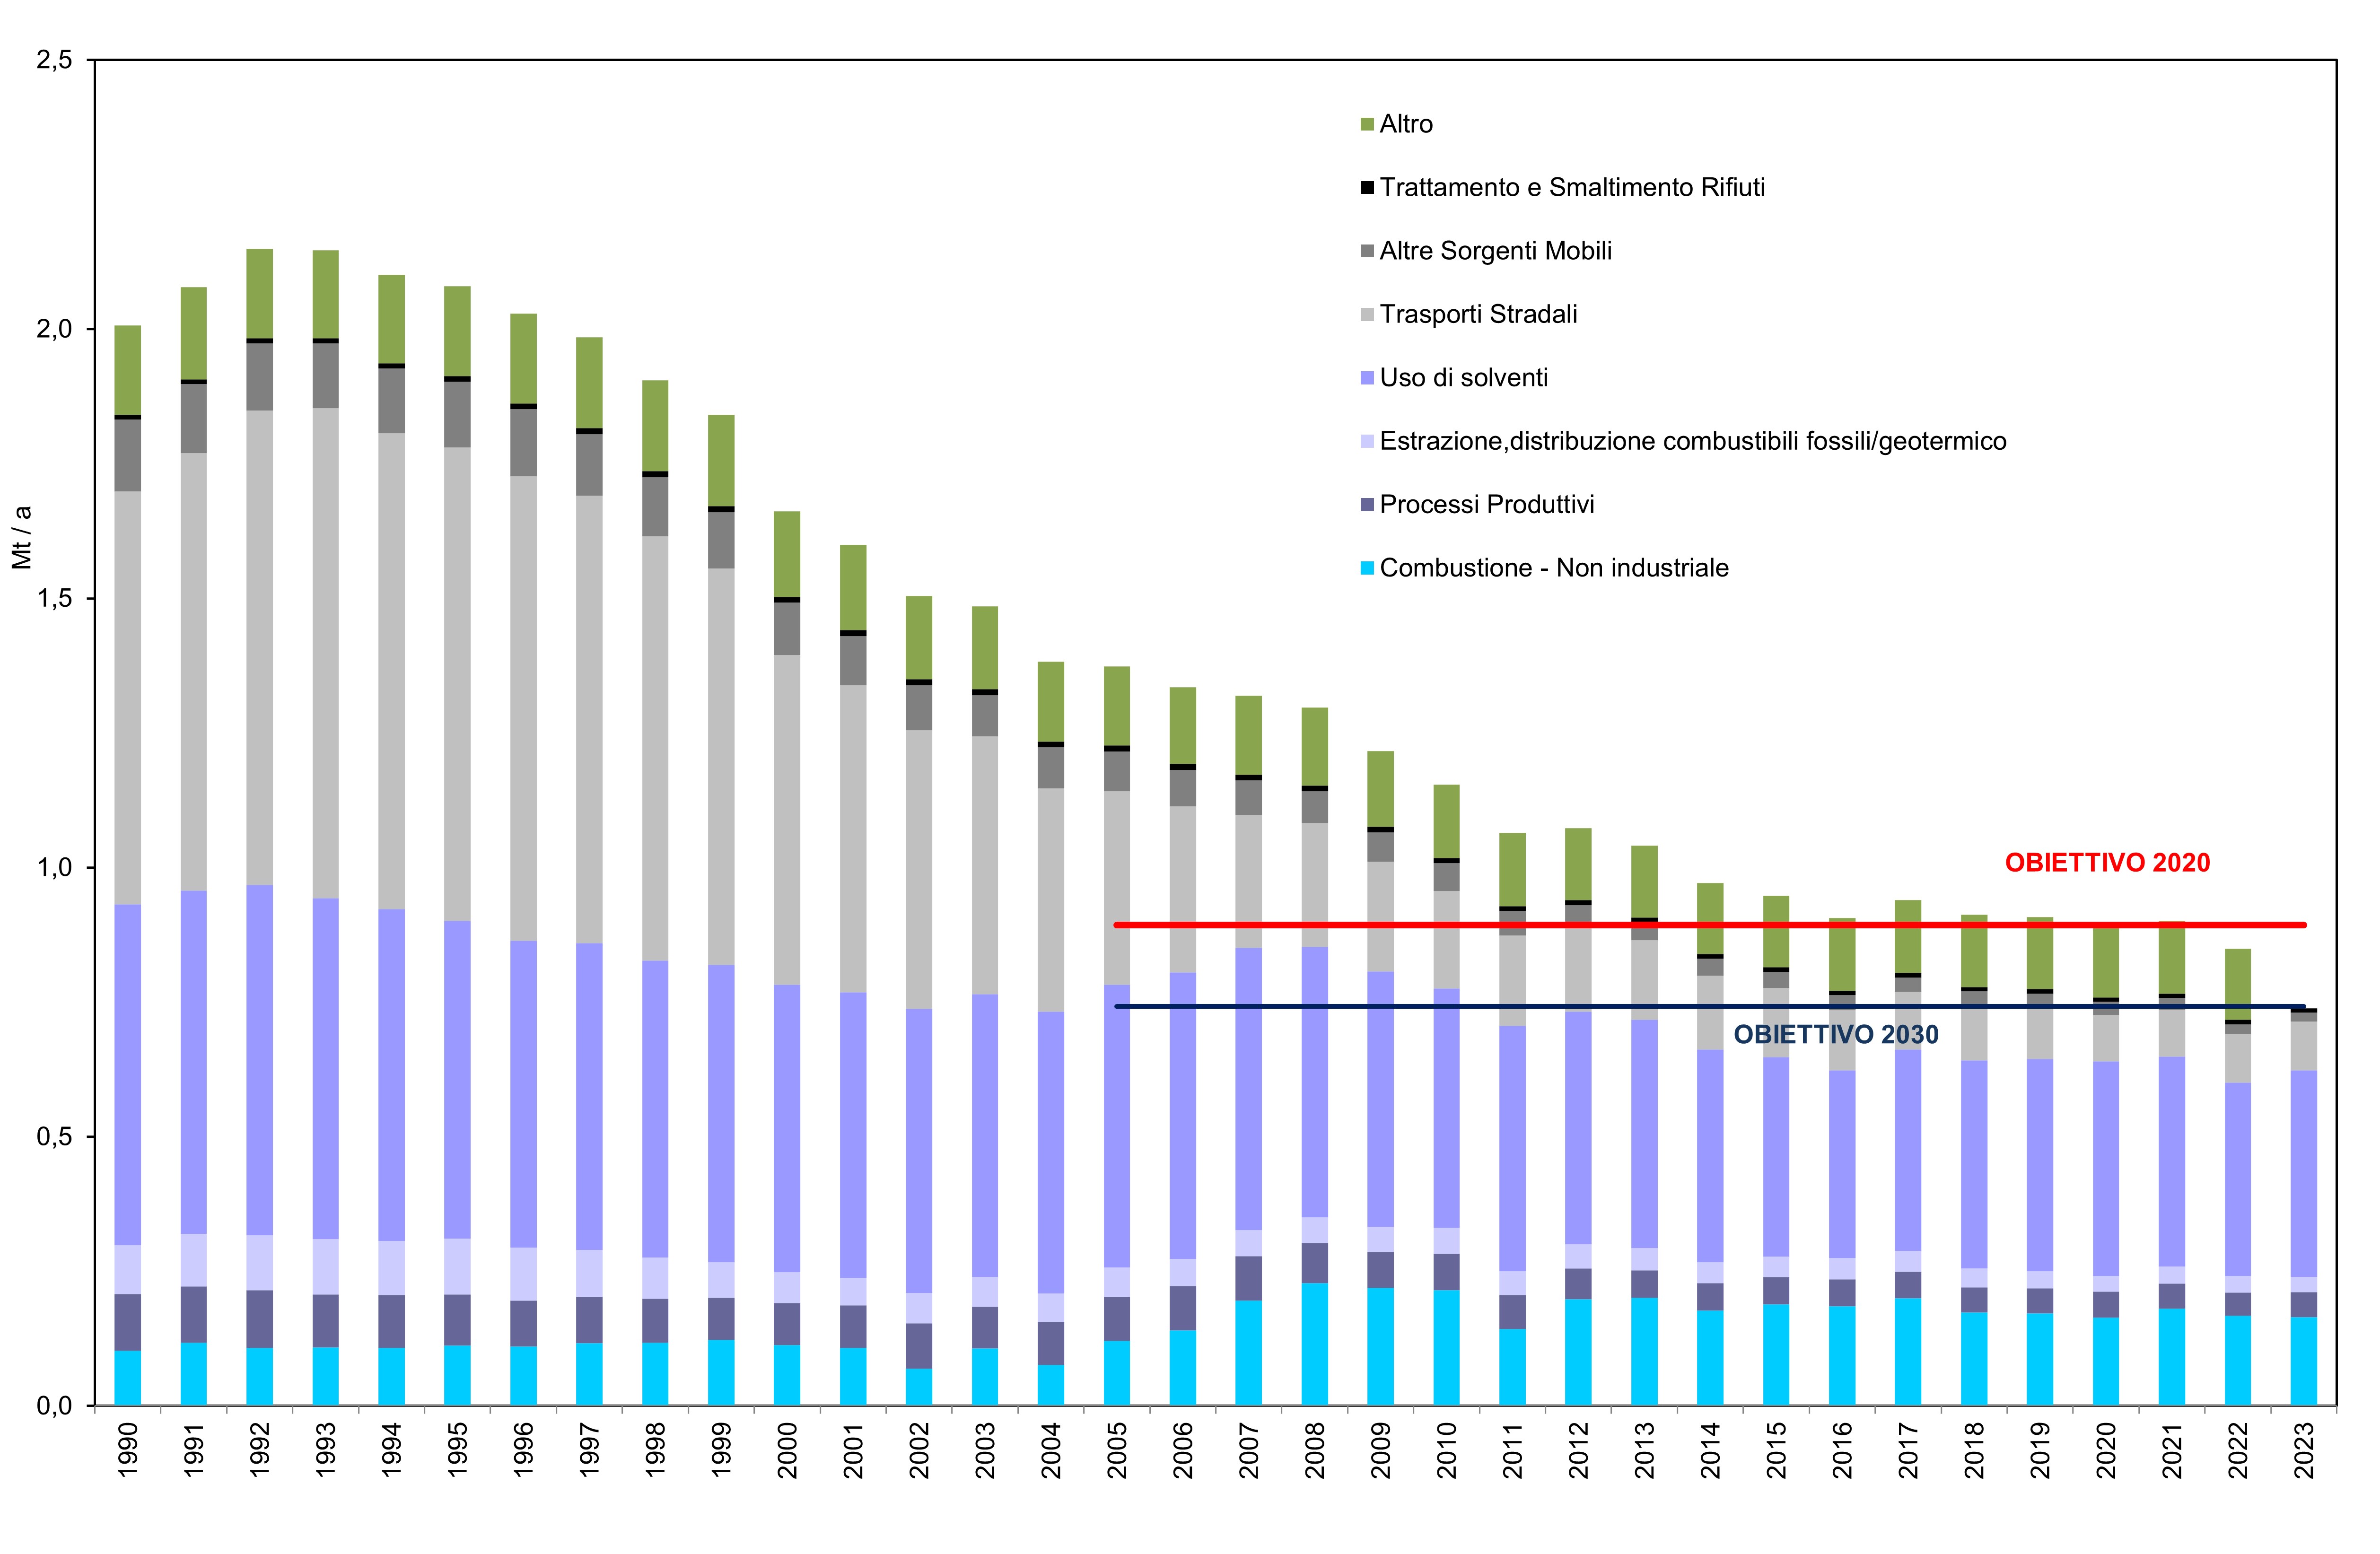
Figure 1: National NMVOC emissions by sector Data source
ISPRA Note
Emission values have been updated in line with the annual update of the national emission inventory. |
Thumbnail
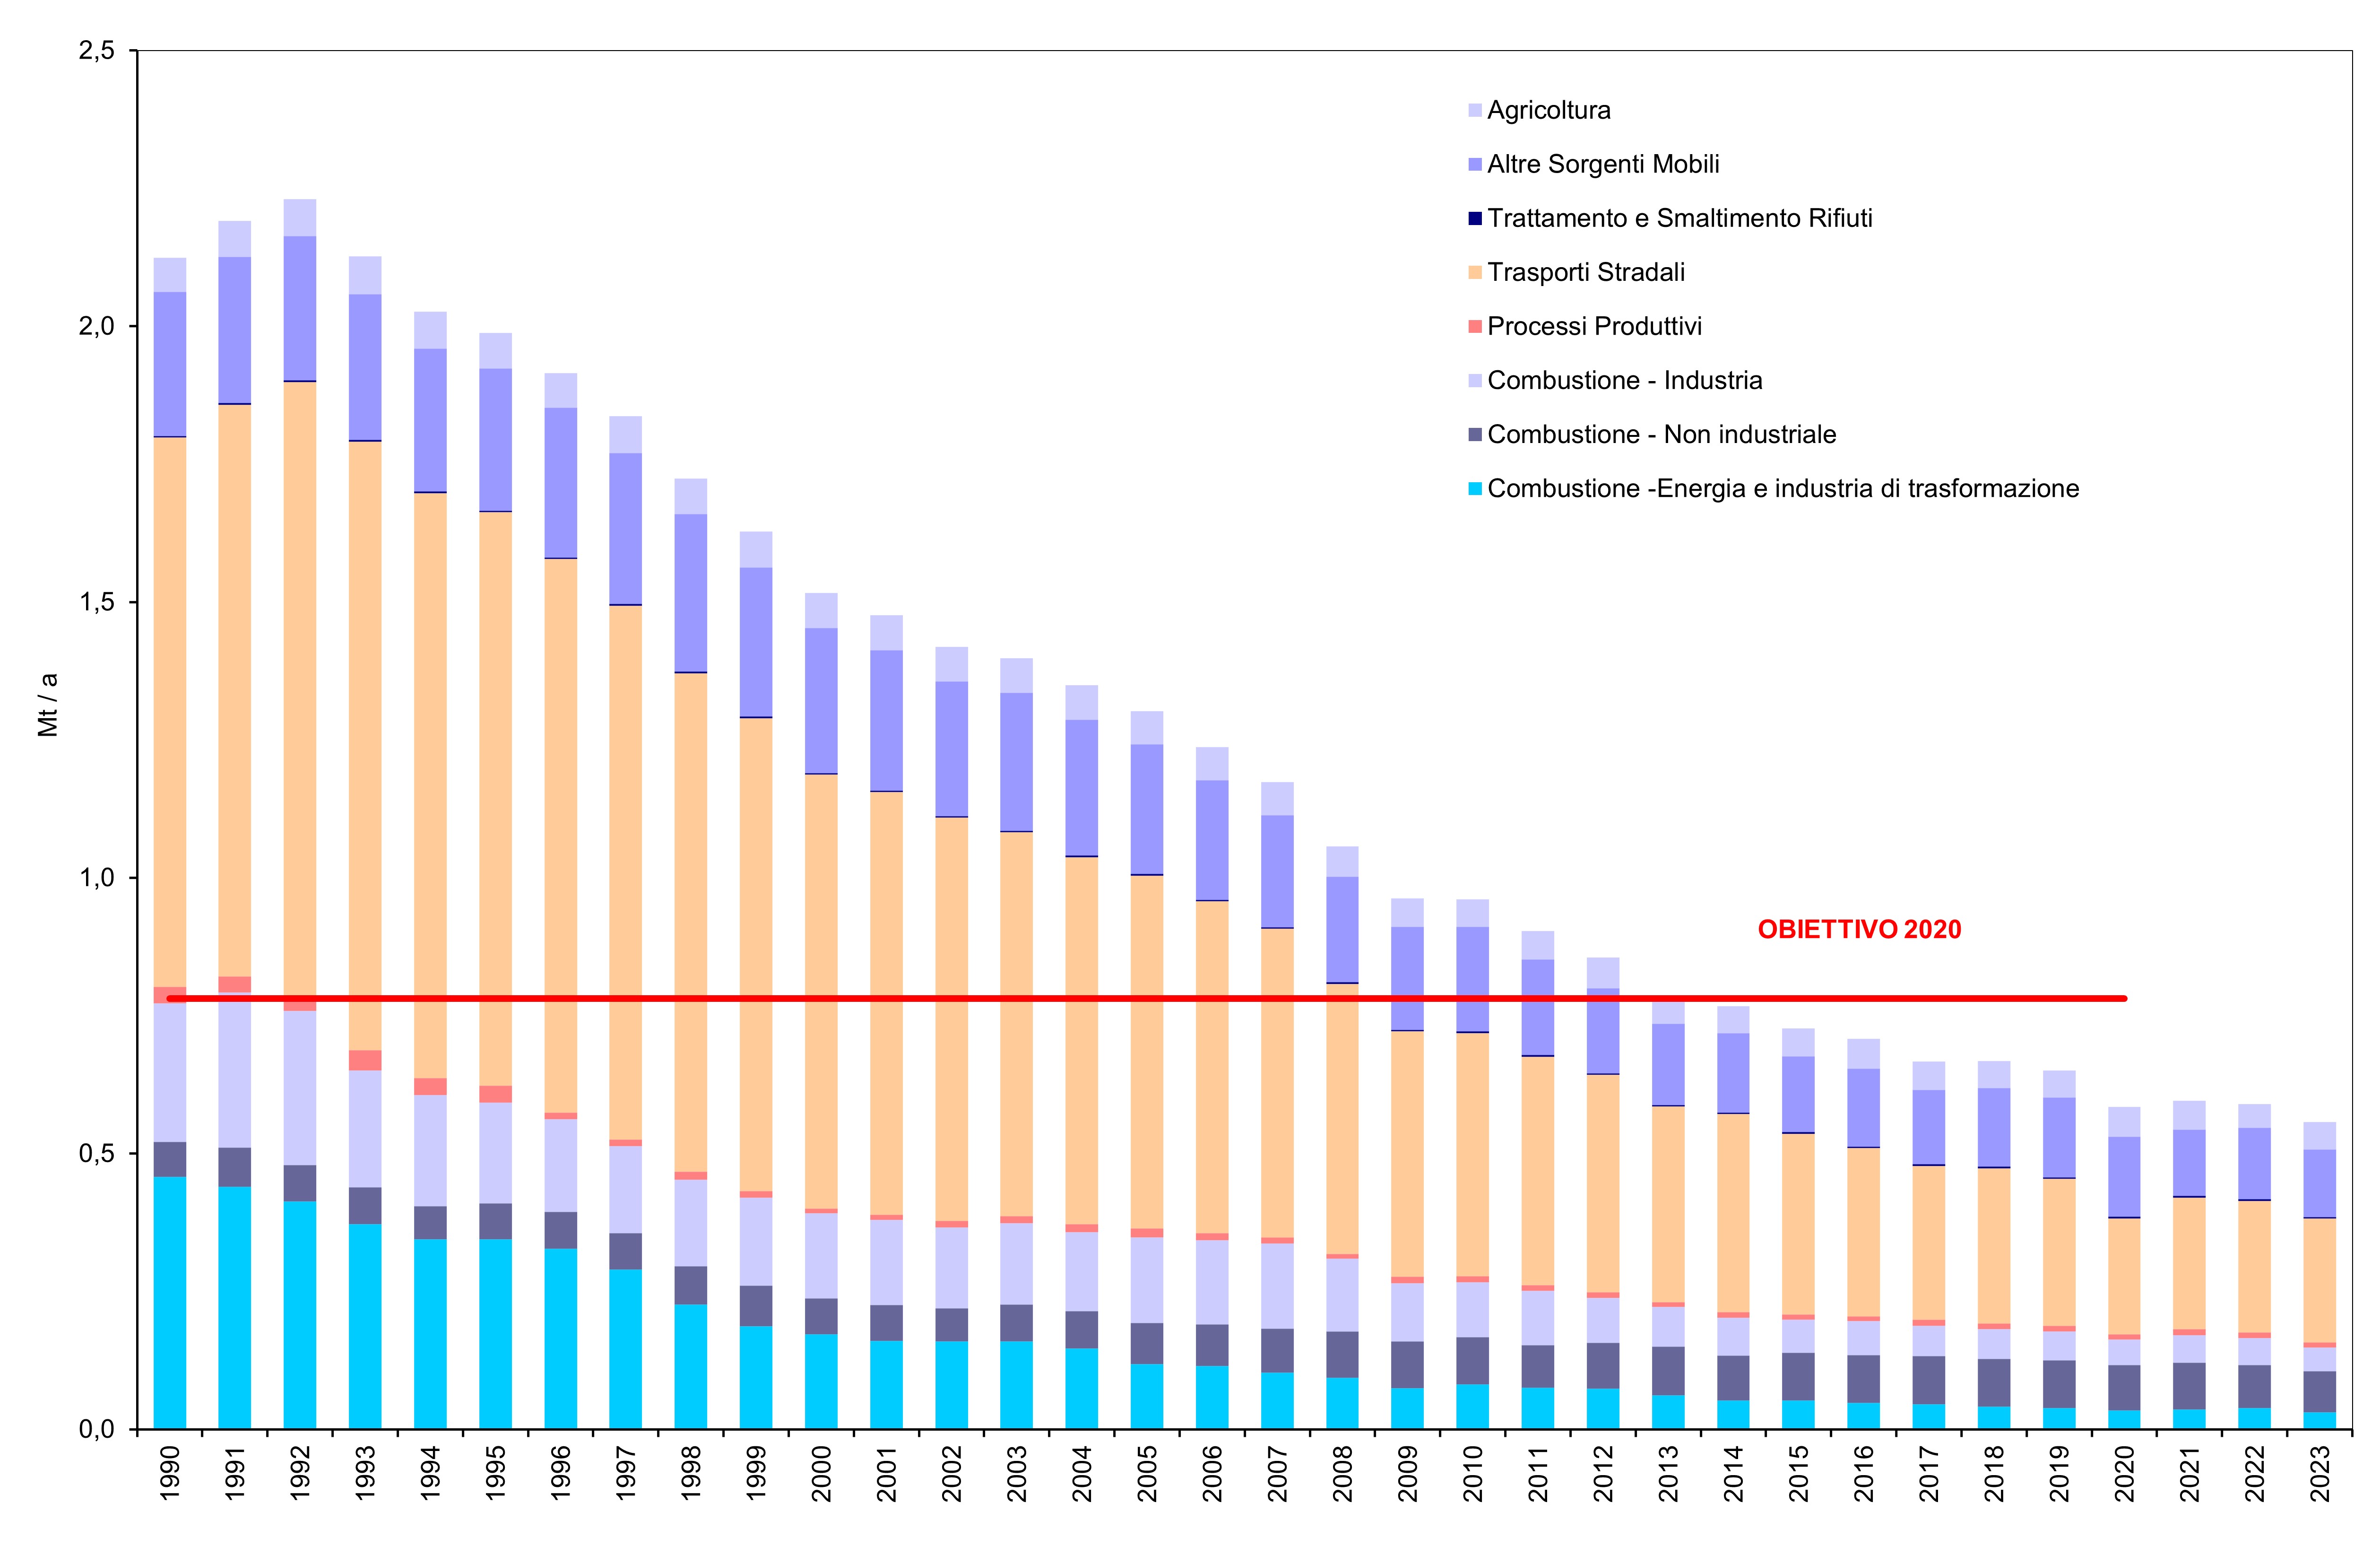
Headline
Figure 2: National NOx emissions by sector Data source
ISPRA Note
Emission values have been updated in line with the annual update of the national emission inventory. |
Thumbnail
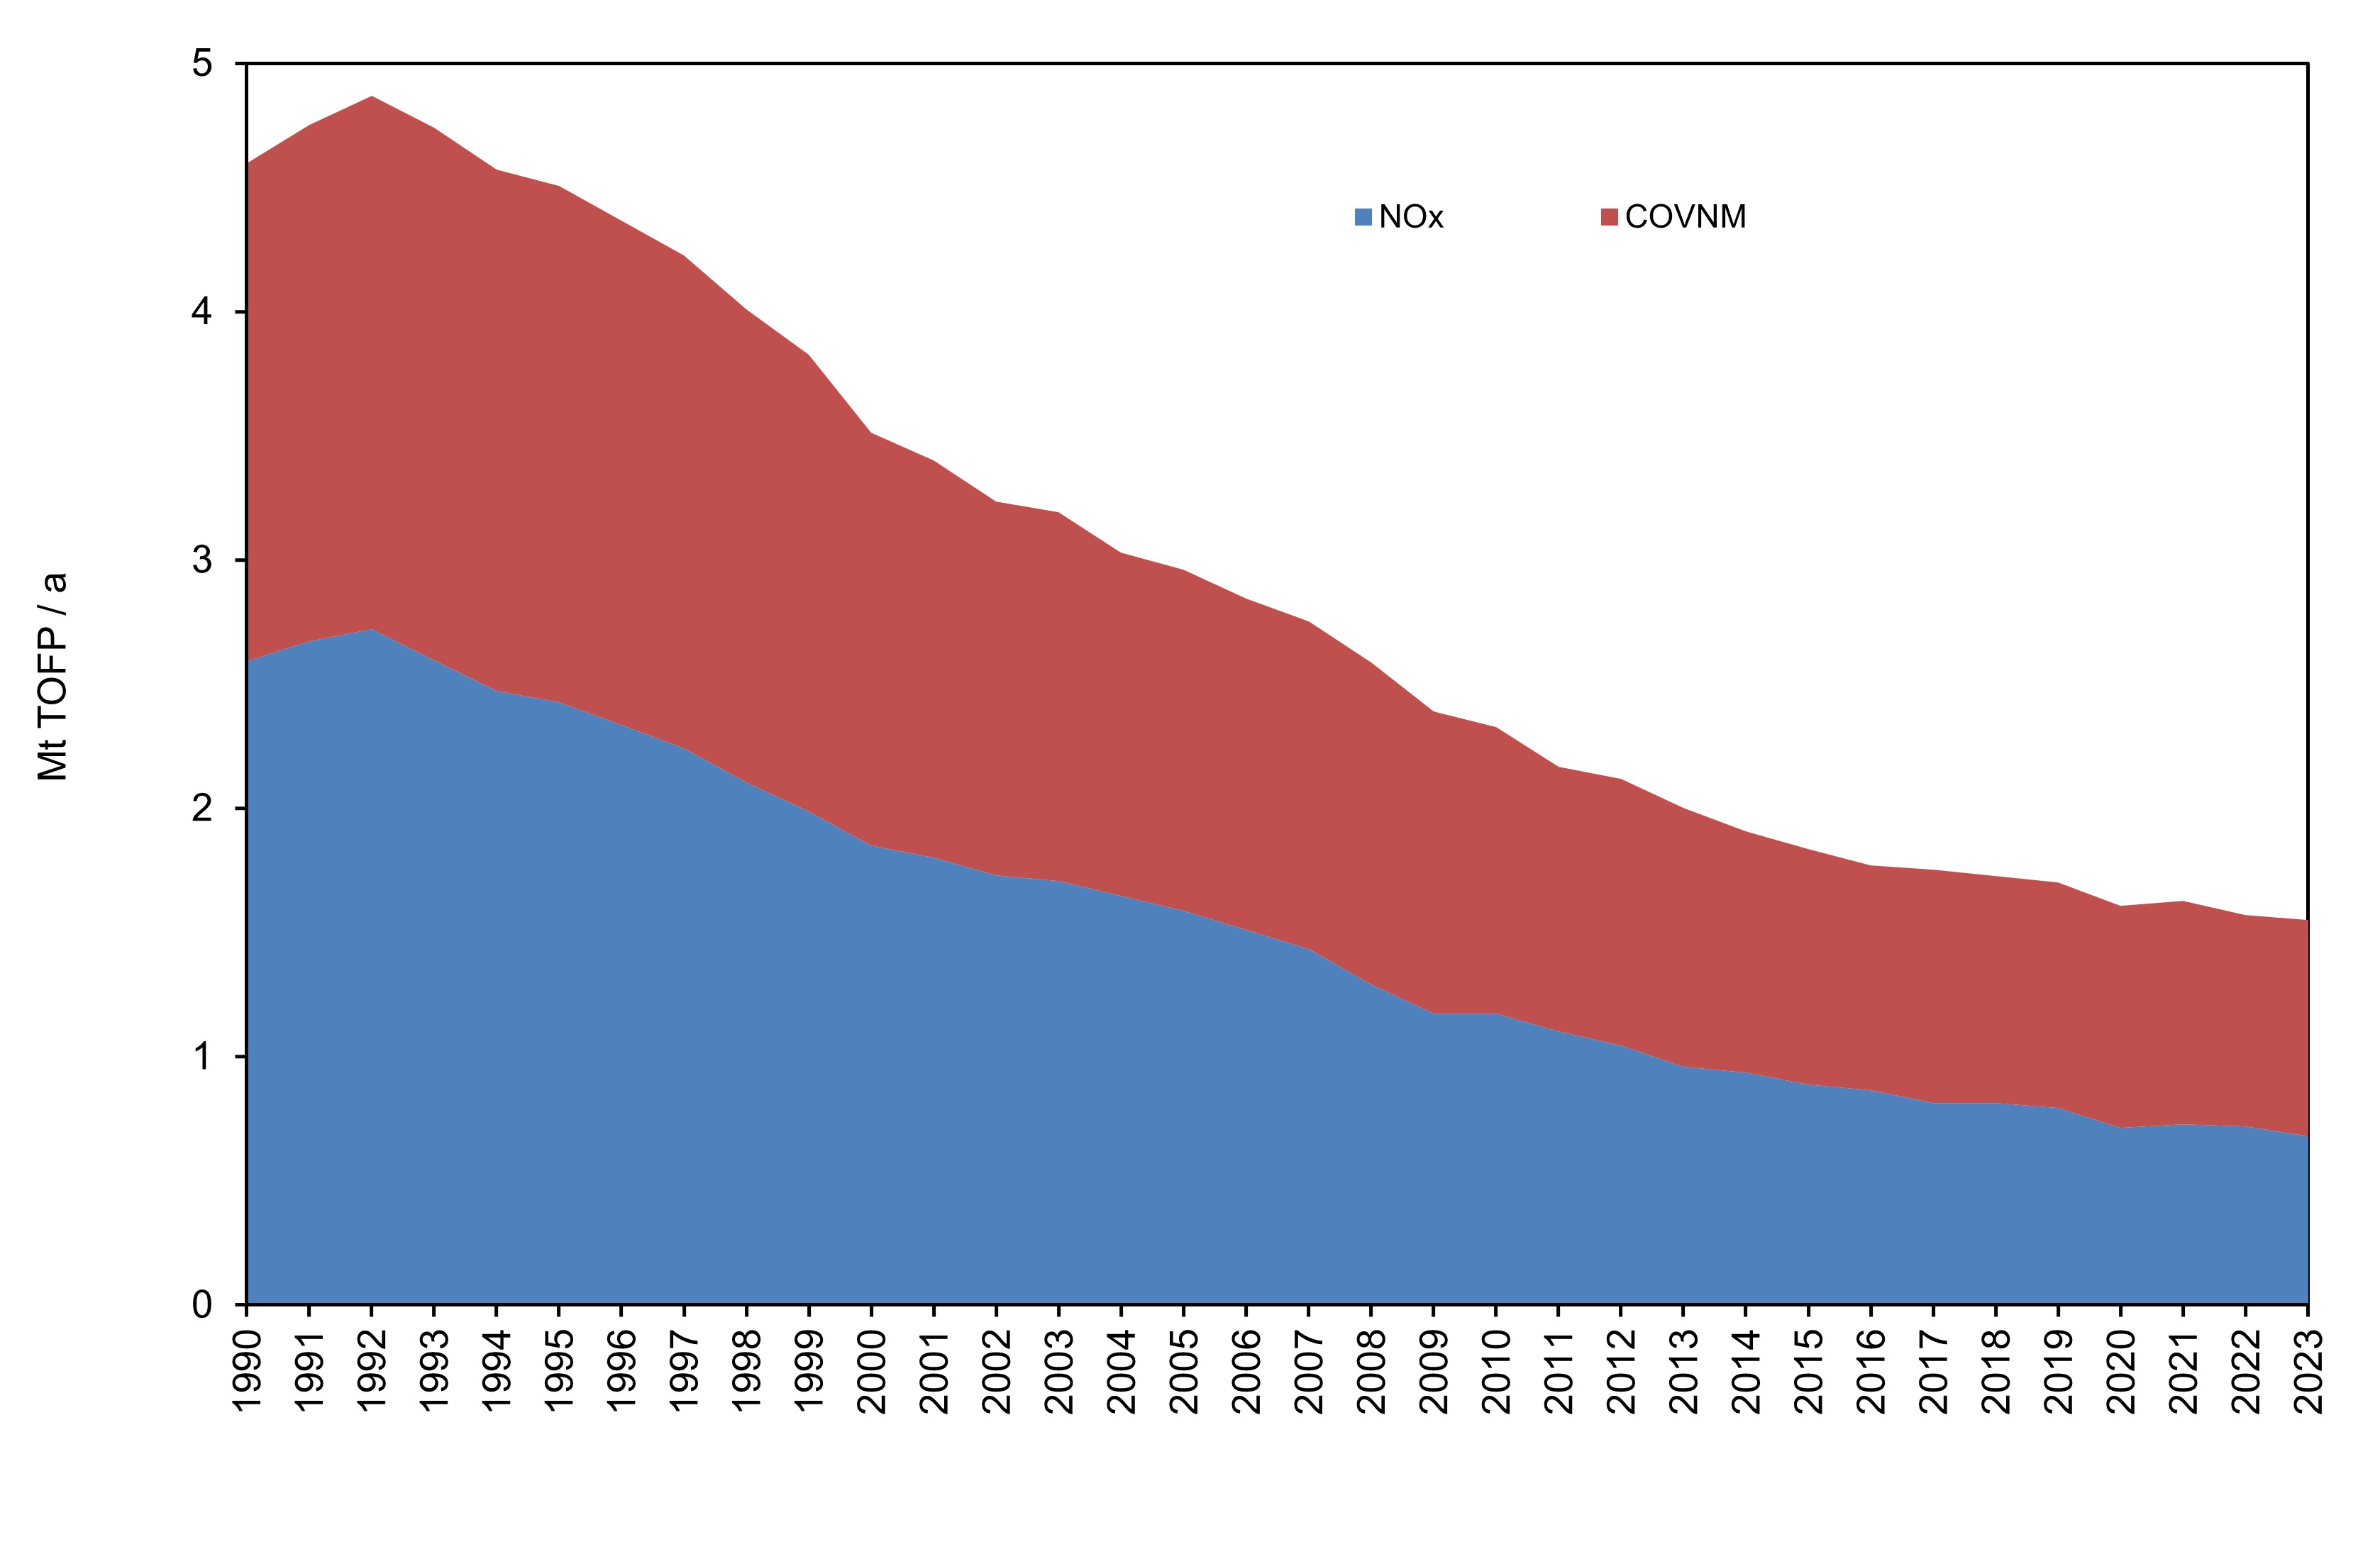
Headline
Figure 3: National emissions of ozone precursors in tropospheric ozone formation potential Data source
ISPRA Data legend
TOFP conversion factor: NOx = 1.22; NMVOCs = 1 Note
Emission values have been updated in line with the annual update of the national emission inventory. |
Headline
Table 3: Regional emissions of ozone precursors (NOₓ, NMVOCs) Data source
ISPRA Data legend
a) Emissions from offshore point sources, such as vessel cruising phases or activities related to the extraction of liquid or gaseous fuels. Note
Regional data for the years 1990, 1995, 2000, 2005, 2010, 2015, 2019, and 2023 were disaggregated using a top-down methodology based on the data reported in the national inventory submitted in 2025, through ad hoc proxy variables specific to each inventory activity. Emissions from international aviation and from LULUCF (Land Use, Land Use Change and Forestry), in particular those from fires, are excluded. These selections explain the differences between the sum of regional data and national totals for the various pollutants. |
Thumbnail
Headline
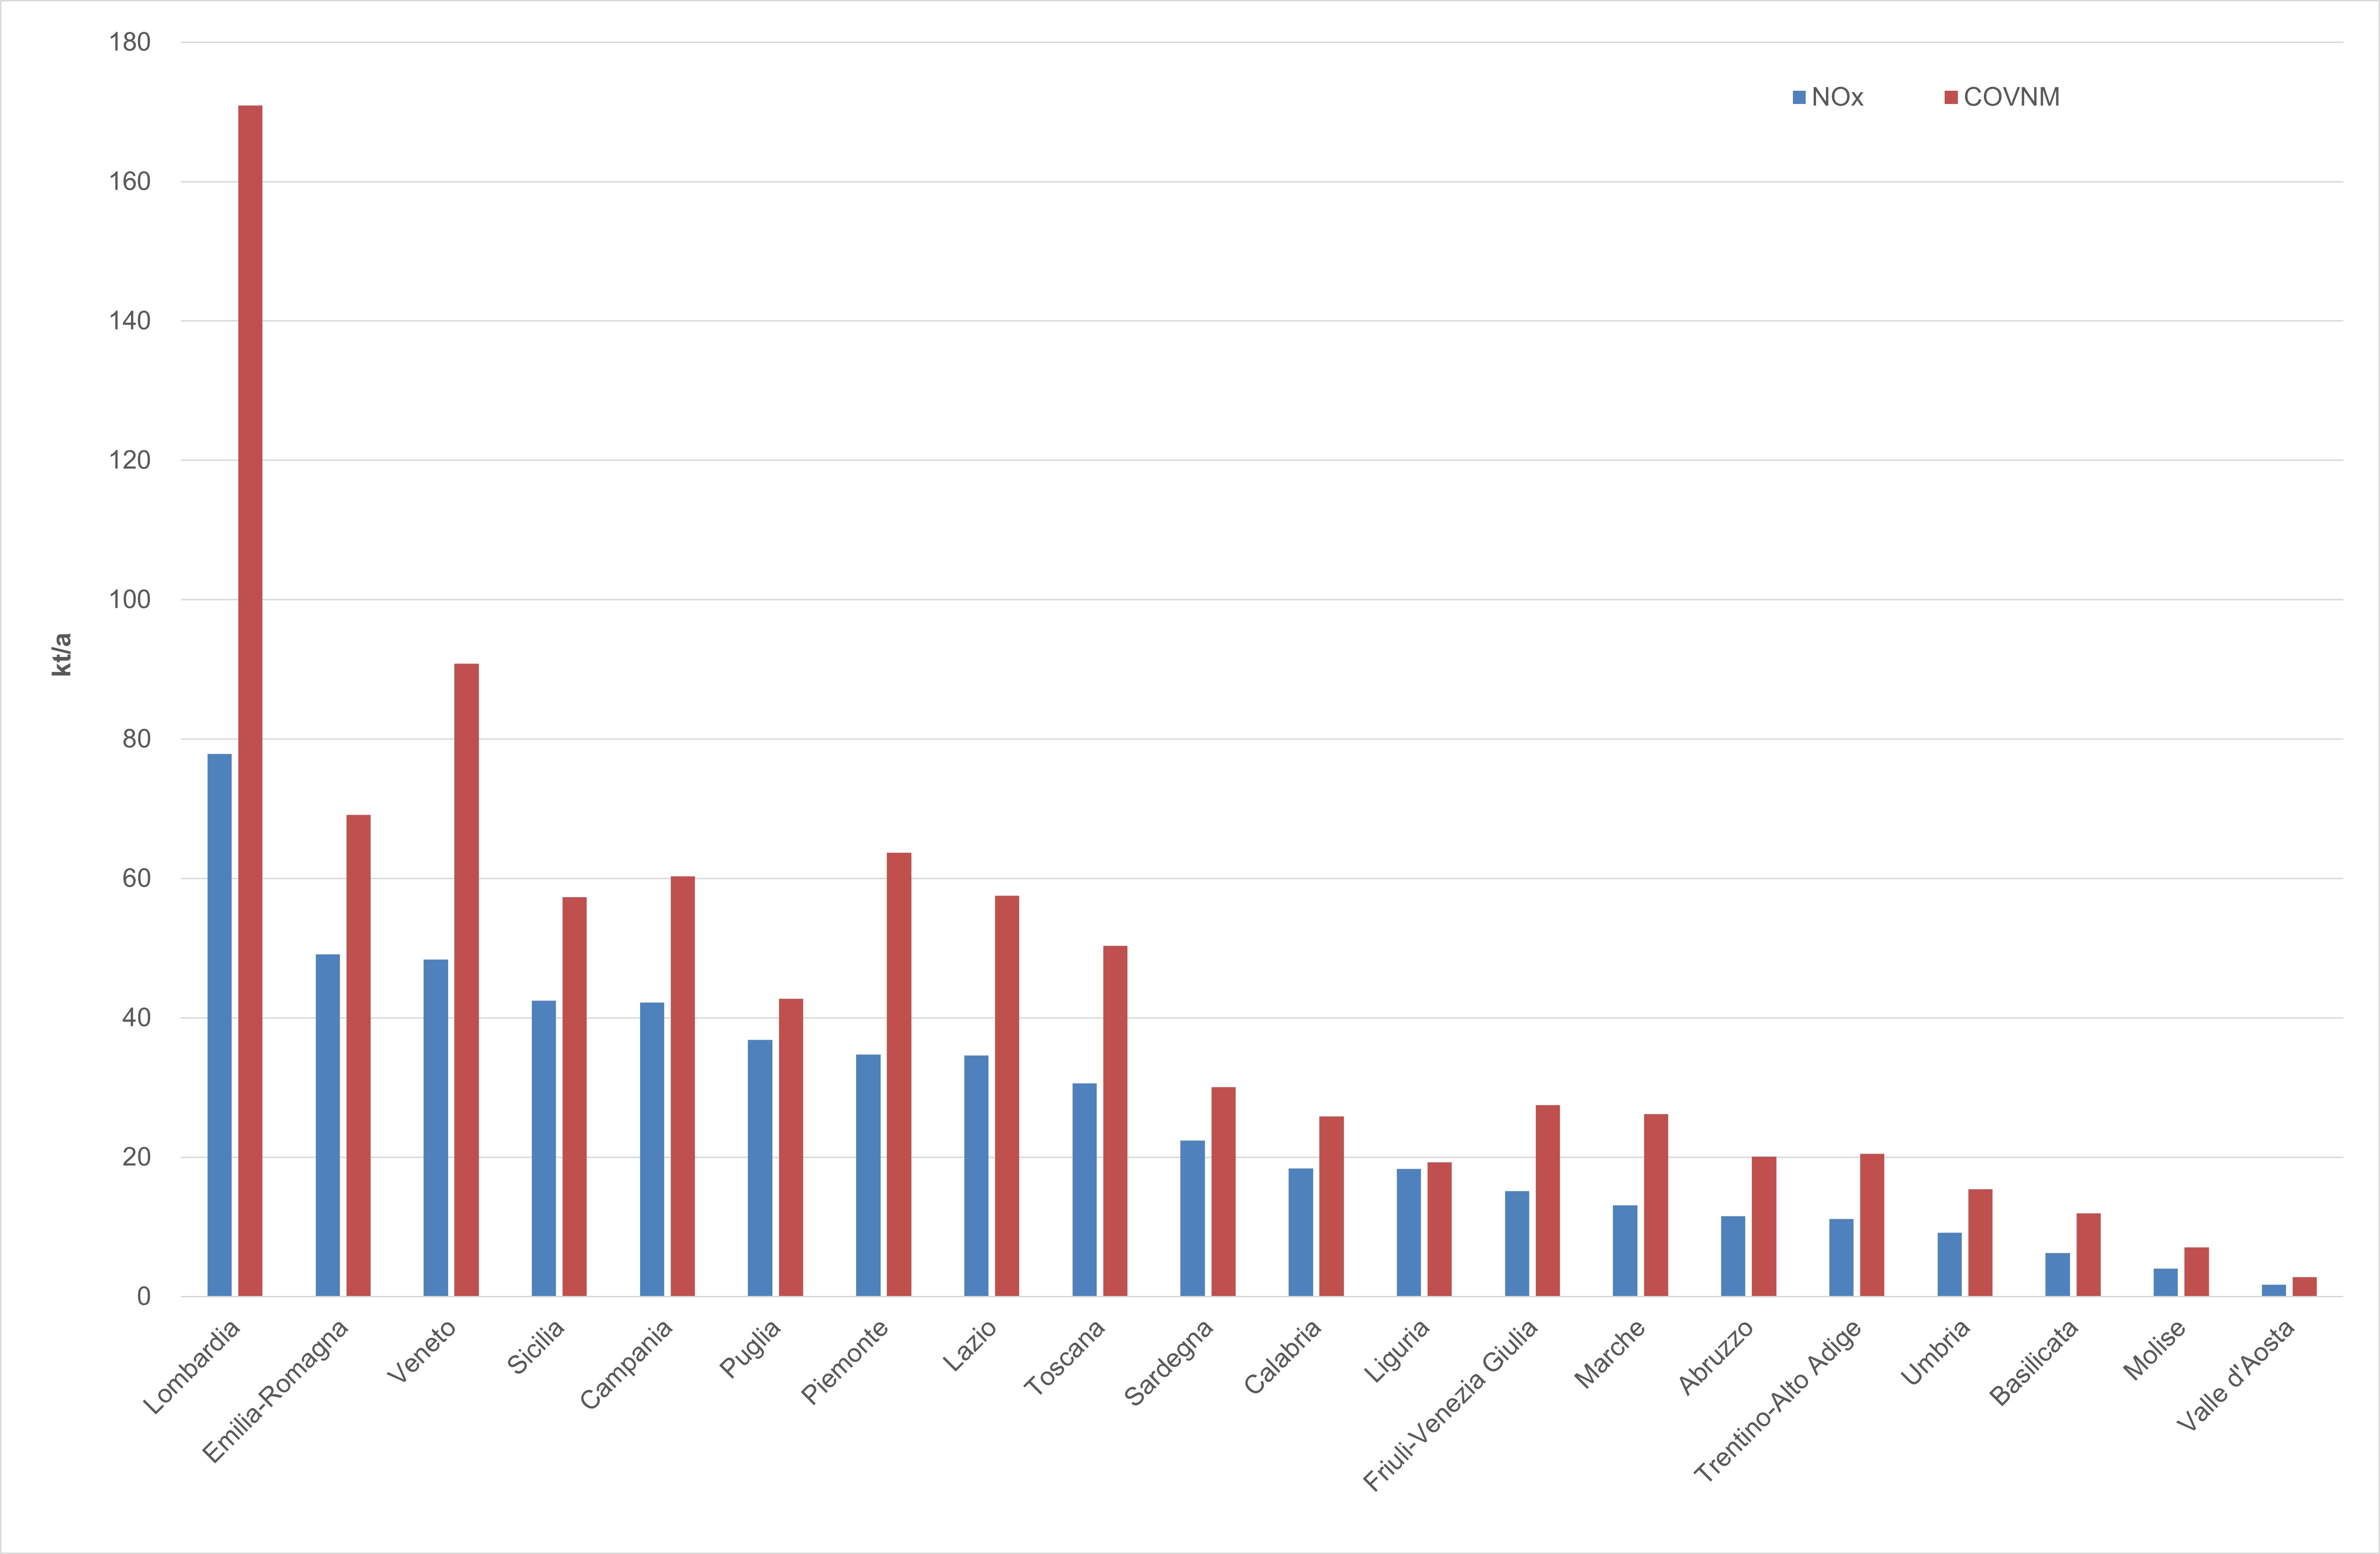
Figure 4: Regional emissions of ozone precursors (NOₓ, NMVOCs) (2023) Data source
ISPRA Note
Regional data for 2023 were disaggregated using a top-down methodology based on the data reported in the national inventory submitted in 2025, through ad hoc proxy variables specific to each inventory activity. |
To ensure consistency and comparability of the inventory, the annual update of emissions involves continuous revision of the entire historical series based on new information and the latest methodological developments.
Natural emissions (other sources and sinks) are not included in the totals, in line with the classification adopted in the national emission inventory. For nitrogen oxides, the contribution from road transport has remained relatively stable over the years and is the main national NOx emission source (40% in 2023). From 1993, essentially due to the introduction of catalytic converters, the increasing trend of road emissions reversed. In 2023, these emissions were reduced by 77.5% compared to 1990. NOx emissions from non-road transport modes decreased by 53% since 1990, representing the second-largest national emission source and contributing 22.1% of the total in 2023. Non-industrial combustion, the only sector showing an increase (+15.5% since 1990), accounted for 13.3% of total emissions, while industrial combustion and combustion in energy production and transformation industries represented 7.7% and 5.6% of the national total in 2023, respectively (Table 1, Figure 2).
NMVOC emissions originate primarily from: Solvent use (44.1% of total emissions in 2023), which decreased by 39.3% since 1990; Non-industrial combustion (18.9% of emissions in 2023), which increased by 60.4% since 1990; Transport (road transport and other mobile sources represent 10.4% and 1.8% of total emissions in 2023, respectively); Agriculture, which decreased by 18.9%, representing 14.1% of total emissions in 2023.
The largest reduction concerns transport, mainly due to the introduction of vehicle emission control systems such as catalytic converters and canisters (-88.2% for road transport and -88.0% for other mobile sources) (Table 1, Figure 1).
In a context of general reduction in emissions, the highest shares of nitrogen oxides and non-methane volatile organic compounds originate from Lombardy with values equal to 78 kt and 171 kt respectively, while the smallest shares are generated from Valle d'Aosta with values equal to 2 kt and 2.7 kt (Table 3, Figure 4).