Daniela Romano, Marina Vitullo
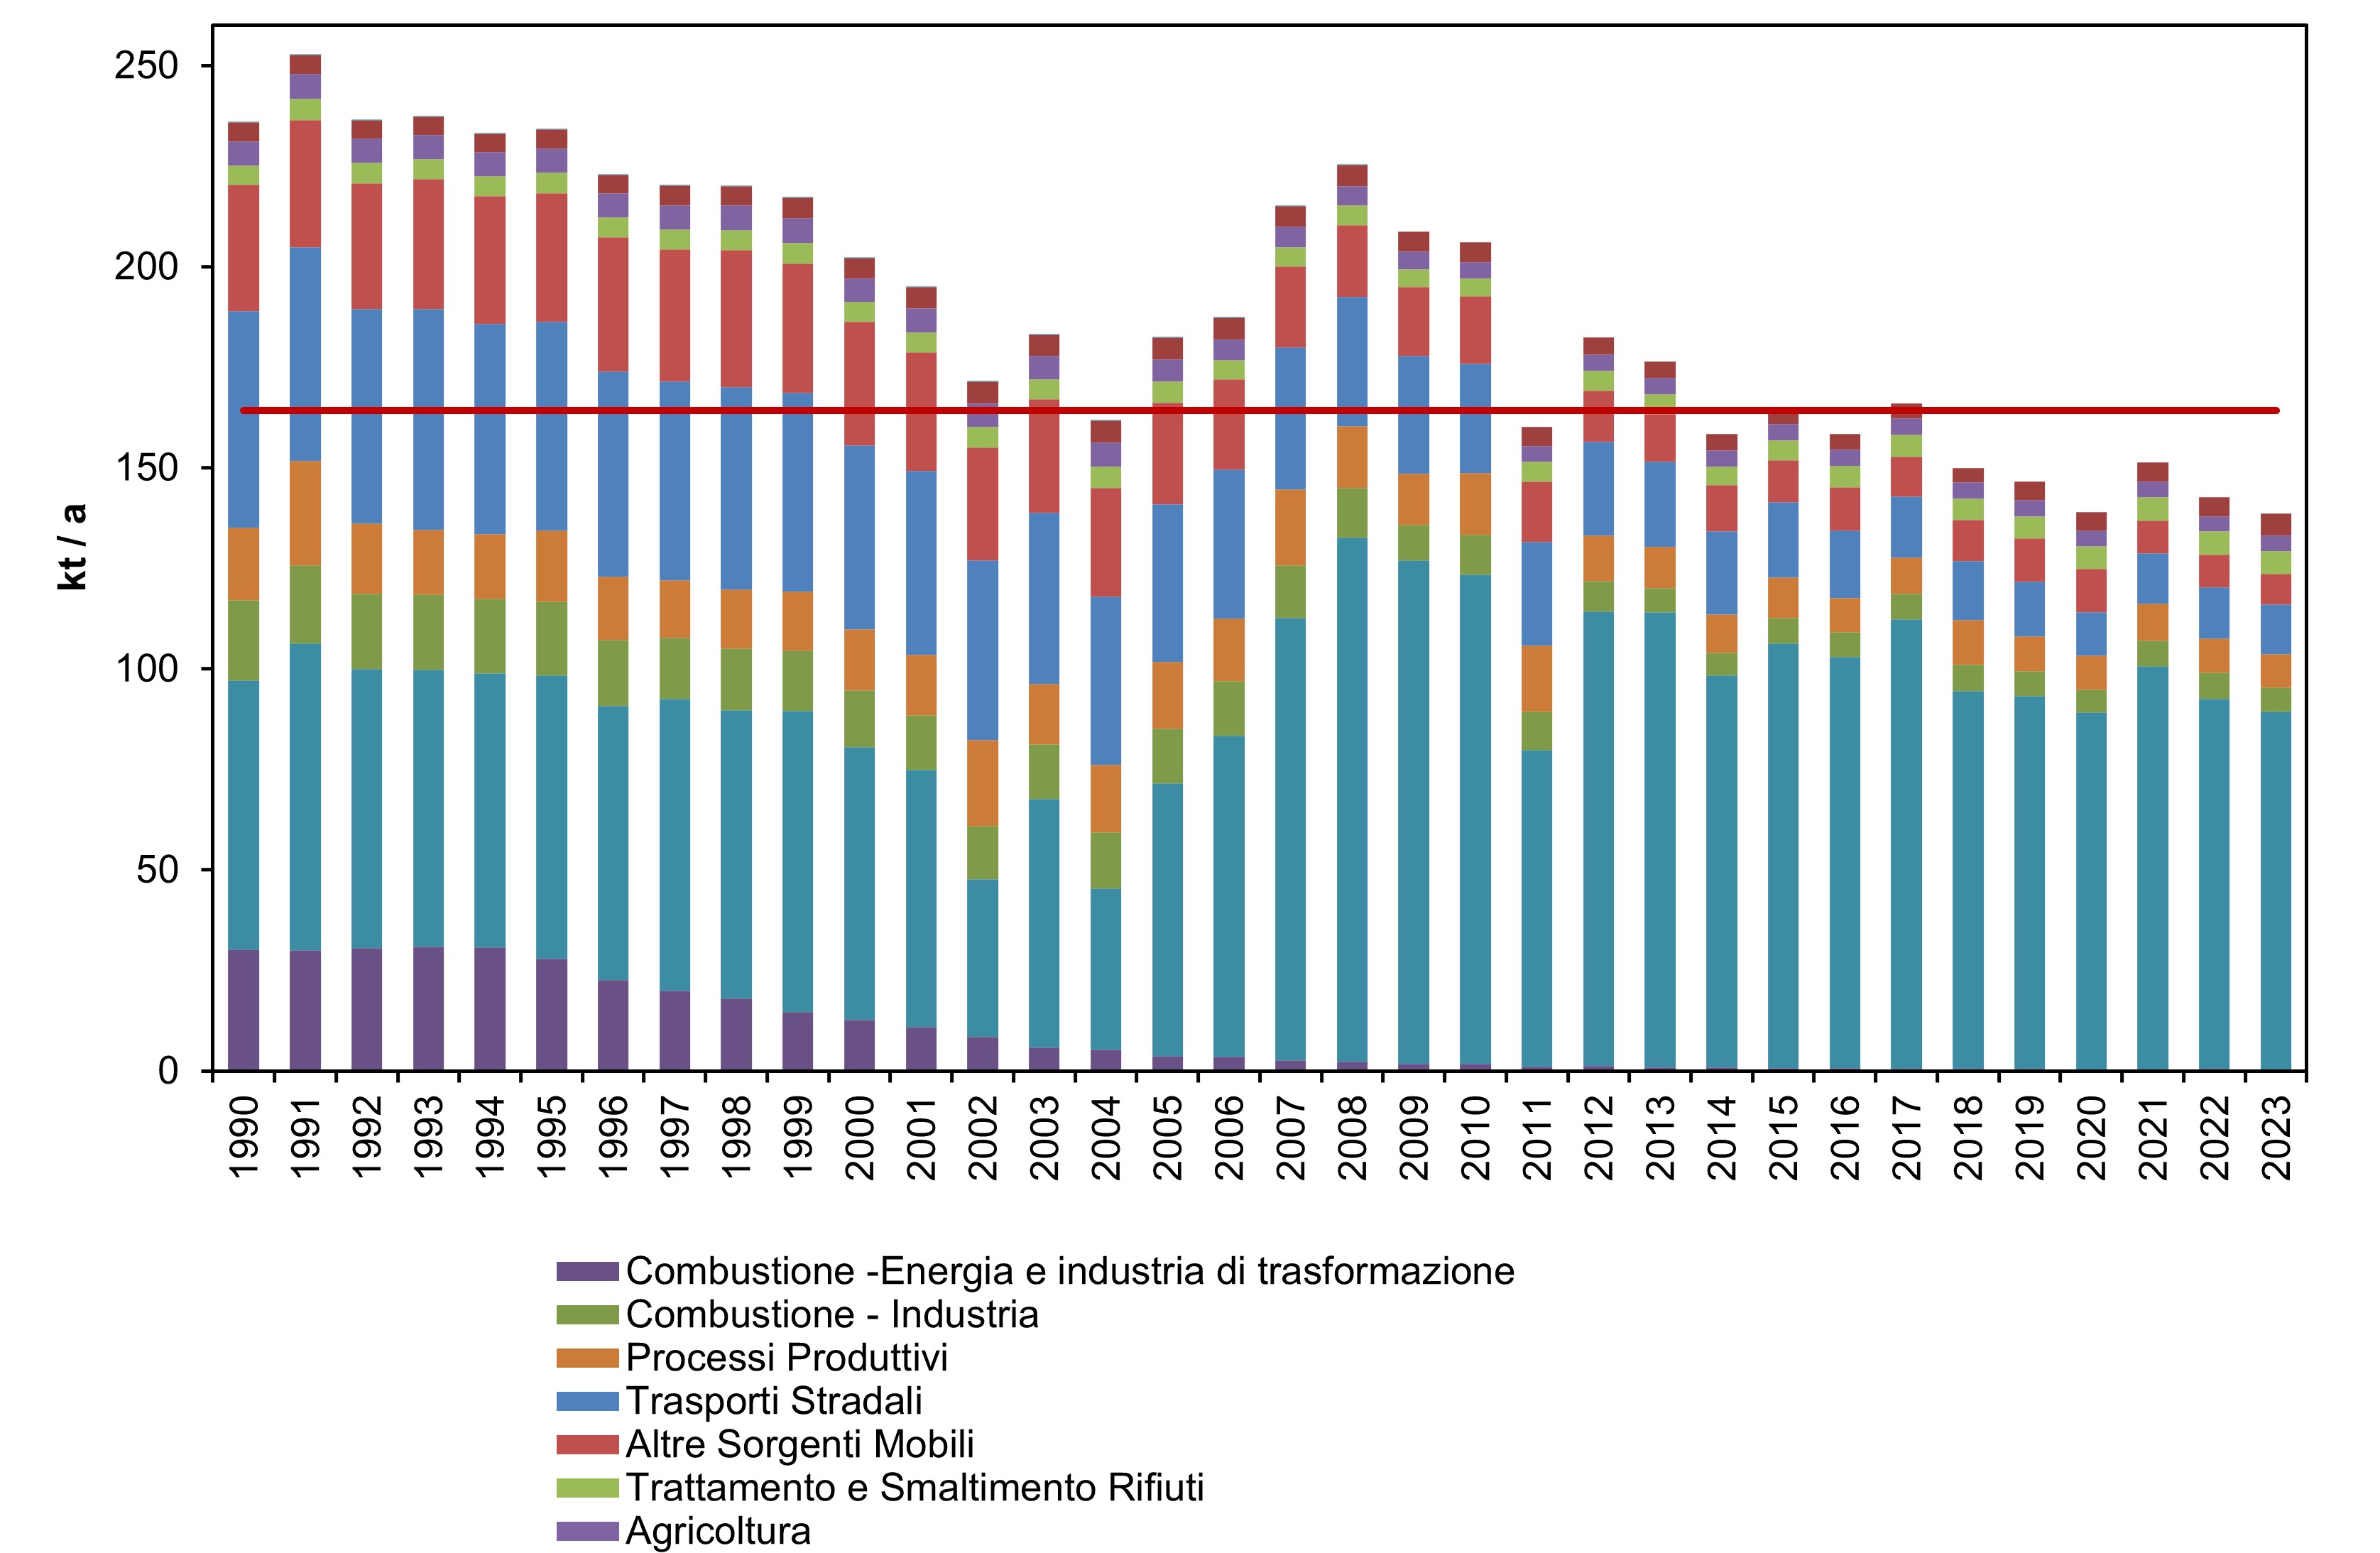
The indicator represents the trend in national emissions of particulate matter (PM2.5) by sector of origin from 1990 to 2023, highlighting a marked reduction over the years at a total level (-41%). The road transport sector, which contributes to total emissions with an emission share of 8.9% in 2023, presents a reduction of 77% over the entire period. Emissions from non-industrial combustion, in the same period, grew by 34%, representing the most important sector in 2023 with 64.4% of total emissions.
Particulate matter smaller than 2.5 µm consists of airborne particles of such a size that, once inhaled, they penetrate deeply into the human respiratory system. Like PM10, PM2.5 particulate matter is also partly emitted as such directly from sources into the atmosphere (primary PM2.5) and is partly formed through chemical reactions between other polluting species (secondary PM2.5). The direct emission of PM2.5 is associated with all combustion processes, in particular those that involve the use of solid fuels (coal, wood) or liquids such as diesel and fuel oil. Fine particles are therefore emitted by road transport, energy production plants, home heating systems and forest fires. The estimates made relate only to emissions of primary origin, while those of secondary origin are not calculated, as are those due to the resuspension of dust deposited on the ground.
Evaluate the trend over time of PM2.5 emissions (particles smaller than 2.5 µm) disaggregated by sector, relevant for monitoring the effectiveness of emission reduction regulations with particular attention to urban areas.
As part of the UNECE Convention on long-range transboundary air pollution (CLRTAP), Italy is required to update and annually communicate the national inventory of polluting emissions into the atmosphere, which includes, among the various pollutants, also PM2.5. The national reference legislation for the protection of the air and the reduction of emissions into the atmosphere is Legislative Decree 3 April 2006, n. 152 (“Environmental regulations”, part five). The Decree was subsequently updated by Legislative Decree 128/2010 and underwent further changes following the entry into force of Legislative Decree no. 4 March 2014. 46 on industrial plants. Numerous regulations limit particulate emissions in certain sectors, particularly road transport and industry. As regards stationary sources, Directive 2010/75/EU indicates the particulate emission limit values for solid, liquid and gaseous fuels in large combustion plants. For medium combustion plants, Directive (EU) 2015/2193 also establishes rules for the control of air emissions, in order to reduce potential risks to human health and the environment. For mobile sources, the most recent provisions regarding emissions of particulate matter derive from EC Regulation 715/2007 relating to the approval of motor vehicles with regard to emissions from light passenger and commercial vehicles (Euro 5 and Euro 6) and from EC Regulation 595/2009 relating to the approval of motor vehicles and engines with regard to emissions from heavy-duty vehicles (Euro VI). The new NEC Directive 2016/2284 of the European Parliament and of the Council (implemented with Legislative Decree 81 of 2018), concerning the reduction of national emissions of certain air pollutants, defines the national emissions reduction commitments compared to 2005, applicable from 2020 to 2029 and starting from 2030: reduction commitments of 10% and 40% respectively.
ISPRA, 2022. The provincial-level disaggregation of the national emissions inventory. Available on http://www. isprambiente. gov. it/it/pubblicazioni/rapporti . Reports 369/2022.
ISPRA, 2025. Italian Emission Inventory 1990-2023. Information Inventory Report 2025 (https://www. isprambiente. gov. it/it/pubblicazioni/rapporti; https://www. ceip. at/status-of-reporting-and-review-results/2025-submission).
ISPRA
Used ISPRA data from the National Inventory of Atmospheric Emissions (https://emissioni. sina. isprambiente. it/interno-nazionale/).
National, Regional
1990-2023
The estimate is calculated as part of the development of the national atmospheric emission inventory. For air pollutants, the methodology applied is that indicated by the European Environment Agency (EMEP/EEA Air Pollutant Emission Inventory Guidebook 2019).
For a detailed description of the estimation methodology, reference is made to the Informative Inventory Report – IIR (https://www.isprambiente.gov.it/it/pubblicazioni/rapporti/inventario-nazionale-emissioni-1990-2023-informative-inventory-report-2025; https://www.ceip.at/status-of-reporting-and-review-results/2025-submission).
In 2023, PM2.5 emission levels amounted to 139 kt, remaining below the target set for 2020–2029 (164 kt, reduction of 10% relative to 2005 levels) (Figure 1)..
National PM2.5 emissions decreased by 41% between 1990 and 2023, showing a positive environmental trend (Table 1).
Despite the overall decreasing trend, sectoral analysis shows increases, particularly emissions from non-industrial combustion, which grew by 33.6% between 1990 and 2023 due to increased wood combustion in residential heating systems, representing in 2023 the most significant sector with a 64.4% share of total emissions.
| Data |
|---|
Thumbnail
Headline
Figure 1: National PM2.5 emissions by source sector Data source
ISPRA Note
Emission values have been updated in line with the annual update of the national emission inventory. |
Headline
Table 1: National PM2.5 emissions by source sector Data source
ISPRA Data legend
A: Combustion – Energy production and transformation industries Note
Emission values have been updated in line with the annual update of the national emission inventory. |
Headline
Table 2: Regional emissions of PM2.5 Data source
ISPRA Data legend
a) Emissions from offshore point sources, such as vessel cruising phases or activities related to the extraction of liquid or gaseous fuels. Note
Regional data for the years 1990, 1995, 2000, 2005, 2010, 2015, 2019, and 2023 were disaggregated using a top-down methodology based on the data reported in the national inventory submitted in 2025, through ad hoc proxy variables specific to each inventory activity. Emissions from international aviation and from LULUCF (Land Use, Land Use Change and Forestry), in particular those from fires, are excluded. These selections explain the differences between the sum of regional data and national totals for the various pollutants. |
Thumbnail
Headline
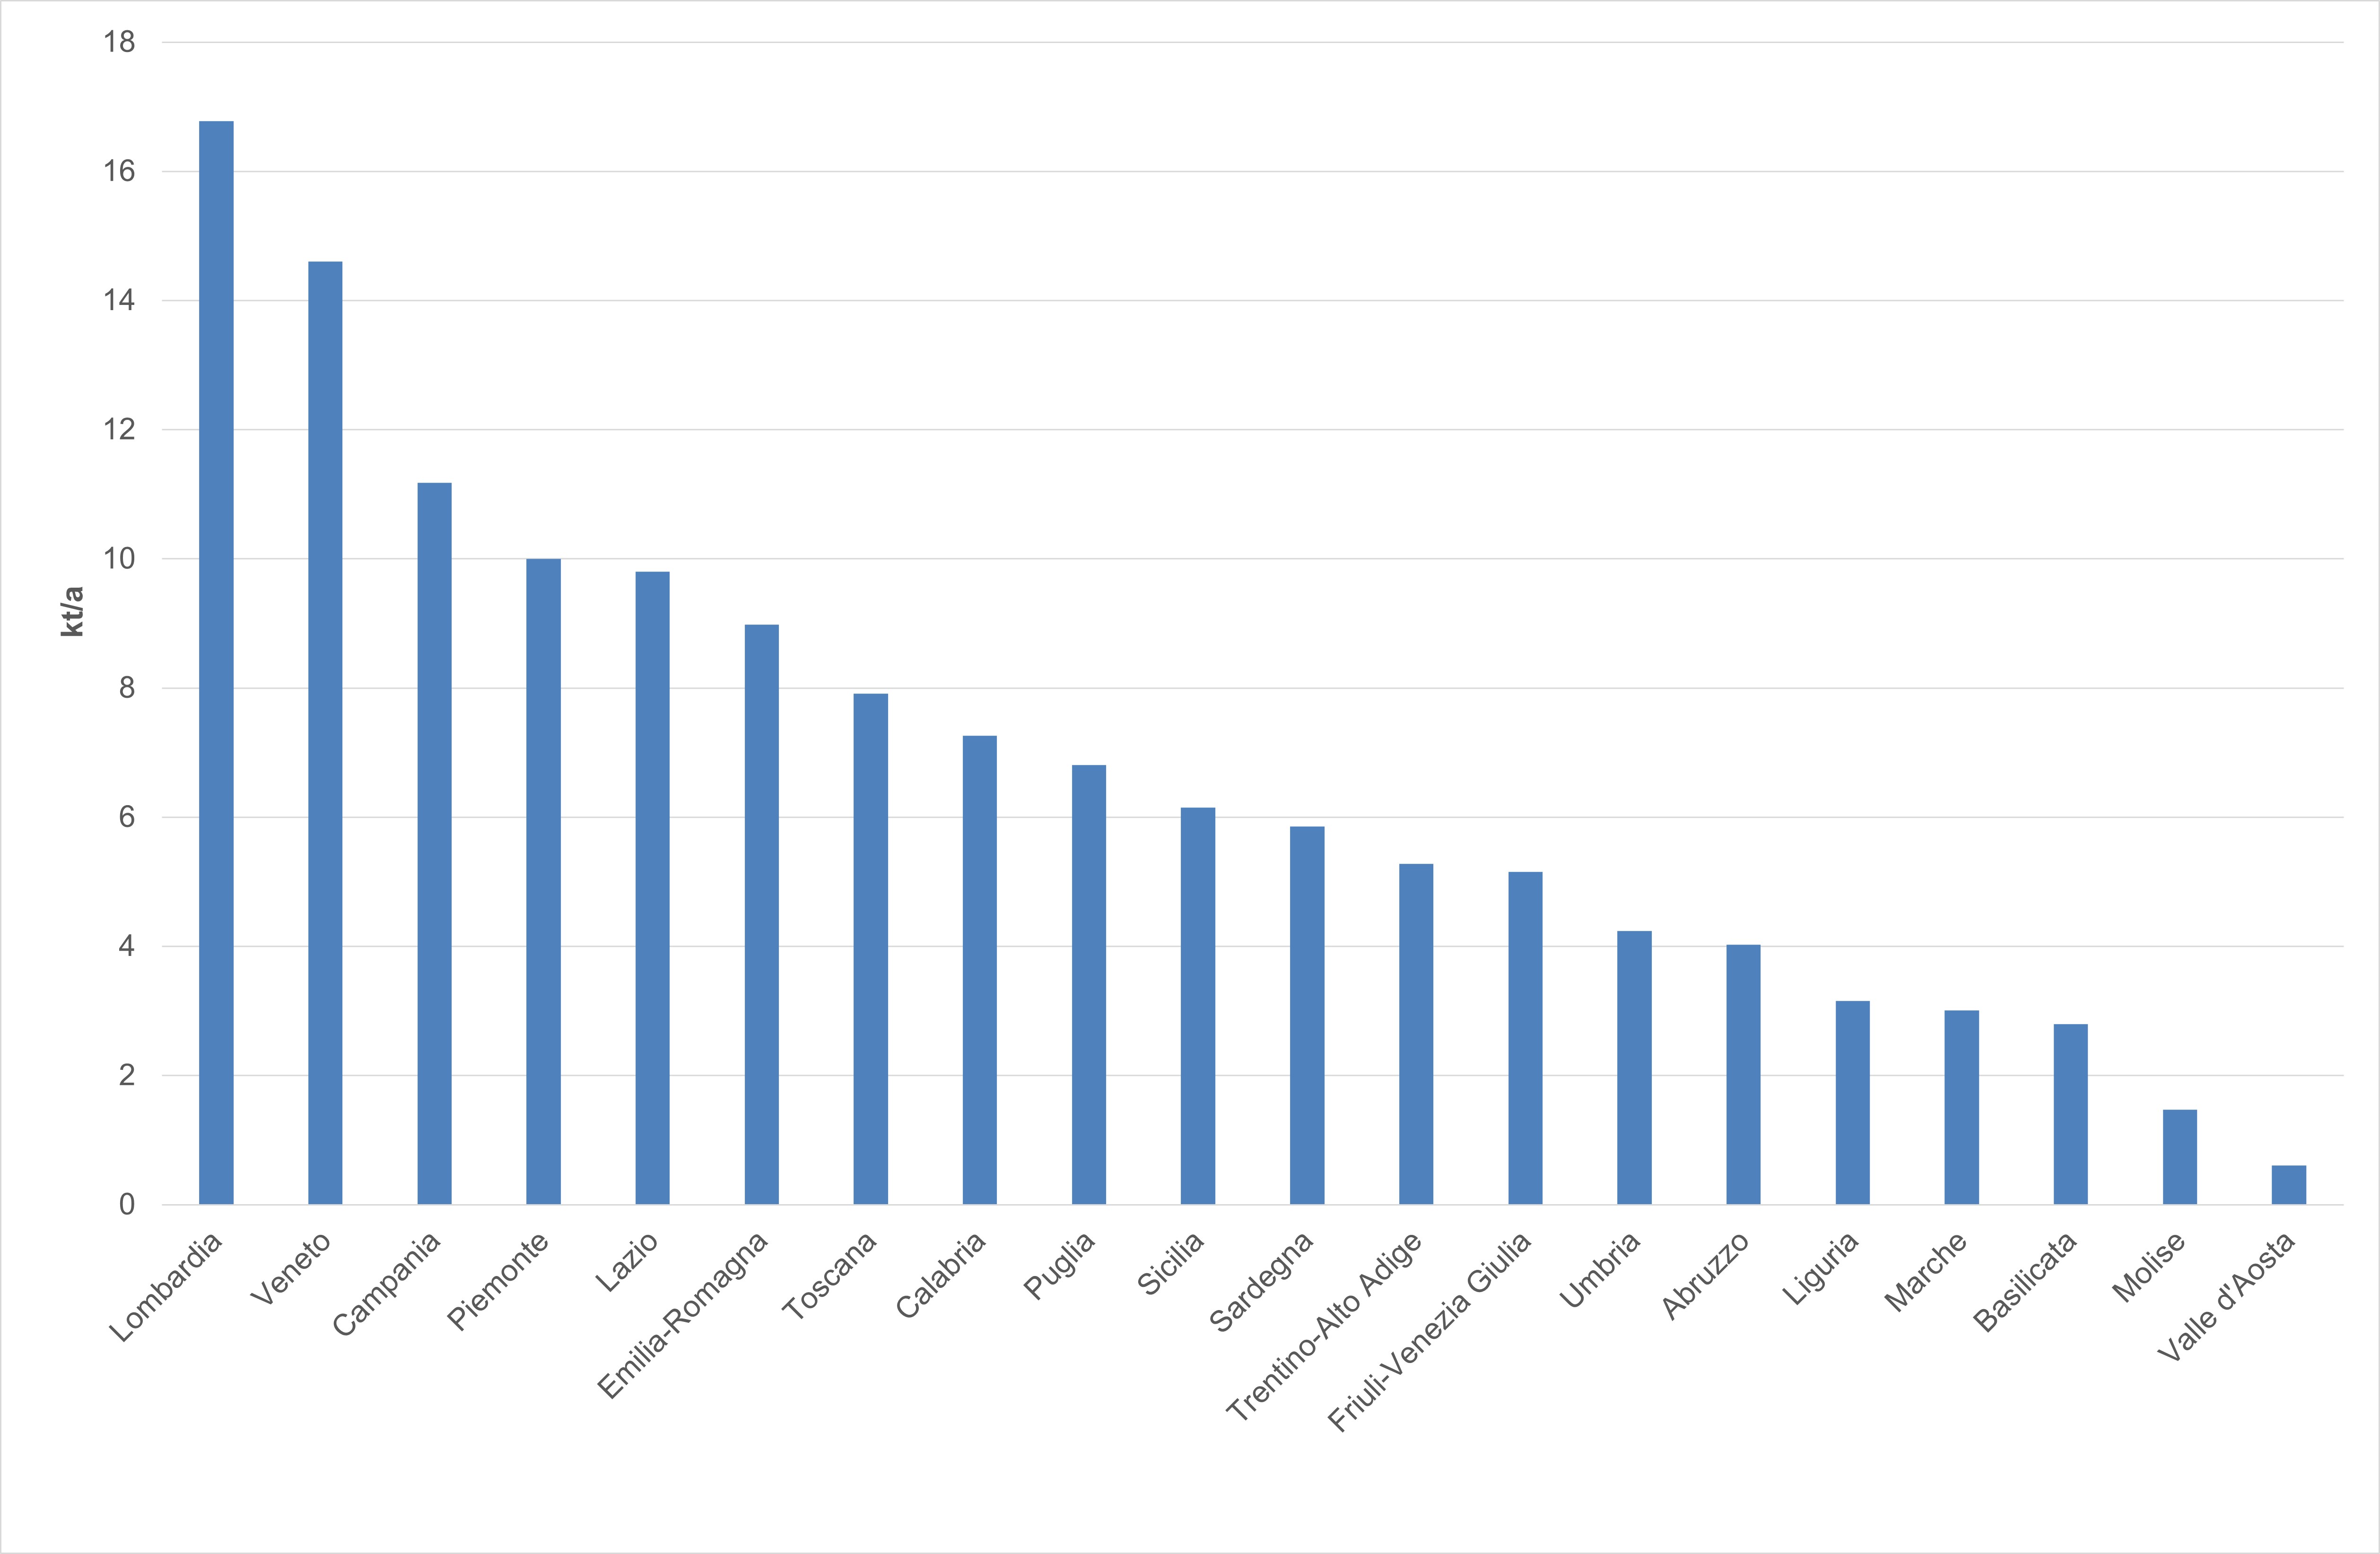
Figure 2: Regional emissions of PM2.5 (2023) Data source
ISPRA Data legend
Regional data for 2023 were disaggregated using a top-down methodology based on the data reported in the national inventory submitted in 2025, through ad hoc proxy variables specific to each inventory activity. |
National emissions are calculated in accordance with the European estimation methodology described in the EMEP/EEA Air Pollutant Emission Inventory Guidebook – 2019.
Natural sources (other emission sources and sinks) are excluded from the totals, consistent with the classification used in the national emission inventory. Between 1990 and 2023, the road transport sector decreased by 77.1% and accounted for about 8.9% of total emissions in 2023. Emissions from non-industrial combustion increased by 33.6%, while other combustion processes recorded significant reductions in particulate emissions. Specifically, emissions from combustion for energy production and in transformation industries decreased by 98.8%, representing only 0.3% of total emissions in 2023, compared to an average of about 13% until 1995. Emissions from combustion processes in manufacturing industries decreased by 70.5%, reaching a share of 4.2% of the total in 2023.
Reductions in the energy and industrial sectors are mainly due to the introduction of two regulatory instruments: DPR 203/88, establishing authorization rules for plants, and the Ministerial Decree of 12 July 1990, introducing emission limits for industrial facilities. In 2023, emissions from agricultural activities, production processes, and other mobile sources accounted for 2.8%, 6.0%, and 5.5% of the total, with reductions since 1990 of -36.9%, -54.0%, and -75.6%, respectively. Emissions from waste treatment and disposal increased by 20.4% since 1990, reaching a 4.1% share of total emissions in 2023 (Table 1, Figure 1).
An analysis of the data at a regional level shows that the regions that contribute most to PM2.5 emissions are Lombardy (16.8 kt/y) and Veneto (14.6 kt/y), while those with a lower impact are Molise (1.5 kt/y) and Valle d'Aosta (0.6 kt/y) (Table 2 and Figure 2).