Marina Vitullo
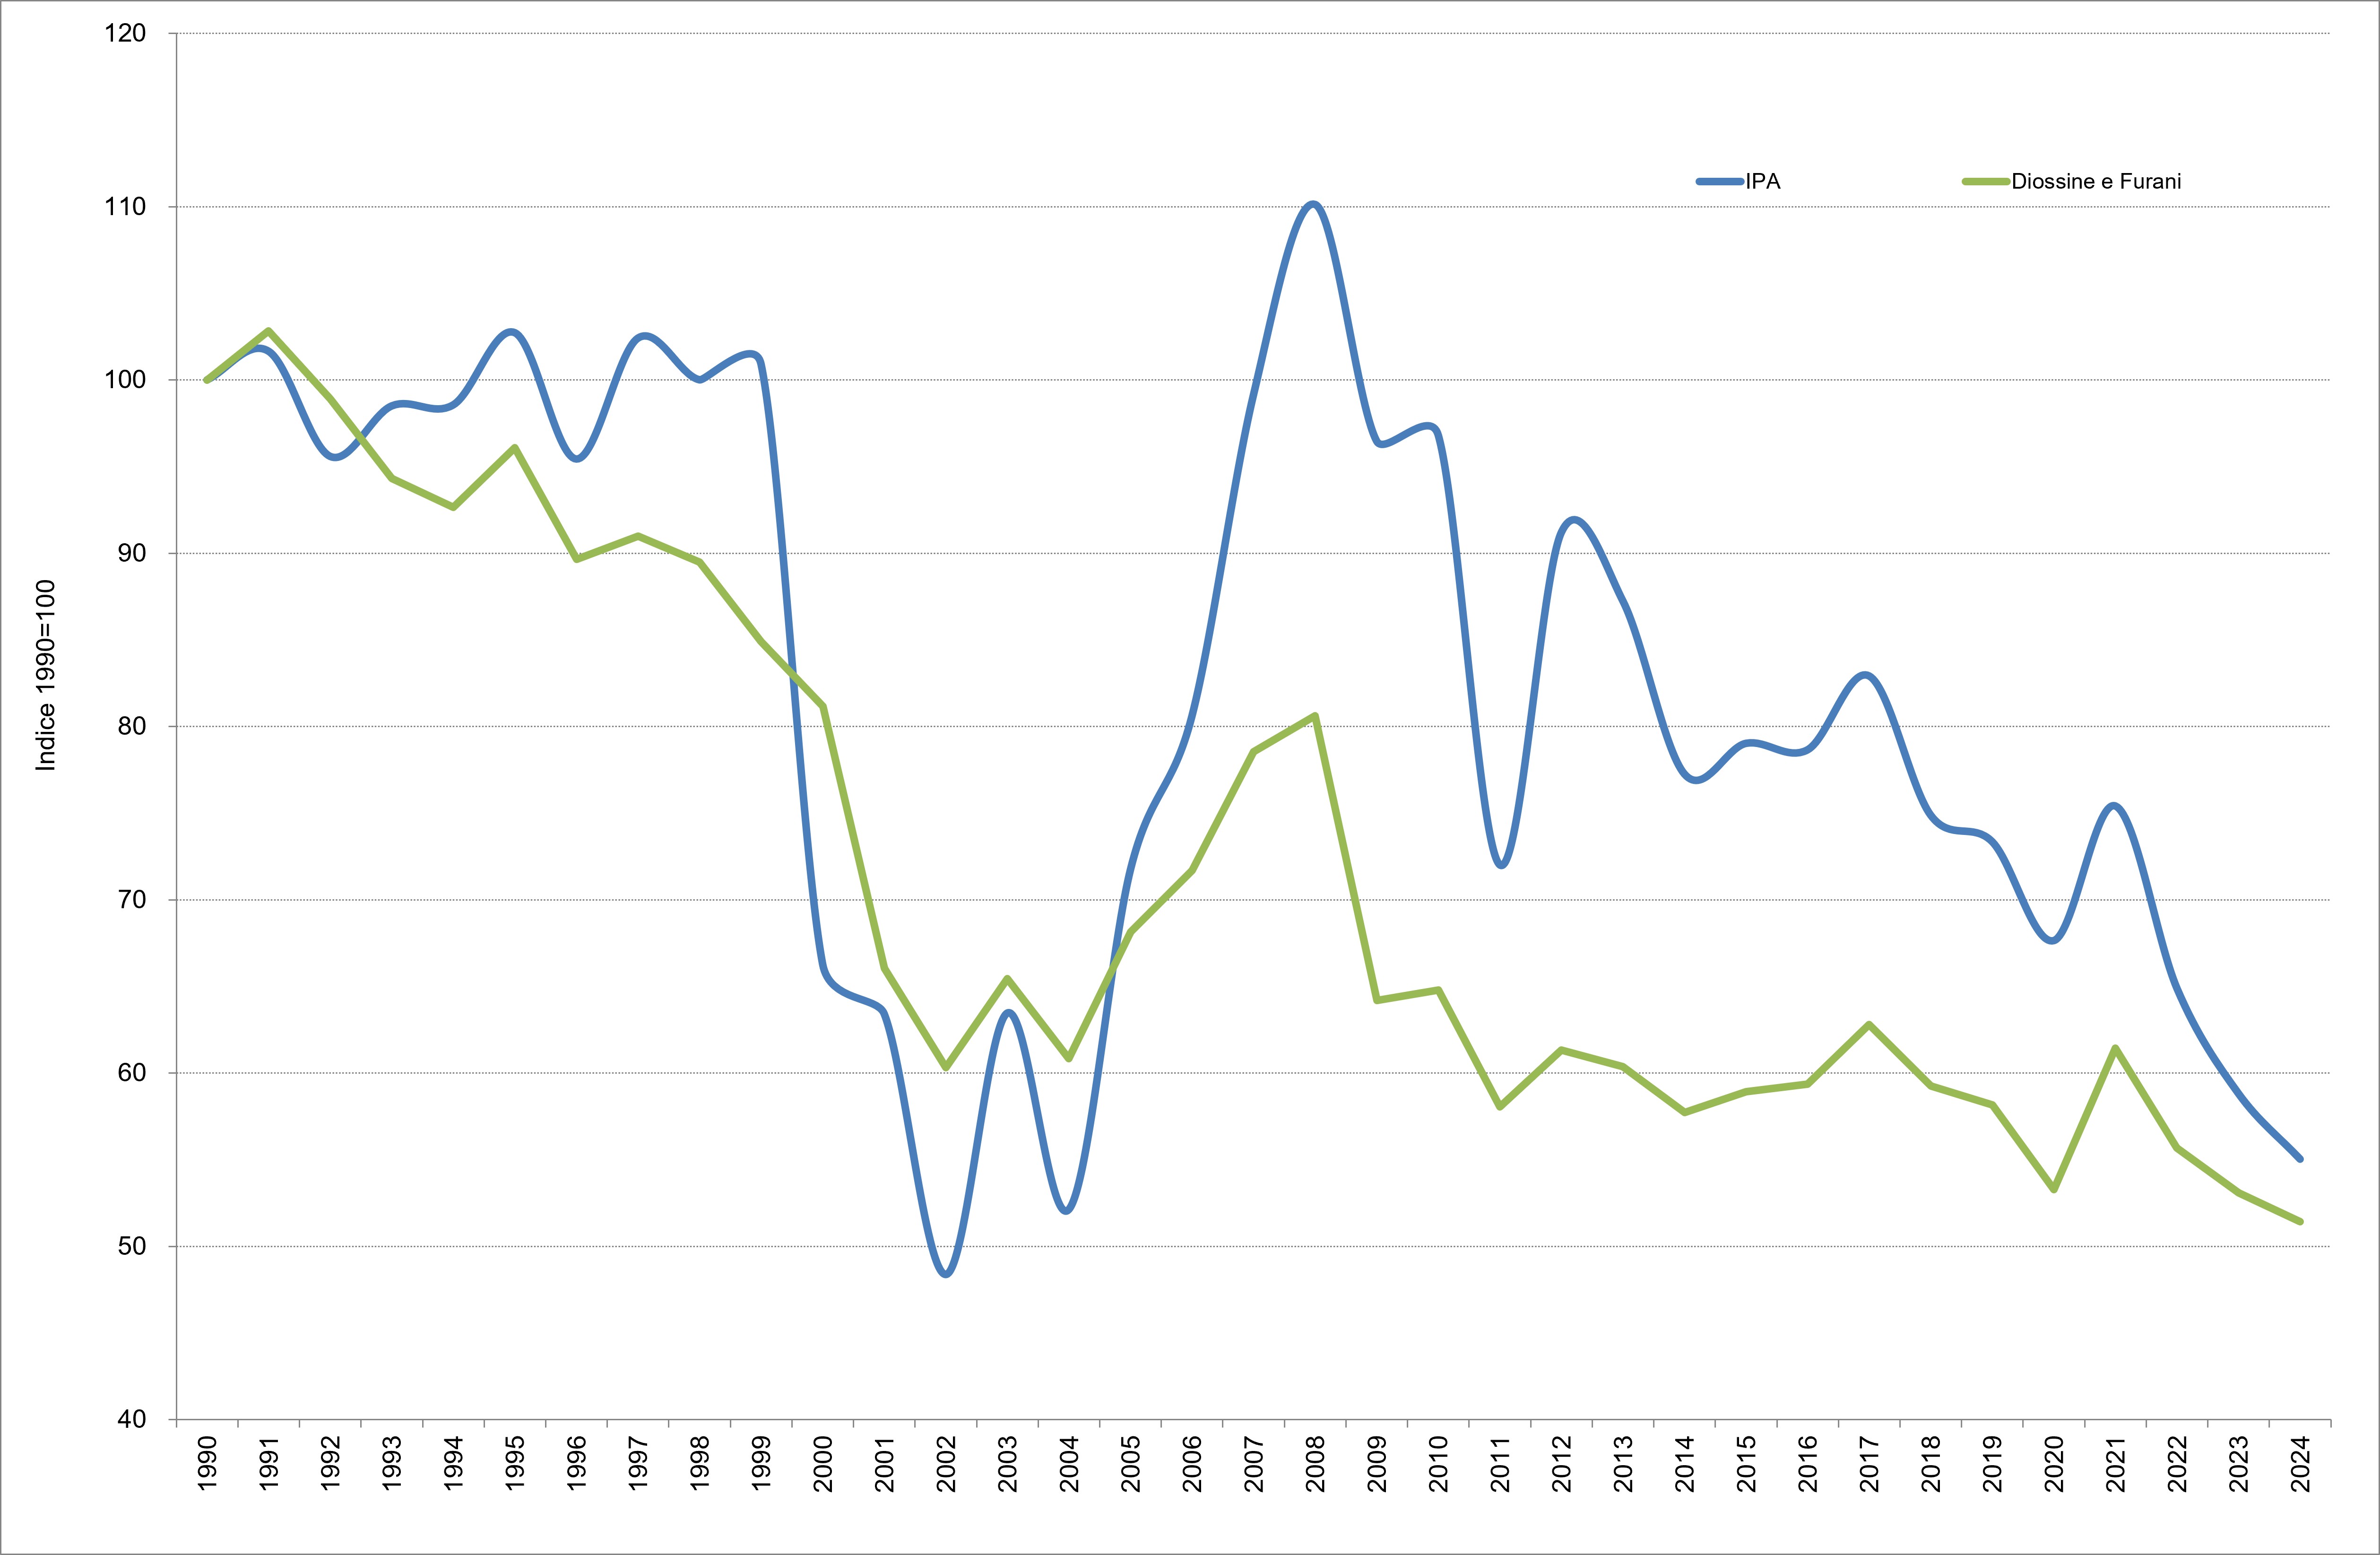
The indicator represents the trend of national emissions of persistent organic compounds by sector of origin, from 1990 to 2024. The objective of achieving emission values lower than those of 1990 was achieved both for PAHs (-45%) and for dioxins and furans (-49%), albeit with different trends.
Polycyclic Aromatic Hydrocarbons (PAHs), dioxins and furans are organic compounds deriving from energy production activities, thermal plants and industrial processes. Other minor emission sources are traffic and the incineration of organic waste. PAHs are also released into the atmosphere from natural sources such as volcanic eruptions, forest fires and the activity of certain species of microorganisms. These groups of substances are relevant to health due to their toxicity and persistence in the environment (they give rise to bioaccumulation phenomena) and, as carcinogenic agents of varying intensity, are classified by IARC as: the 2,3,7,8 Tetra-chloro-dibenzo-para-dioxin as a known human carcinogen, PAHs as probable carcinogens, and dioxins and furans as possible carcinogens.
The purpose is to estimate the total national emissions and their disaggregation by production process of PAHs, dioxins and furans, that makes it possible to assess the emission trend during the period under consideration and to compare it with the objective established by the Aarhus Protocol.
The Aarhus Protocol on Persistent Organic Pollutants (1998), within the Geneva Convention on Long-Range Transboundary Air Pollution (1979), specifies as an objective the reduction of emissions of dioxins, furans and PAHs below the levels achieved in 1990 (or, alternatively, every other year between 1985 and 1995).
ISPRA, 2026. Italian Emission Inventory 1990-2024. Information Inventory Report 2025
ISPRA
Used ISPRA data from the National Inventory of Atmospheric Emissions (https://emissioni. sina. isprambiente. it/interno-nazionale/).
National
1990 - 2024
Estimate carried out within the framework of the preparation of the national atmospheric emission inventory. As regards PAHs, the unit of measurement is the tonne (t). As regards dioxins and furans, emissions are reported in grams of toxic equivalent according to the I-Teq toxicity classification (g I-Teq). For air pollutants the methodology used is that indicated by the European Environment Agency (EMEP/EEA Guidebook - 2023). For the description of the estimation methodology, reference is made to the Information Inventory Report – IIR 2025 (https://www. isprambiente. gov. it/it/pubblicazioni/rapporti/; https://www. ceip. at/status-of-reporting-and-review-results/2026-submission). To guarantee the consistency and compatibility of the inventory, the annual update of emissions involves the revision of the entire historical series on the basis of greater information and the most recent methodological developments
The emission values of PAHs stand at 49 t in 2024, while for dioxins and furans a level of 272 gI-Teq is observed. In 1990 the emission levels were equal to 90 t for PAHs and 490 gI-Teq for dioxins and furans. The objective set by the Aarhus Protocol, reducing emissions of dioxins, furans and PAHs below the levels achieved in 1990, was achieved by both substances (Tables 1 and 2).
Emissions of PAHs and dioxins and furans, from 1990 to 2024, are reduced by 45% and 49% respectively, thus outlining a positive trend (Tables 1, 2 and Figure 1).
| Allegati |
|---|
Titolo
Table 1: PAH – Polycyclic Aromatic Hydrocarbons emissions by sector Fonte
ISPRA Legenda
A: Combustion – energy and transformation industry; B: Non-industrial combustion; C: Industrial combustion; D: Production processes; F: Solvent use; G: Road transport; H: Other mobile sources; I: Waste treatment and disposal; L: Agriculture. |
Titolo
Table 2: Dioxin and Furan emissions by sector Fonte
ISPRA Legenda
A: Combustion – energy and transformation industry; B: Non-industrial combustion; C: Industrial combustion; D: Production processes; F: Solvent use; G: Road transport; H: Other mobile sources; I: Waste treatment and disposal; L: Agriculture. |
Thumbnail
Titolo
Figure 1: Trend of national emissions of persistent organic compounds indexed to 1990 Fonte
ISPRA Note
Emission values have been updated consistently with the annual update of the national emission inventory. |
As regards emissions of dioxins and furans, since 1990 there has been a general decrease in all sectors, except for production processes (+19.4%) (Table 2). In 2024, dioxin and furan emissions derive: 28.2% from non-industrial combustion processes, 29.5% from production processes, 19% from the waste sector, 19.5% from combustion processes in industry and smaller shares from the road transport sector (2.1%), from combustion processes for energy production (1.4%). A marked decrease has been observed since 2004 in the use of abatement technologies in the main national steel production industry (Table 2, Figure 1). In 2024, PAH emissions will show an overall reduction of 45% compared to 1990. In detail, a fairly constant trend can be seen from 1990 to 1999, followed by a sharp fall between 1999 and 2000 and a recovery starting from 2003. The sharp decline that occurs between 1999-2000 is mainly attributable to technological improvements in production processes (steel mills), which see their emissions reduced by 88% overall in the period 1990-2024. On the other hand, emissions from the non-industrial combustion sector grew during the period in question (+21%), accentuated by the large increase in consumption of wood for heating. These two sectors cover 11.8% and 78% of total PAH emissions in 2024, respectively (Table 1, Figure 1).