Panel 1
Daniela Romano
The indicator describes the trend in national emissions of the acidifying substances SOx, NOx, and NH₃, both in total and by sector, highlighting the decreasing trend from 1990 to 2023 (-72.3%). With reference to Directive (EU) 2016/2284 of the European Parliament and of the Council on the reduction of national emissions of certain atmospheric pollutants—which defines national emission reduction commitments compared to 2005, applicable from 2020 to 2029 and from 2030 onwards—sulphur oxides and ammonia achieved the required 2020 reduction target as early as 2009, while nitrogen oxides reached it in 2014.
Emission estimates are obtained through appropriate estimation processes according to the methodology provided by the European Environment Agency (EMEP/EEA air pollutant emission inventory guidebook, 2019).
Anthropogenic emissions of sulphur oxides (SOx) mainly derive from the use of fuels containing sulphur, while natural sources are primarily volcanic. SOx are among the main agents responsible for the acidification of the atmosphere, with negative effects on ecosystems and materials.
Nitrogen oxides (NOx) are produced during high-temperature combustion processes; the main sources include transport, heating systems, industrial combustion, agriculture, and the production of electricity and heat.
As for ammonia (NH₃), emissions are almost entirely due to agricultural activities (including livestock farming).
The purpose is to assess the pressures caused by acidifying substances and their trend over time in relation to national and international emission reduction targets (Legislative Decree 171/2004, Gothenburg Protocol, and NEC Directive).
The 1999 Gothenburg Protocol to the 1979 Convention on Long-Range Transboundary Air Pollution, amended in 2012, aims to reduce acidification, eutrophication, and ground-level ozone (the European Community acceded through Council Decision 2003/507/EC).
Directive (EU) 2015/2193 (implemented in Italy by Legislative Decree No. 183/2017) applies to medium combustion plants and establishes rules for controlling emissions of sulphur dioxide (SO₂), nitrogen oxides (NOx), and dust into the air, to reduce emissions and potential risks to human health and the environment.
The NEC Directive 2016/2284/EU of the European Parliament and of the Council (implemented by Legislative Decree No. 81/2018), on the reduction of national emissions of certain atmospheric pollutants, defines emission reduction commitments compared to 2005, applicable from 2020 to 2029 and from 2030 onwards: SOx: 35% and 71%; NOx: 40% and 65%; NH₃: 5% and 16%, respectively.
Panel 2
De Lauretis R., 2000. Scenarios of emissions of sulfur and nitrogen oxides, volatile organic components and ammonia, in "The implementation process of the Kyoto Protocol in Italy. Methods, scenarios and evaluation of policies and measures", ENEA, 2000 EMEP/EEA air pollutant emission inventory guidebook – 2019 (https://www. eea. europa. eu/publications/emep-eea-guidebook-2019)
ISPRA, 2025. Italian Emission Inventory 1990-2023. Information Inventory Report 2025
ISPRA, De Lauretis R. Et al., 2010. Road transport - National inventory of emissions and provincial breakdown, Reports - No. 124 /2010.
Ministry for the environment and land protection, 2003. National program for the reduction of annual emissions of sulfur dioxide, nitrogen oxides, volatile organic compounds and ammonia, MATT, communication to the EC pursuant to Directive 2001/81/EC.
none
none
Data quality assessment
ISPRA (Italian Institute for Environmental Protection and Research)
Used ISPRA data from the National Inventory of Atmospheric Emissions (http://emissioni. sina. isprambiente. it/interno-nazionale/)
National
1990 - 2023
Indicator assessment
Estimates are made as part of the preparation of the national atmospheric emission inventory.
To assess overall trends, conversion factors into acid equivalents (H⁺) are used, consistent with those adopted by the European Environment Agency.
For air pollutants, the methodology follows the EMEP/EEA Guidebook (2019).
For detailed estimation procedures, refer to the Informative Inventory Report – IIR (https://www.isprambiente.gov.it/it/pubblicazioni/rapporti; https://www.ceip.at/status-of-reporting-and-review-results/2024-submission/)
In 2023, total emissions of the three acidifying substances amounted to 36.8 kt H⁺/year.
In tonnes, this corresponds to 71,858 tonnes of sulphur oxides, 557,421 tonnes of nitrogen oxides, and 382,214 tonnes of ammonia (Tables 1 and 2, Figure 4).
All three substances meet the 2020 reduction targets.
The emissions of the three acidifying substances expressed in acid equivalents have decreased overall from 1990 to 2023 (-72.3%). In 2023 they are distributed as follows: sulfur oxides have a weight of 6.1%, a sharp reduction compared to 1990 (-96%); emissions of nitrogen oxides and ammonia account for 32.9% and 61.0% respectively, both decreasing (-73.8%, -27.8%) but with an increasing relative weight compared to 1990 (Table 2). In reference to the reduction commitments imposed by the legislation, sulfur oxides, already since 2009, with a decrease of 41% compared to 2005 (Figure 1), and ammonia, with a decrease of 7% compared to 2005 (Figure 3), reach the reduction percentage imposed for 2020; while nitrogen oxides reached the reduction percentage set for 2020 in 2014, with a reduction of 41% (Table 1, Figure 2).
Data
Table 1: Emissions of acidifying substances by sector
ISPRA
A – Energy and transformation industries combustion;
B – Non-industrial combustion;
C – Industrial combustion;
D – Production processes;
E – Extraction and distribution of fossil/geothermal fuels;
F – Solvent use;
G – Road transport;
H – Other mobile sources;
I – Waste treatment and disposal;
L – Agriculture;
M – Other (pets).
Emission values updated according to the annual update of the National Emission Inventory.
Table 2: Total national emissions of acidifying substances in acid equivalent
ISPRA
Emission values updated according to the annual update of the National Emission Inventory. Conversion factor to acid equivalents (H⁺/kg): SOx = 31.25; NOx = 21.74; NH₃ = 58.82.
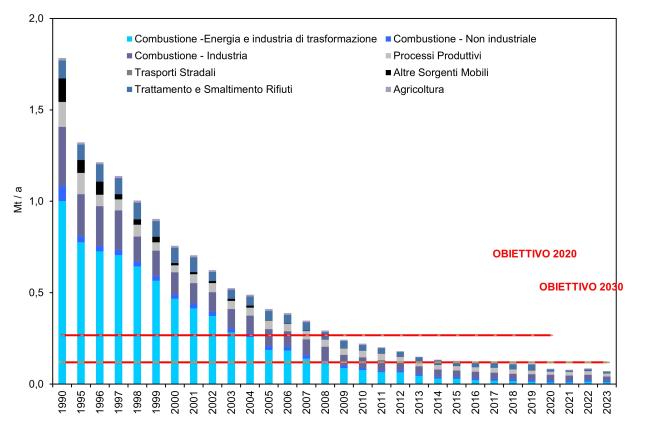
Figure 1: National Emissions of Sulfur Oxides by Sector
ISPRA
The emission values have been updated in line with the annual update of the national emissions inventory.
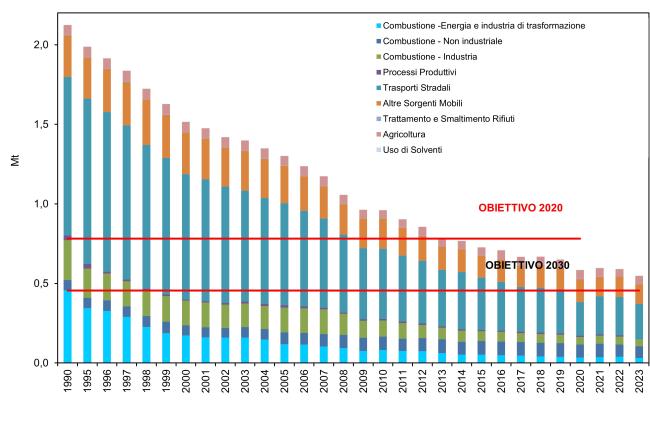
Figure 2: National Emissions of Nitrogen Oxides by Sector
ISPRA
The emission values have been updated in line with the annual update of the national emissions inventory.
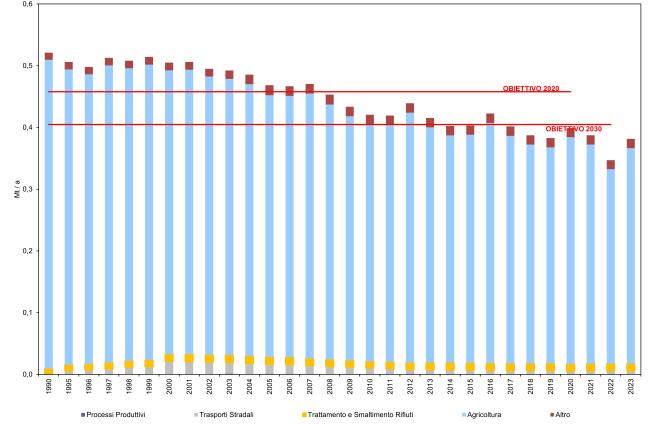
Figure 3: National Emissions of Ammonia by Sector
ISPRA
The emission values have been updated in line with the annual update of the national emissions inventory.
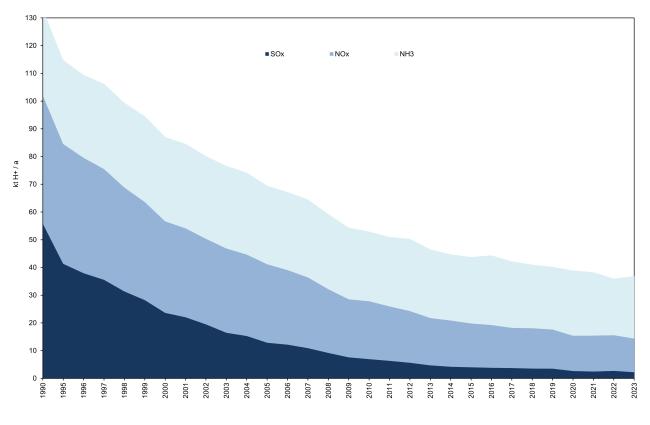
Figure 4: Total National Emissions of Acidifying Substances in Acid Equivalent
ISPRA
The emission values have been updated in line with the annual update of the national emissions inventory. Conversion factor to acid equivalents (H⁺/kg): SOx = 31.25; NOx = 21.74; NH₃ = 58.82.
National emissions are calculated in accordance with the estimation methodology adopted at the European level (EMEP/EEA, 2019). To ensure consistency and comparability of the inventory, the annual update of emissions entails a continuous revision of the entire historical series, based on improved data and methodological updates.
Natural sources (other emission sources and sinks) are excluded from the totals, consistent with the classification adopted in the inventory methodology. Sulphur oxide emissions decreased by about 96% between 1990 and 2023, mainly due to limits on sulphur content in fuels. The road transport sector recorded a 99.7% reduction, accounting for only 0.5% of total national emissions in 2023 (Table 1, Figure 1). Nitrogen oxide emissions fell by 73.8% from 1990 to 2023. Road transport remains a major contributor (40.2% in 2023), despite an overall 77.5% reduction. Non-road transport emissions, while decreasing by 53% since 1990, are the second-largest national source (22.1%). Non-industrial combustion increased by 15.5% since 1990, contributing 13.3%, while industrial combustion and energy transformation account for 7.7% and 5.6%, respectively. Agriculture contributes 8.9%, down by 19.7% since 1990 (Table 1, Figure 2). Ammonia emissions decreased by 27.8% between 1990 and 2023. Agriculture remains the dominant source (91.4%), driving the overall trend (–30.1%). Road transport emissions, despite a temporary increase before 2001, accounted for only 1.4% of the 2023 total. Emissions from waste treatment and disposal increased by 46.7% since 1990, reaching 3.0% of total national emissions in 2023 (Table 1, Figure 3).