Panel 1
Silvia Ermili, Irma Lupica, Francesca Minniti
The indicator measures the quantity of waste sent to mechanical-biological treatment (MBT), which in 2023 amounted to nearly 9 million tonnes. Compared to 2022, an increase of approximately 186,000 tonnes (+2.1%) was observed in the amount of waste treated at MBT facilities. This growth is entirely attributable to the rise in waste classified under Chapter 19 of the European Waste Catalogue (EWC)—waste from waste management facilities, off-site wastewater treatment plants, and water supply treatment for industrial use—originating from the treatment of municipal waste. In contrast, the quantity of mixed (unsorted) municipal waste treated decreased by 1.7% (124,000 tonnes).
Mechanical-biological treatment represents an intermediate phase in municipal waste management and consists of two well-differentiated stages: mechanical treatment, where waste is screened to separate different material fractions, and biological treatment aimed at mineralizing the most degradable organic components and sanitizing the product through pasteurization. The indicator measures the quantity of waste sent for mechanical-biological treatment.
To verify the effectiveness of unsorted municipal waste management methods and identify the final destinations of waste flows produced by mechanical-biological treatment plants, in order to support decision-making processes and environmental policies.
Directive 2008/98/EC and amendments
Legislative Decree No. 152/2006 and amendments
Directive 2018/850/EU
Directive 2018/851/EU
Panel 2
Rapporto Rifiuti Urbani - Edition 2023
Data quality assessment
Single Environmental Declaration Form (MUD); questionnaires submitted to ARPA/APPA and plant operators; ISPRA – Waste Cadastre database (http://www.catasto-rifiuti.isprambiente.it); ISPRA
Nationale, Regional
2000-2023
Indicator assessment
Information regarding treatment facilities, waste types, and the quantities of municipal waste managed is acquired through the MUD database and specific questionnaires sent to regional and provincial environmental protection agencies and plant operators. The indicator's construction follows various phases to qualify and quantify the waste treated and produced by mechanical/mechanical-biological treatment plants, by analyzing and comparing available information. Besides quantifying the waste produced by these plants, the subsequent waste treatment operations are identified.
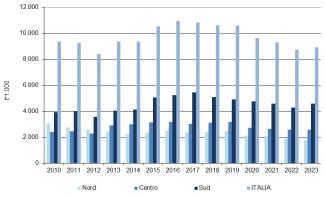
The quantity of waste sent to mechanical-biological treatment (approximately 9 million tonnes) in 2023 shows a 2.1% increase compared to the previous year (Table 1 and Figure 1). This rise is entirely attributable to the increase in waste classified under Chapter 19 of the European Waste Catalogue (EWC), originating from the treatment of municipal waste. Meanwhile, the amount of unsorted (mixed) municipal waste treated declined by 1.7% (124,000 tonnes).
Between 2000 and 2019, the quantity of waste treated at mechanical-biological treatment (MBT) facilities more than tripled, reflecting a significant upward trend. However, this trajectory reversed in 2020, with a decline in total treated volumes linked to the reduction in municipal waste generation caused by the COVID-19 (SARS-CoV-2) pandemic. Over the subsequent three-year period (2020–2023), this downward trend continued, with a cumulative decrease of 7.2% (Table 1).
Data
Table 1: Waste entering mechanical-biological treatment plants
ISPRA
Table 2: Mechanical-biological treatment of municipal waste, by region
ISPRA


In 2023, approximately 9 million tonnes of waste were processed at aerobic mechanical-biological treatment (MBT) facilities (Table 1, Figure 1). Of the total treated, 78.4%—around 7 million tonnes—consisted of unsorted municipal waste. An additional 16.4% (over 1.4 million tonnes) derived from waste classified under Chapter 19 of the European Waste Catalogue (waste from municipal waste treatment processes). A further 1.9% (approximately 167,000 tonnes) comprised other municipal waste fractions, including paper, plastics, metals, wood, glass, and organics from separate collection. Finally, 3.3%—equivalent to 292,000 tonnes—were special waste streams originating from industrial sectors such as agri-food and wood processing (Table 2).
Regionally, over 1.7 million tonnes were treated in Northern Italy, marking a 7.8% decrease (around 149,000 tonnes) compared to 2022. In Central Italy, approximately 2.6 million tonnes were treated, showing a modest increase of over 18,000 tonnes (+0.7%). Southern Italy treated around 4.6 million tonnes, reflecting a significant increase of more than 316,000 tonnes (+7.4%) compared to the previous year (Table 1, Figure 1).
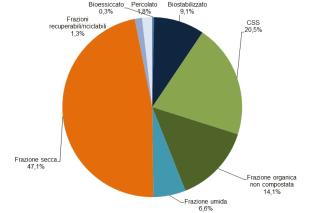
The output from MBT facilities in 2023 totalled over 8.1 million tonnes and was composed primarily of dry fraction (47.1%, or over 3.8 million tonnes). This was followed by Solid Recovered Fuel (SRF), accounting for over 1.6 million tonnes (20.5%), and non-composted organic fraction, with more than 1.1 million tonnes (14.1%). Biostabilized waste contributed just over 740,000 tonnes (9.1%), and the wet fraction over 474,000 tonnes (5.8%). Additional outputs included materials recovered for recycling—such as paper, plastics, metals, wood, and glass—amounting to approximately 106,000 tonnes (1.3%); bio-dried waste, totalling 27,000 tonnes (0.3%); and leachate, approximately 149,000 tonnes (1.8%) (Figure 2).