Panel 1
Costanza Mariotta; Jessica Tuscano
After the 2.1% drop observed in the previous two-year period 2021-2022, in 2023 the overall production of Waste from Economic Activities generated by the national production system (industrial, commercial, artisanal, services, but also of waste treatment and environmental remediation) returns to increase attesting to almost 164.5 million tons (+1.9% compared to 2022, corresponding to more than 3 million tons).
Non -hazardous waste, which represent 93.8%of the total waste produced, have an increase of 2.8 million tons (+1.9%), the dangerous ones of 193 thousand tons (+1.9%).
With regard to the construction sector, the incentives arranged by the government for the renovation of the properties aimed at the energy redevelopment of buildings have continued. These construction/renovation works together with the activities of construction sites intended for the construction of infrastructure and public works and housing and commercial construction have generated more quantities of building and demolition waste.
The indicator measures the total amount of Waste from Economic Activities generated in Italy. The information is provided disaggregated compared to the following types of waste: hazardous waste, non -hazardous waste and construction and demolition waste. The articulation for economic activity is also presented.
Measuring the total amount of Waste from Economic Activities produced and evaluating the impacts of economic activities, including those of waste treatment and environmental recovery, supporting decision -making processes and environmental policies in the adoption of the relative strategies.
Directive 2008/98/EC;
Legislative Decree 152/2006 and subsequent amendments;
Legislative Decree 205/2010;
Directorial Decree 7 October 2013 - Adoption and approval of the national waste prevention program (G. U. 18 October 2013, n. 245). The national waste prevention program (Directorial Decree 7 October 2013) sets the following prevention objectives on 2020, compared to the values recorded in 2010:
- 10% reduction in the production of Waste from Economic Activities dangerous for GDP units
- 5% reduction in the production of Waste from Economic Activities non -dangerous waste per unit of GDP. Based on new data relating to the production of Waste from Economic Activities, this objective can be reviewed.
L 221 of 28/12/2015.
Decision 2000/532/EC.
Legislative Decree no. 4/2008.
Waste from Economic Activities is identified in article 184, paragraph 3 of Legislative Decree 152/2006 and subsequent amendments. The aforementioned legislative decree reiterates the inspiring principles of the European hierarchy which provide for the following order of priority:
- prevention
- preparation for reuse
- recycling
- other recovery, for example the recovery of energy
- disposal.
Panel 2
ANPA - Onr, 1999, The ANPA system of waste accounting - first data processing
ANPA - Onr, 2001, first report on special waste
ANPA - Onr, waste report, 2001-2007
ISPRA, 2008 waste report
ISPRA, Special waste report, 2009-2025 editions
The production data of Waste from Economic Activities is available at national, regional and provincial level from 1997 to 2005, and at national and regional level for the years from 2007 to 2009. The 2006 figure is, instead, available only aggregate on a national scale, due to the regulatory changes introduced by Legislative Decree no. 152/2006 which led, for that year, a substantial reduction in the information coverage rate by the MUD databases. This reduction made the use of esteemable procedures that can only be implemented only on a national scale. Paragraph 3 of art. 189 of Legislative Decree no. 152/2006, in fact, initially exempted all the producers of non -hazardous waste from the obligation to declare with a substantial repercussion on the declarations, relating to the 2006 data, carried out in 2007. Except for the totally exonerated sectors, the obligation to declare was partially reintroduced with Legislative Decree no. 4/2008, limited to non -hazardous waste manufacturers with a number of employees greater than 10. In order to reach an assessment of the quantities of special non -hazardous waste produced in 2006 (in the absence of sufficient coverage of the Mud databases relating to this type of waste), therefore, the use of special estimation methodologies, based on determination, for the different industrial sectors, of specific coefficients of specifics, has been made necessary production, derived from sector studies conducted by ISPRA.
With reference to hazardous waste, we also report that new exemptions have been introduced by the obligation of the MUD declaration for specific categories, pursuant to article 69, paragraph 1 of the law of 28 December 2015, n. 221 "Environmental provisions to promote Green Economy measures and for the containment of excessive use of natural resources". In consideration of the exemptions provided for by the current regulation, therefore, starting from the 2015 data, the production of hazardous waste was quantified by integrating the information contained in the MUD database, with estimates carried out for the agriculture sector only. The current information acquisition mechanism does not allow you to make data available to a certain year before the end of the following year.
Data quality assessment
ISPRA
Use the information contained in the database of the annual environmental declarations (MUD) made by the subjects obliged pursuant to current legislation, integrated by the quantities estimated by Ispra, not accessible to the public. The production data of , dangerous and non-dangerous waste from Economic Activities, at regional level, for economic and chapter activities of the European Waste list can be consulted on the website of the Waste Cadastre, at the address: www. catasto-rifiuti. isprambiente. it
National
1997-2023
Indicator assessment
The indicator measures the total amount of Waste from Economic Activities generated in Italy. The information is provided disregarded with respect to the different types of refusal, i. e. Special dangerous waste, non -hazardous waste and waste deriving from construction and demolition activities. The articulation for economic activity is also presented. The production data of special non -hazardous waste, relating to the year 2006 and, in part, to the years from 2007 to 2023 have been integrated through special estimation methodologies, as well as those relating to the production of dangerous special waste relating to the years from 2015 to 2023.
The information base consists of the environmental declarations (MUD) presented annually by the subjects obliged pursuant to art. 189 of Legislative Decree 152/2006. The information taken from the MUD database has been integrated with the quantities estimated through the application of specific methodologies for some production sectors which, pursuant to current legislation, are entirely or partially exempt from the obligation to declare. It should be noted that some sector studies have been updated taking into account that many materials, first classified as waste, are currently qualified as by -products pursuant to current legislation. For this reason, the estimates relating to food industry and drinks since 2011 has been updated in particular.
In 2023, national production of waste generated by economic, industrial, and manufacturing activities increased by 1.9% compared to 2022, corresponding to more than 3 million tonnes.
Italy has a historical data series on production of Waste from Economic Activities from 1997 to 2023, which highlights a strong upward trend. Specifically, a significant increase in production was recorded between 1997 and 2006, followed by more moderate growth until 2008. Between 2008 and 2009, due to the severe economic and financial crisis affecting the country, Waste from Economic Activities quantities contracted (-5.7%). In 2010, national production of Waste from Economic Activities resumed growth (+1.8%).
Between 2011 and 2017, production showed a fluctuating pattern: between 2011 and 2013 it decreased by 4.3%, mainly due to the reduction in non-hazardous waste from construction and demolition activities, while between 2013 and 2014 it increased again (+4%), returning to 2011 levels. Growth continued in 2014–2015 (+2.4%) and 2015–2016 (+2%). In particular, the trend in Waste from Economic Activities production confirmed steady growth in the last five-year period 2015–2019 (+16.3%), in line with socio-economic indicators.
In 2020, production fell by 4.5% compared to 2019, corresponding to nearly 7 million tonnes, before rising again in 2021 (+12.2%). In 2022, influenced by the delicate international geopolitical context, a decrease was recorded (-2.1%), while in 2023 production rose again (+1.9%) (Table 1 and Figure 1).
Data
Table 1: Production of total Waste from Economic Activities
ISPRA
a Partially estimated data; b Estimated data; c Includes quantities of Waste from Economic Activities originating from the treatment of municipal waste.
Table 2: Generation of special waste by economic activity (NACE sector)
ISPRA
a Dati parzialmente stimati; b inclusi i quantitativi di rifiuti speciali non pericolosi provenienti dal trattamento di rifiuti urbani
RS = Special waste;
RSP = Hazardous special waste;
RSNP = Non-hazardous special waste
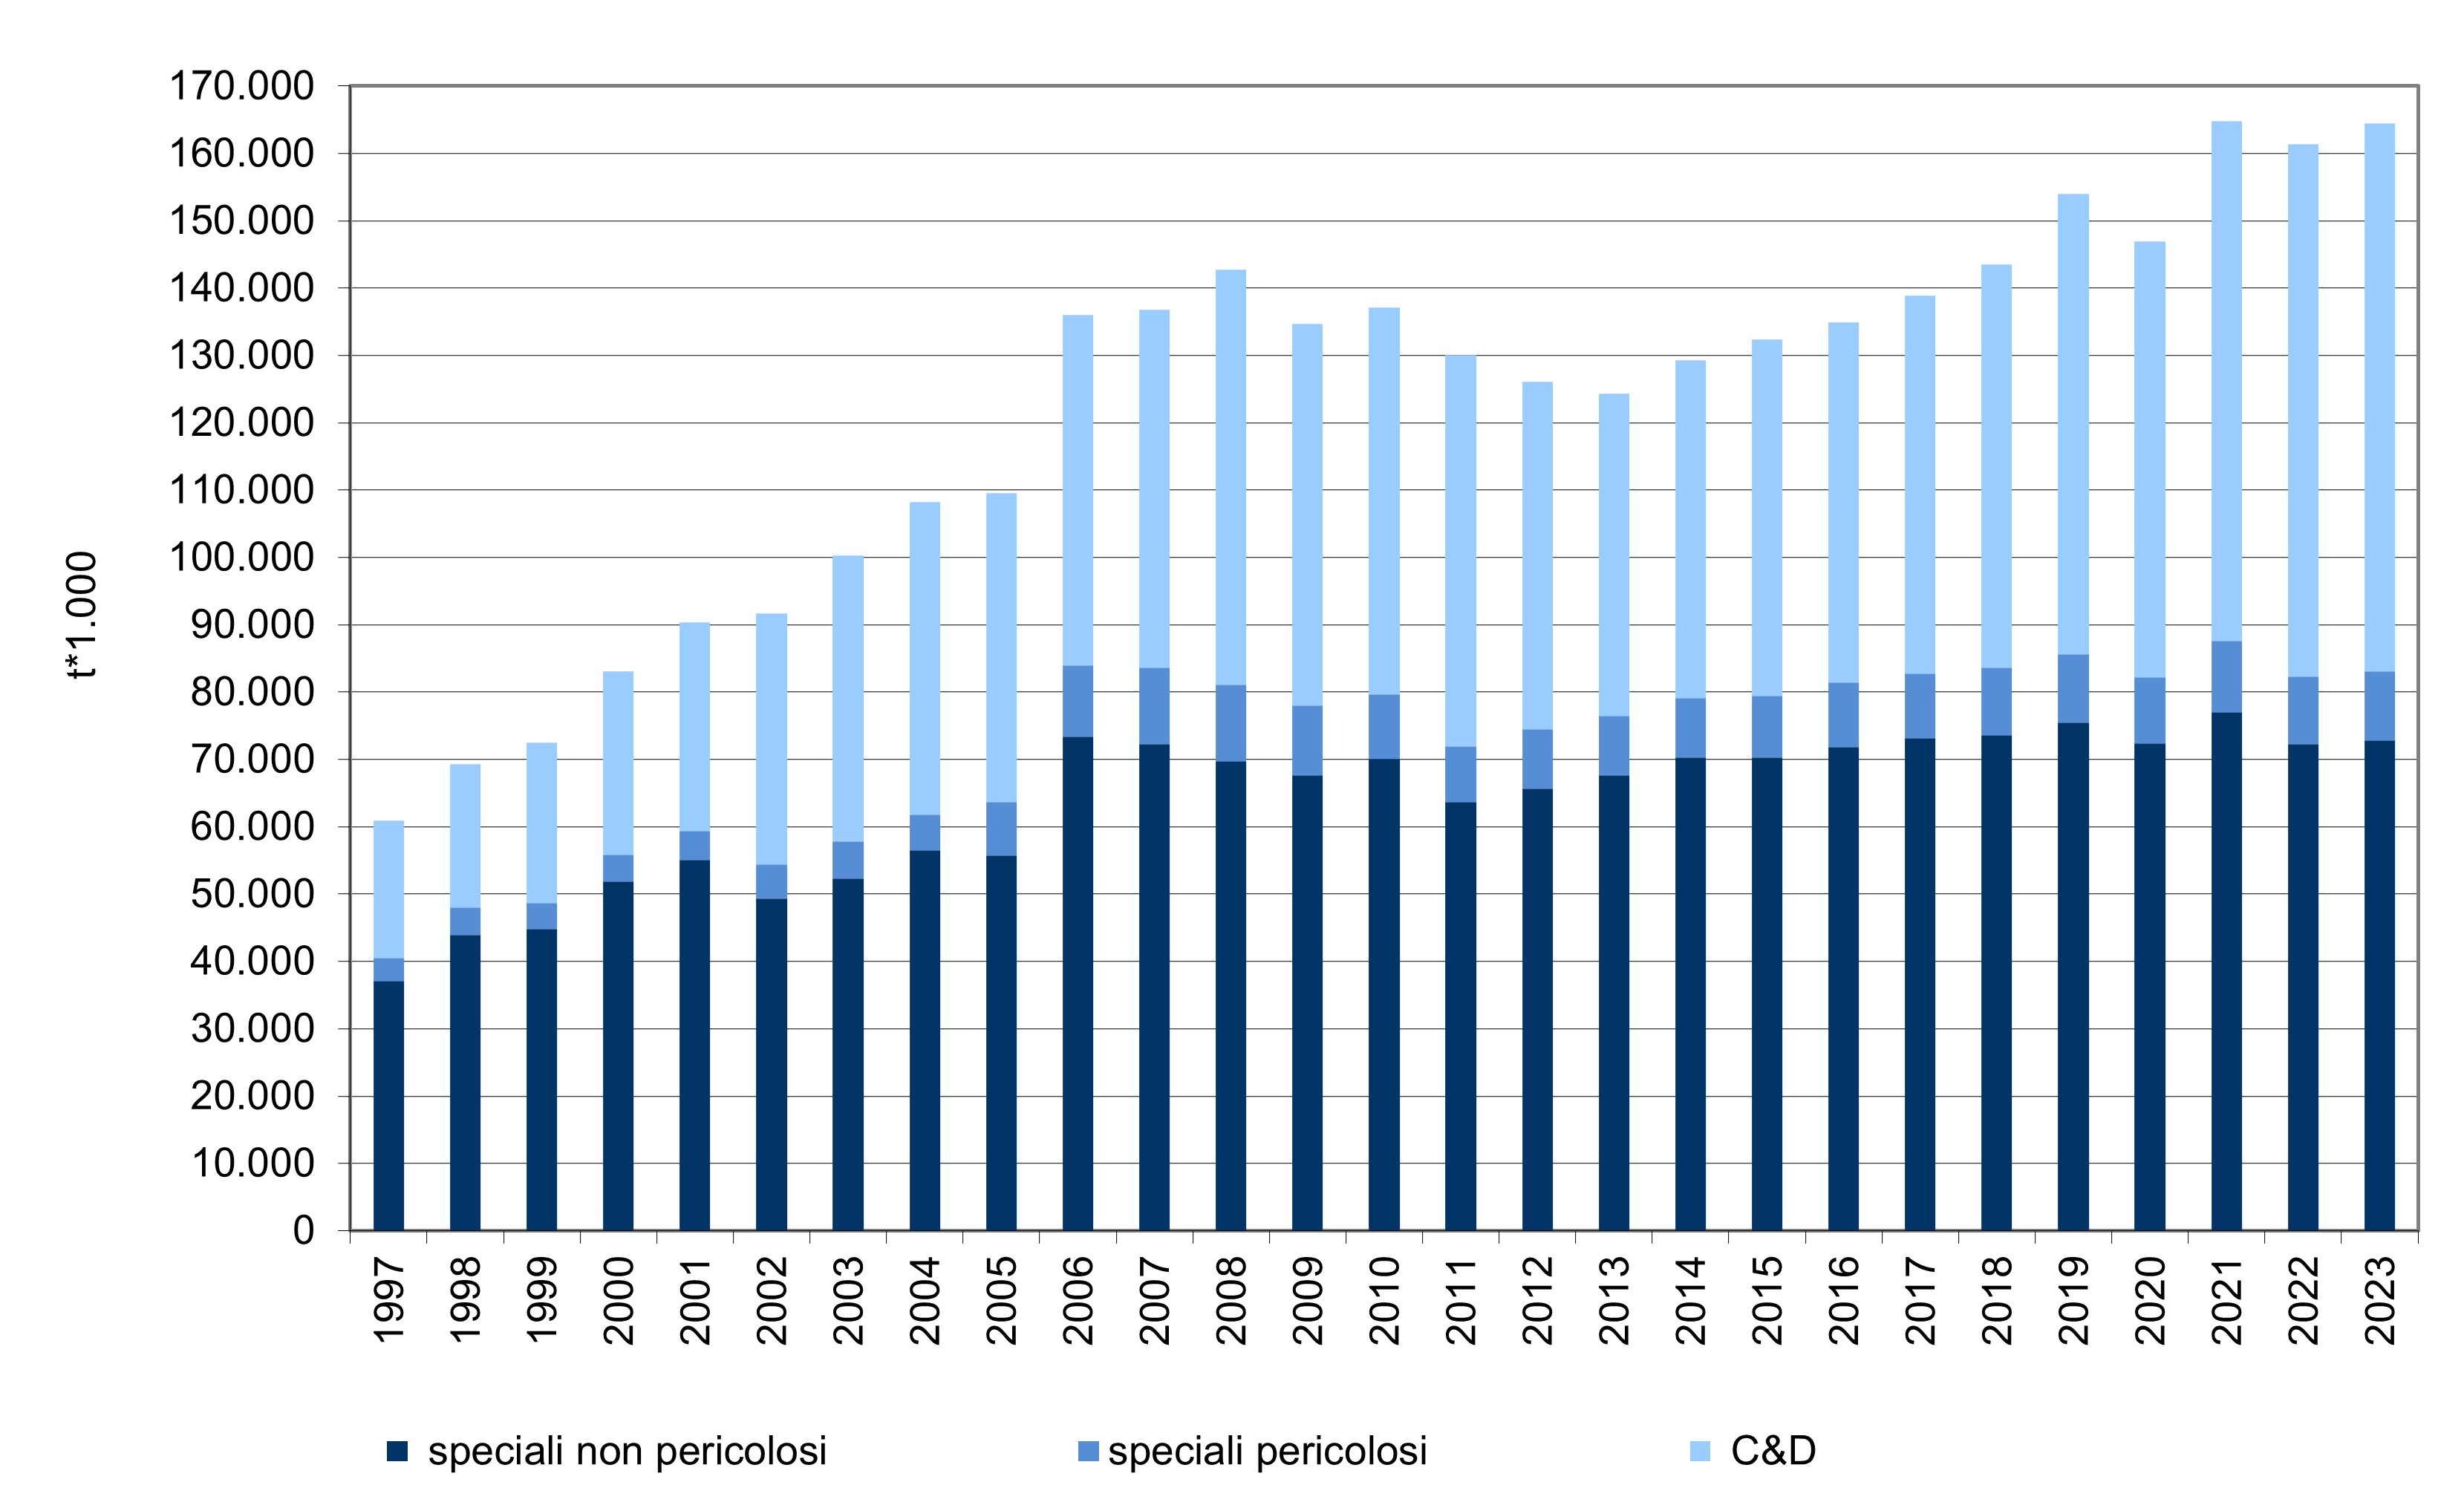
Figure 1: Trend in the total production of Waste from Economic Activities
ISPRA
In 2023, national production of Waste from Economic Activities generated by the domestic production system (industrial, commercial, artisanal, and service activities, as well as waste treatment and environmental remediation) increased again, similarly to what was observed for municipal waste, reaching nearly 164.5 million tonnes (+1.9% compared to 2022, equivalent to more than 3 million tonnes). Non-hazardous waste, representing 93.8% of the total waste generated, rose by 2.8 million tonnes (+1.9%), while hazardous waste increased by 193 thousand tonnes (+1.9%).
With regard to the construction sector, government incentives for building renovations aimed at improving energy efficiency continued. These construction and renovation works, together with activities at sites for the construction of infrastructure, public works, and residential and commercial buildings, generated higher amounts of construction and demolition waste.
The analysis of data by economic activity (according to the ATECO 2007 classification) shows that the largest contribution to overall special waste generation came from the construction and demolition sector (ATECO 41–43), which, with about 83.3 million tonnes—including waste from construction and demolition operations as well as other waste from such activities (e.g. packaging waste, used oils, etc.)—accounted for 50.6% of the total generated. Waste treatment and environmental remediation activities (ATECO 38 and 39) contributed 23.5% (38.7 million tonnes), while manufacturing activities (ATECO 10–33) accounted for 16.8% (about 27.7 million tonnes). Other economic activities collectively contributed 9.1% (nearly 14.8 million tonnes) to the generation of special waste (Table 2).