Francesca Assennato, Marco Di Leginio, Nicola Riitano, Andrea Strollo

The sequestration and storage of carbon constitute a regulatory service provided by various terrestrial and marine ecosystems due to their ability to capture greenhouse gases. This capacity varies in magnitude depending on the natural state of the ecosystem considered. This service contributes to global climate regulation and plays a crucial role in climate change mitigation and adaptation strategies. Among all terrestrial ecosystems, natural and semi-natural forests have the highest carbon sequestration potential. In the soil pool, in particular, organic carbon accounts for approximately 60% of the organic matter present and performs an essential positive function on many soil properties. Based on the mapping carried out within the GSP (Global Soil Partnership - GSOC map) for the soil reservoir, data from the National Inventory of Forests and Carbon Reservoirs (INFC), and information on land cover and soil consumption from ISPRA cartography, this indicator provides an estimate of the quantities of Soil Organic Carbon contained in the four pools of Italian soils and the variation determined by soil consumption during the periods 2012-2020 and 2012-2021. The estimated stock for 2012 was over 2.6 billion tons, a value that by 2021 had been reduced by over 3.2 million tons, with a continuous decline and an increasing annual loss rate in eight out of twenty regions.
The Soil Organic Carbon and Impact of Soil Consumption indicator provides information on the content of organic carbon (OC) in terrestrial ecosystems and the impact of soil consumption on the stock. The estimate of the total stock of organic carbon (OC) in terrestrial ecosystems is provided as an aggregate value for the four reservoirs (pools): aboveground biomass, belowground biomass, soil, and dead organic matter, based on specific estimates for each pool. It also represents the stock variation over time determined by soil consumption (conversion of land cover from natural or semi-natural to artificial), based on land cover change monitoring. The effect of soil consumption is assumed to result in a complete depletion of organic carbon content in all four reservoirs. The indicator evaluates the stock for the year 2012 and the variation up to 2020 and 2021, along with the trend represented in terms of the period's average value.
To describe the amount of organic carbon (OC) contained in the four terrestrial ecosystem carbon reservoirs (aboveground biomass, belowground biomass, soil, and dead organic matter) and the impact of soil consumption on the overall stock, allowing for temporal and spatial comparisons to support decision-making processes.
The current legislation does not establish any limits or regulations on the quantity of organic carbon in the soil. However, the new Soil Strategy (2021) outlines several urgent actions to combat desertification, restore degraded lands, and achieve land degradation neutrality. These include the restoration of carbon-rich ecosystem surfaces, achieving net-zero soil consumption, and protecting the ecosystem function of soil as a major carbon reservoir. The crucial role of organic matter in soil functionality is also recognized in various Common Agricultural Policy programs and Rural Development Plans, which generally include measures aimed at maintaining and/or increasing soil organic matter.
- FAO, 2018 - Global Soil Organic Carbon Map. Technical Report
- Munafò, M. (ed.), 2022. Land Soil , Territorial Dynamics, and Ecosystem Services. 2022 Edition. SNPA Report 32/22.
- European Commission, 2021 - COM/2021/699 final
- National Inventory of Forests and Carbon Reservoirs (INFC, 2005)
In the absence of a national monitoring network for soil organic carbon stock, the available information for this reservoir is affected by non-synchronous data and by the different laboratory procedures used to determine organic carbon content. Moreover, no updates on land cover are currently available beyond 2018, nor are there recent data on the distribution of organic carbon across forest types from the National Forest Inventory (INFC) after 2015. These limitations hinder a timely assessment of the carbon stock and reduce the accuracy of evaluating changes in individual reservoirs caused by restoration actions or recent impacts.
There is a clear need to harmonize regional information on Soil Organic Carbon (SOC) content through the establishment of a national monitoring network. This network should provide spatially and temporally well-distributed data on the soil reservoir, based on time series suitable for the purpose and using standardized procedures for carbon content determination. The overall knowledge framework can also be significantly improved by integrating forest-related information on species distribution and growth parameters. However, these data are updated less frequently than land cover maps, limiting the timely revision of estimates.
- ARPAV (Arpa Veneto)
- CNR
- CREA (Council for Agricultural Research and Analysis of Agricultural Economics)
- ISPRA
- Regional Authorities
- SNPA (National System for Environmental Protection)
http://54.229.242.119/GSOCmap/ (Global Soil Partnership, 2018) http://groupware.sinanet.isprambiente.it/uso-copertura-e-consumo-di-suolo/library/consumo-di-suolo
National / Regional
Stock data available for 2012, with variations available for 2020 and 2021.
The carbon stock in the four reservoirs is estimated based on land use/land cover typologies, as available for the year 2012 (ISPRA Land Cover Map), and the changes caused by soil consumption during the period 2012–2021 (ISPRA Soil Consumption Map).
The indicator accounts for both the total variation over the entire period (i.e., since 2012) and the trend of the most recent year, in terms of the change in the period's average value. Furthermore, as an indicator of the level of loss, the average loss of the last year is expressed as a proportion of the initial stock (year 2012).
The indicator provides information on the organic carbon (OC) content in terrestrial ecosystems, starting from the data on soil organic carbon derived from the National Organic Carbon Map developed in 2018. The national processing of organic carbon data was conducted using Digital Soil Mapping techniques (neural networks with Radial Basis Function), applied to a selection of approximately 6,700 representative soil profiles, selected by regional authorities and collected between 1990 and 2013.
A series of categorical covariates (geology, geomorphology, land use, and thematic soil layers) and continuous covariates (DEM, climatic data, and soil properties) were also selected. The various analytical methods used (Walkley-Black, Springer-Klee, and Elemental Analyzer) were harmonized, and pedotransfer functions were developed to estimate bulk density.
For the Po Valley, the distribution of pedo-landscapes was also considered, derived from the ecopedological map at 1:250,000 scale.
For the other reservoirs, the estimation is based on information from the National Inventory of Forests and Forest Carbon Stocks (INFC, 2005), and specific coefficients for the different reservoirs were identified through literature sources (Sallustio et al., 2015), as well as for different land cover classes (Vitullo et al., 2007; ISPRA, 2014; Di Cosmo et al., 2016).
The estimation of the total stock across the four soil-related carbon reservoirs, and the assessment of the impacts of soil consumption on soil organic carbon stock, is conducted using a simplified model of the carbon cycle. In particular, the quantity of carbon is considered constant over time, with the only variable being land cover; carbon transfers between pools are not considered.
Based on these data, the carbon content associated with each land cover class and the sum of the four reservoirs across the national territory is characterized through spatial analysis in a GIS environment, using as reference the land cover/use maps (CUS) proposed by the National System for Environmental Protection (SNPA) (Munafò M., 2022), available for the years 2012 and 2018.
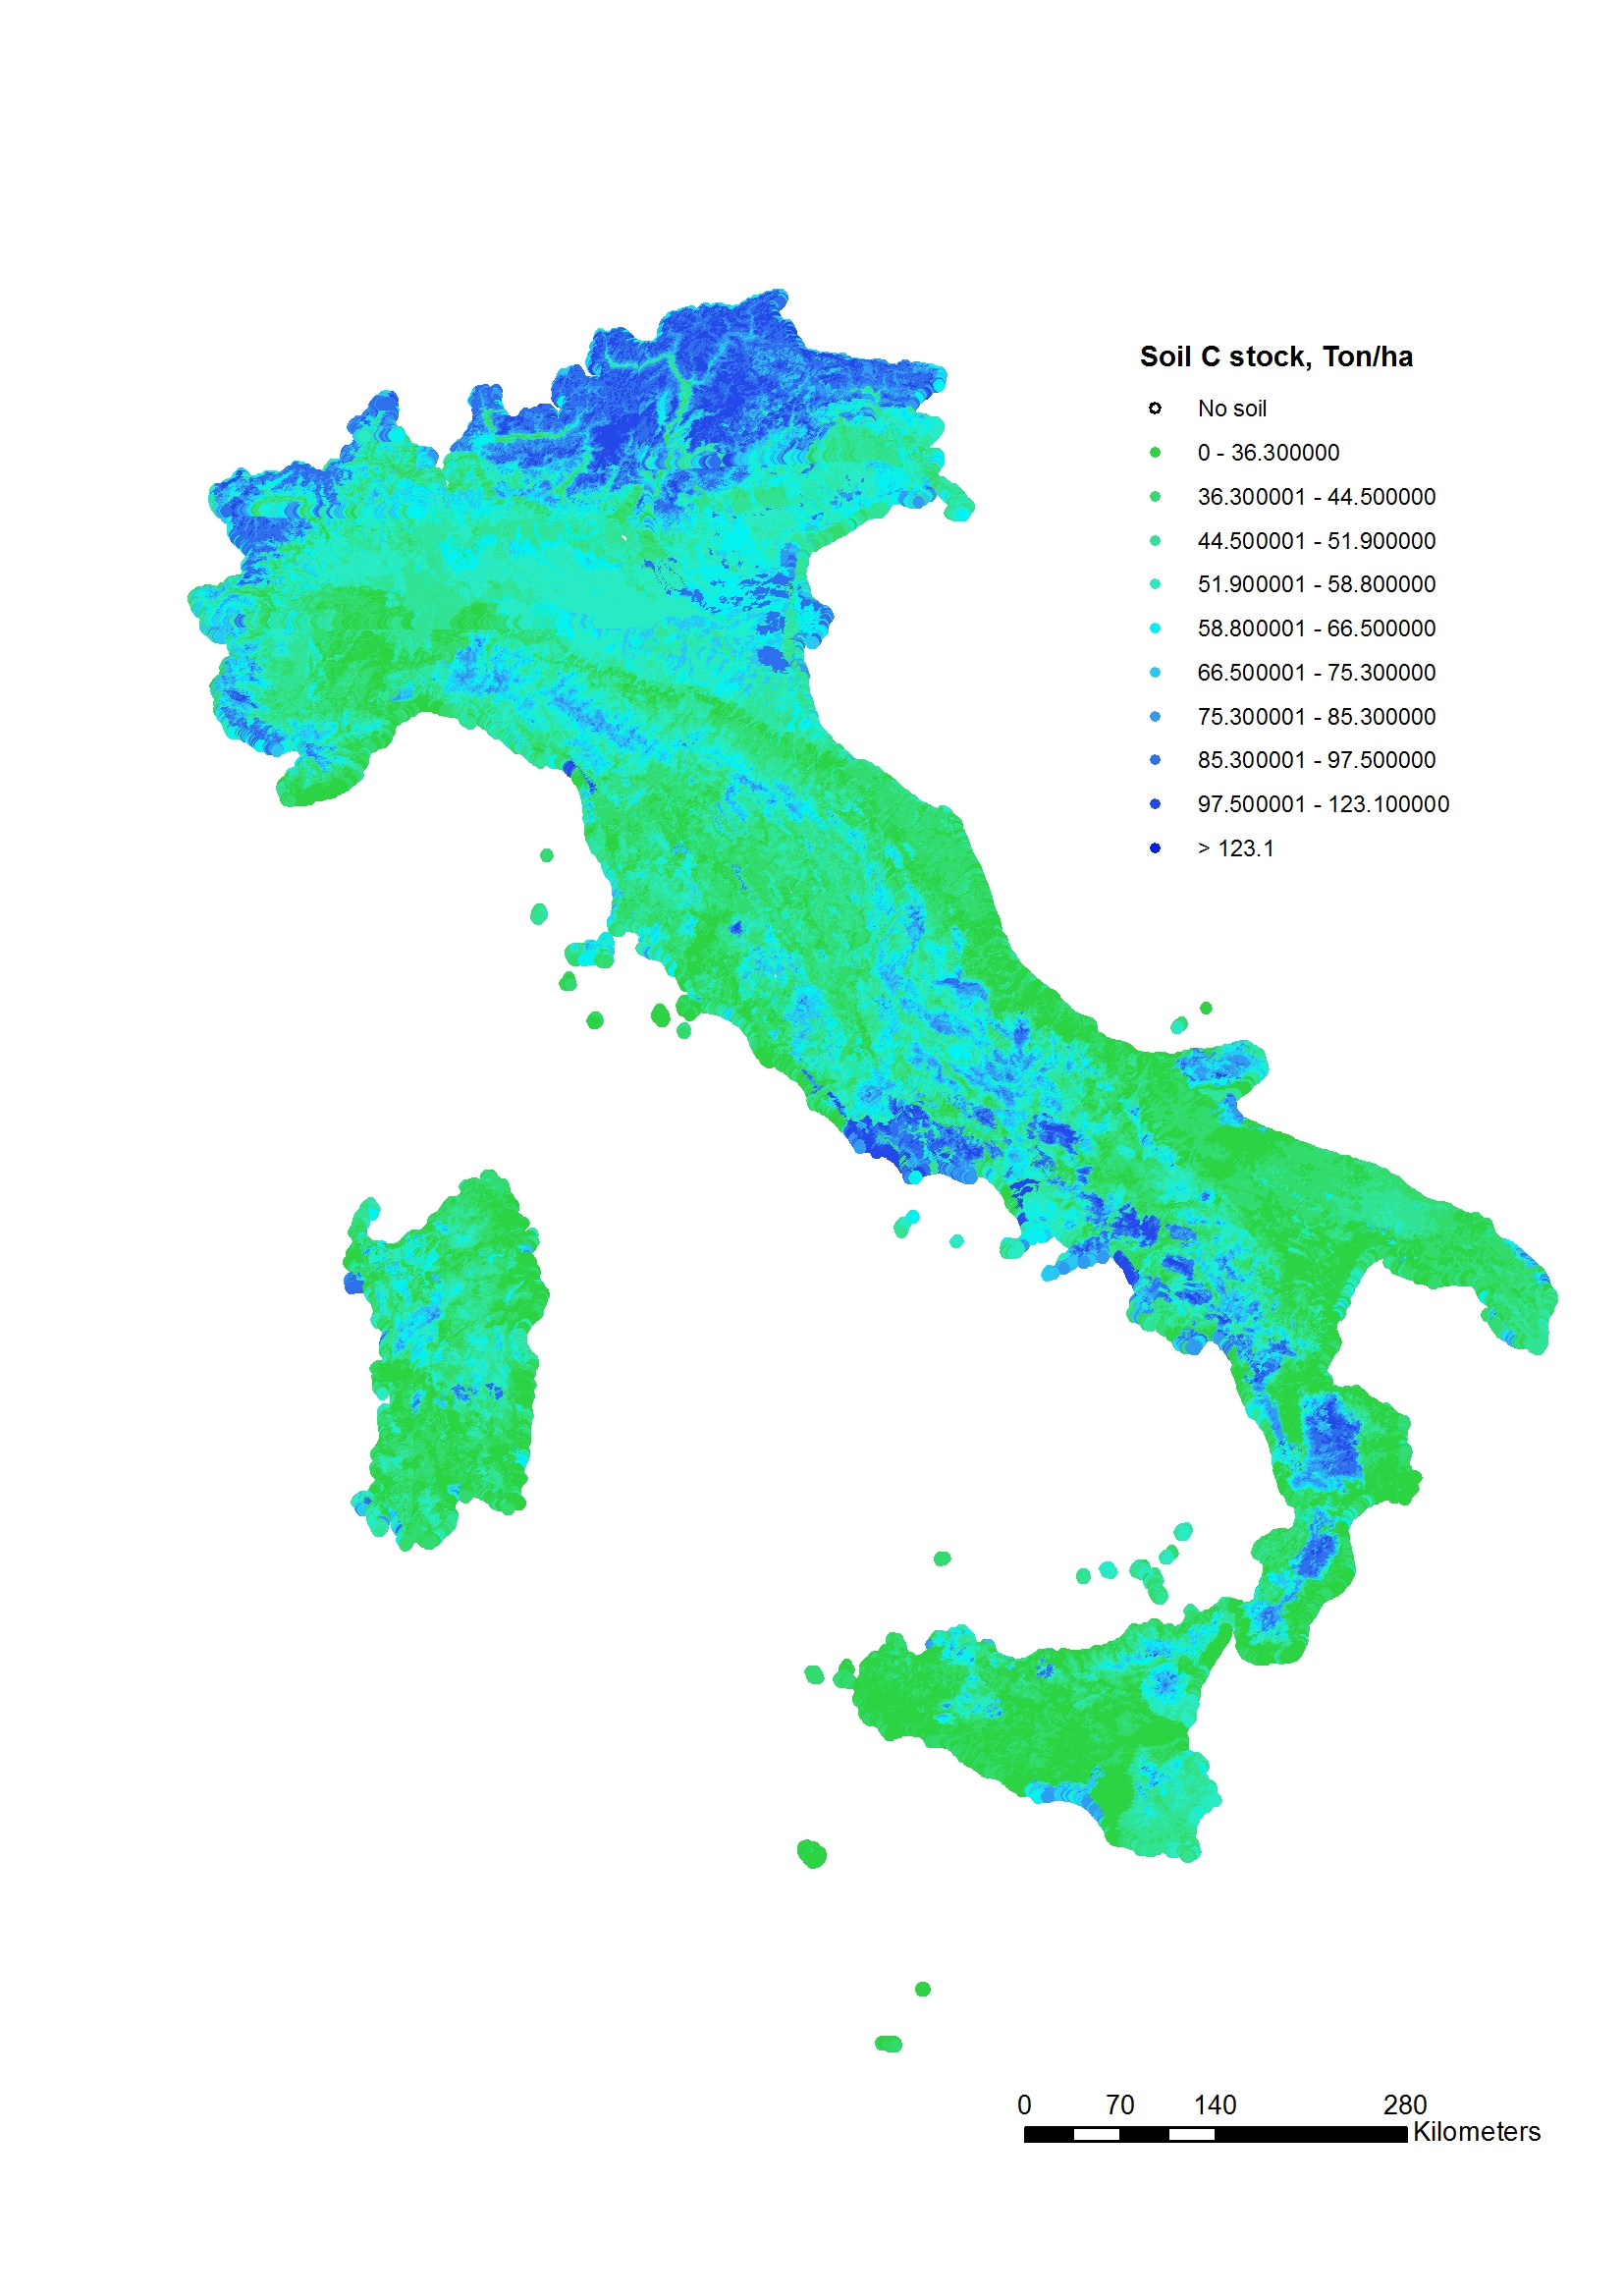
It is not possible to assess the current status due to the absence of reference data for comparison. However, relevant information is provided regarding the variability of soil organic carbon content as a function of pedogenetic factors (geology, climate, vegetation). The national cartography from 2018 (Figure 1) highlights the strong correlation between organic carbon content and selected covariates: higher values are observed in the Alpine and Apennine regions, in areas generally characterized by higher naturalness, predominantly calcareous lithologies, and non-mountainous forested zones. Conversely, lower values are found in coastal areas, valley floors, and urbanized plains, which are typically associated with higher temperatures, clay-rich lithologies, and agricultural land use.
The final results (Figure 1) are represented on a 1 km grid, illustrating the national-scale distribution of total organic carbon accumulation in the soil reservoir (top 30 cm), estimated at 2.56 billion tons.
The trend in the impact of soil consumption represents the variation in total organic carbon stock in the four soil-related reservoirs, assessed against the 2012 baseline. The trend is negative, with stock reductions of 2.9 million tons in 2020 and 3.3 million tons in 2021. The comparison of annual averages for the periods 2012-2020 and 2012-2021 provides insight into the rate of loss. Despite the overall negative trend (2012-2021), between 2020 and 2021, the annual mean loss increased, exceeding 363,000 tons in 2021, with significant regional variations. The most substantial increases in annual loss were observed in Lombardy, Emilia-Romagna, and Campania, where soil consumption intensified in the last year, while the annual loss rate slowed in Veneto, Sicily, and Puglia. Compared to the 2012 stock, the highest losses in 2021 occurred in Veneto, Lombardy, and Emilia-Romagna.
| Data |
|---|
Thumbnail
Headline
Figure 1: Organic Carbon Content in the top 30 cm of Soil (t/ha) Data source
FAO - Global Soil Partnership |
Headline
Table 1: Change in Soil Organic Carbon Stock, 2012–2021 Data source
ISPRA processing based on ISPRA and FAO–Global Soil Partnership data Data legend
In the “trend” column, green indicates a slowdown in the loss trend, whereas red indicates an increase in soil organic carbon loss. |
Thumbnail
Headline
Figure 2: Change in Average Annual Soil Organic Carbon Loss, 2012–2021 Data source
ISPRA processing based on ISPRA and FAO–Global Soil Partnership data |
The national mapping of soil organic carbon represents Italy's contribution to the global map developed within the framework of the Global Soil Partnership (GSP), established under the FAO.
The distribution of organic carbon in the topsoil layers of Italian soils (Figure 1) highlights a differentiated accumulation of organic carbon within the upper 30 cm of soil. Sicily, Sardinia, Valle d’Aosta, and Apulia emerge as the regions with the lowest average organic carbon content. This is particularly evident in agricultural areas (such as vineyards, orchards, and olive groves), which are the most disadvantaged in terms of stored carbon, in contrast with forested areas, which exhibit the highest levels.
The impact of soil consumption on total carbon stock reveals that nearly 3 million tonnes of organic carbon have been lost in just nine years (Table 1), with regionally varying values (Figure 2).
In 2021, the regions showing an increase compared to the previous year include Campania, leading with an annual gain of 3,200 tonnes, followed by Lombardy, Piedmont, and Abruzzo, with increases ranging between 1,800 and 1,300 tonnes. Notable decreases were recorded in Trentino-Alto Adige and Calabria, both with average annual losses exceeding 1,750 tonnes compared to the previous monitoring period (Table 1).