Gabriele Bellabarba, Francesca Sacchetti
High noise levels can affect your well-being. The effects of noise on health include stress, reduction of psychological well-being and sleep disturbances, but also cardiovascular problems.
In the field of noise pollution management, with the issuing of Directive 2002/49/EC, the European Union has defined a common approach to avoid, prevent or reduce the harmful effects of the population's exposure to environmental noise. The approach is based on the determination of exposure to environmental noise, on public information and on the implementation of Action Plans at local level. The population exposed to noise is determined through acoustic mapping, developed on the basis of common and shared methods.
From the acoustic mapping, the population exposed to noise levels higher than the levels recommended by the WHO is high. Road traffic represents the main source of noise.
The indicator reports the studies carried out in urban areas on the population exposed to noise prepared according to Directive 2002/49/EC, implemented in Italy with Legislative Decree 194/2005, and, for each study, the estimated number of people exposed to noise, expressed in the indicators Lden and Lnight, produced by the various sources present (roads, railways, airports and industries).
Studies on the population exposed to noise produced by airport infrastructures are also reported.
The indicator also reports the aggregate data of the population exposed to noise produced by road, rail, airport traffic and industries. The data relates to the transport infrastructures and agglomerations that presented the 2007, 2012 and 2017 noise mapping pursuant to Directive 2002/49/EC and Legislative Decree 194/2005.
Evaluate the extent of the population exposed to noise, highlighting which noise sources have the most impact.
Italy has implemented Directive 2002/49/EC (END Directive), relating to the determination and management of environmental noise, with Legislative Decree 194/2005. The END Directive defines skills and procedures for the development of noise mapping of transport infrastructures and strategic noise maps of agglomerations, as tools for diagnosing noise exposure levels in the area, and for the development and adoption of Action Plans, aimed at preventing and reducing noise pollution, also through information and public participation, where high noise levels can cause harmful effects on health. Among the objectives of the END Directive is the collection of information on the state of exposure to noise of the population with homogeneous and shared methods and criteria, in order to make them comparable in time and space. The Directive defines timing and criteria for the presentation and drafting of noise mapping and action plans, introducing the acoustic descriptors Lden and Lnight. In particular, the Directive set 30 June 2007 as the deadline for the submission of strategic noise maps of agglomerations with more than 250,000 inhabitants and noise maps of road infrastructures with more than 6,000,000 vehicles per year, railway infrastructures with more than 60,000 trains per year and airports where more than 50,000 movements take place per year. (main airports), and on 30 June 2012, and subsequently every 5 years, the deadline for the presentation of strategic noise maps of agglomerations with more than 100,000 inhabitants and of noise maps of road axes with more than 3,000,000 vehicles per year (main road axes), of railway axes with more than 30,000 trains per year (main railway axes) and of main airports. The Ministry of the Environment collects the information produced at national level and is responsible for communicating the data to the European Commission.
The World Health Organization (WHO) recommends reference values for noise in outdoor environments, in order to avoid population disturbance phenomena (annoyance) and possible damage to health; in particular in the document "Night Noise Guidelines (NNG)", the WHO recommends maintaining, in order to protect public health, a Lnight level, in an external environment, lower than 40 dB(A) and in any case not higher than 55 dB(A).
World Health Organization (WHO), 2018, Environmental Noise Guidelines for the European Region
CEDR, 2013, Best practices in strategic noise mapping
UNI/TS 11387:2010, Guidelines for noise mapping and strategic noise mapping
World Health Organization (WHO), 2009, Night Noise Guidelines for Europe WG-AEN, 2007, Good Practice Guide for Strategic Noise Mapping and the Production of Associated Data on Noise Exposure
--
--
ARPA/APPA (Regional Agencies and Autonomous Provinces for Environmental Protection) EIONET/EU
The data for the development of the indicator are taken from the information collected in the Noise Observatory, which can be populated by the ARPA/APPA representatives and can be consulted, also by the public, on the website https://agentifisici. isprambiente. it/associazionetoriorumore_public/home. php
from the EIONET website at the link http://cdr. eionet. europa. eu/it/eu/noise
and for the data relating to 2022 at the link https://reportnet. europa. eu/public/country/IT
and from the website of the European Environment Agency (EEA) https://www. eea. europa. eu/en/analysis/maps-and-charts/italy-noise-fact-sheet-2021-noise-country-fact-sheets-2021
National, Agglomerations (40/40)
2007-2022
The indicator is developed from noise mapping data, carried out according to the methodology defined in Annex 2 of Directive 2002/49/EC. As amended by Directive (EU) 2015/996 and subsequently updated by Directive (EU) 2021/1226.
Studies on the population exposed in agglomerations show that road traffic is the prevalent source of noise; the analysis of the data highlights that in some urban areas the percentage of the population is high (even higher than 50%) exposed to Lden levels greater than 65 dB(A) and to Lnight levels greater than 55 dB(A) (Table 1).
From the noise maps prepared by the agglomerations in 2022, compared to 2017, a decrease in the population exposed to the highest levels of noise can be seen.
In 2022, the average value of the percentage of the population residing in agglomerations exposed to night-time noise levels (Lnight) above 55 dB(A) stands at around 22%, highlighting a reduction of 6 percentage points compared to the average value recorded in 2017 (28%) (Table 1).
| Allegati |
|---|
Titolo
Tabella 1: Popolazione esposta al rumore nelle aree urbane Fonte
ARPA/APPA, EIONET/EU |
Titolo
Tabella 2: Popolazione esposta al rumore aeroportuale Fonte
ARPA/APPA, EIONET/EU |
File
Titolo
Tabella 3: Numero di persone esposte a elevati livelli di rumore (2007-2017) Fonte
Agenzia Europea dell'Ambiente Note
I dati sono arrotondati al centinaio I dati relativi al 2007 si riferiscono agli agglomerati con più di 250.000 abitanti, alle strade con più di 6 milioni di veicoli all'anno e alle ferrovie con più di 60.000 treni all'anno I dati relativi al 2012 e al 2017 si riferiscono agli agglomerati con più di 100.000 abitanti, alle strade con più di 3 milioni di veicoli all'anno e alle ferrovie con più di 30.000 treni all'anno |
Thumbnail
Titolo
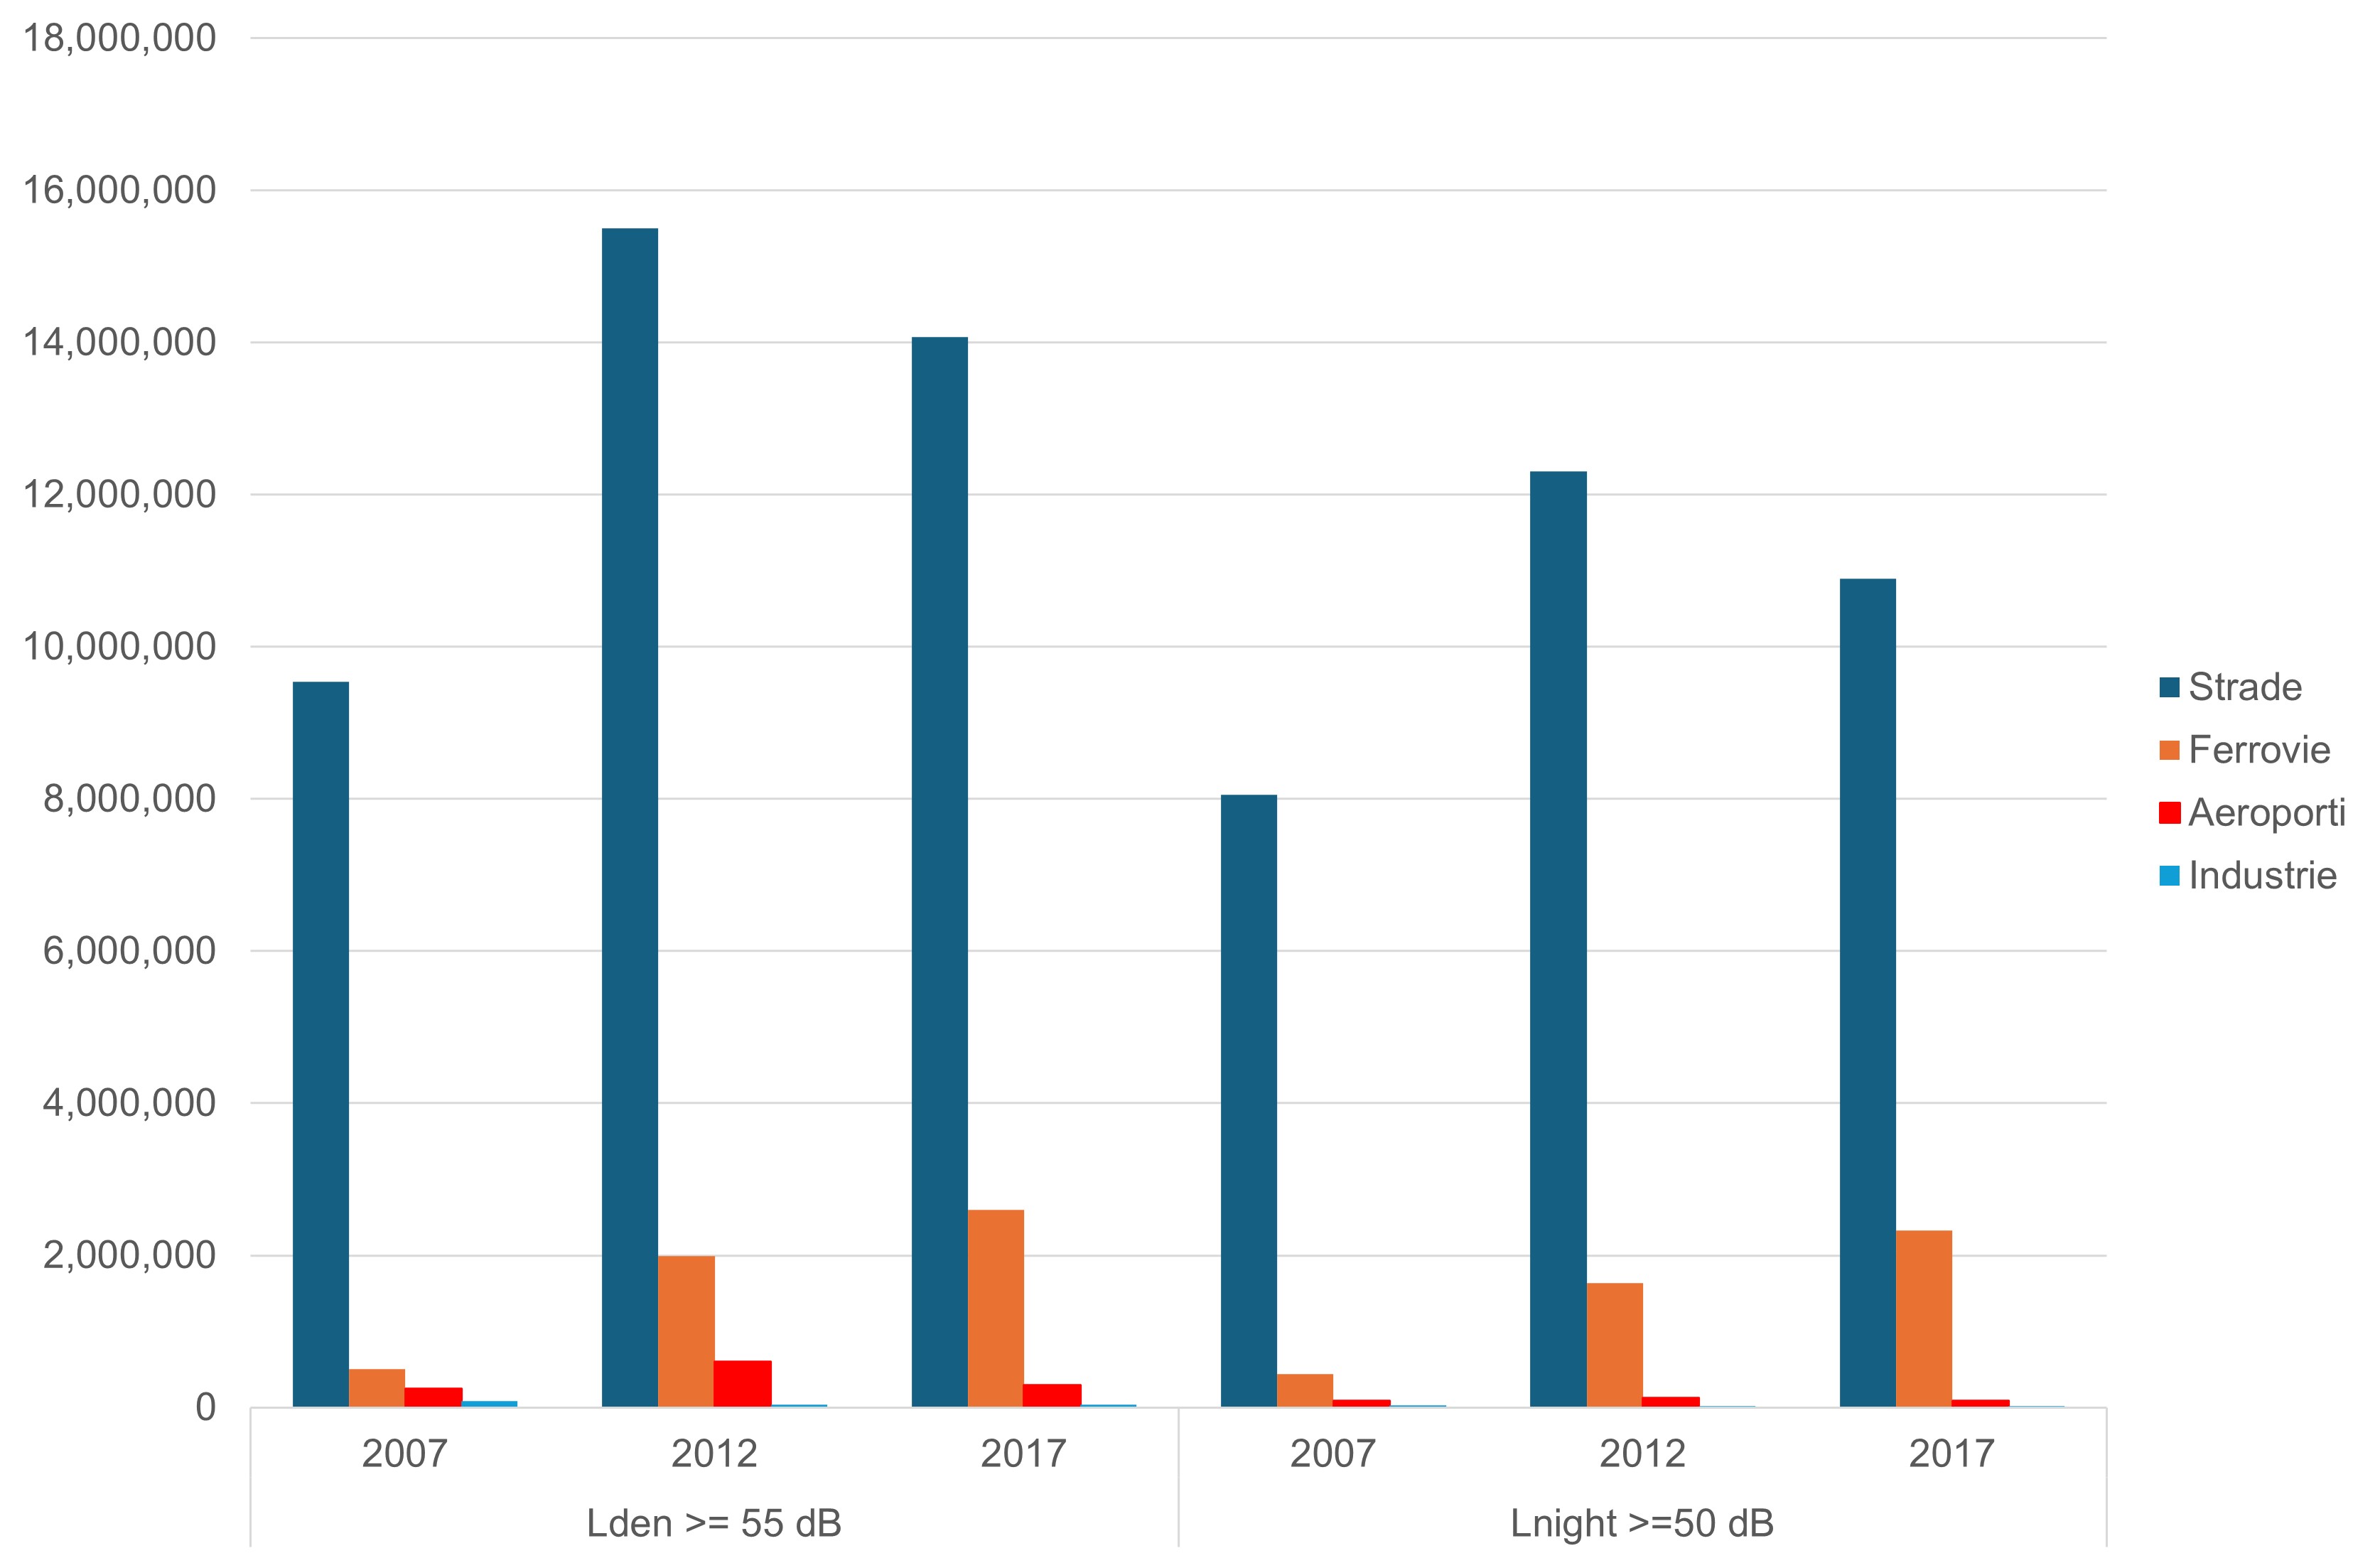
Figura 1: Numero di persone esposte ad elevati livelli di rumore Fonte
Agenzia Europea dell'Ambiente |
As can be seen from Table 1, road traffic is the prevalent source of noise: there are significant percentages of the population exposed to levels above 65 dB(A) Lden and 55 dB(A) Lnight. In the agglomerations for which data from two or more cycles of acoustic mapping are available, a slight decrease over time in the population exposed to the highest levels of noise is noted.
Table 2 presents studies on the population exposed to airport noise, carried out in the period 2006-2022, which show, in some large airports, a decrease in the population exposed to the highest noise levels.
Table 3 and Figure 1 show, aggregated at a national level, the number of people exposed to high levels of noise (Lden > 55dB(A), Lnight >50 dB(A)), produced by roads, railways, airports and industrial sites. These values refer to the 2007, 2012 and 2017 noise mapping cycles.
The indicator, placed in the context of the Seventh Environment Action Program (7 EAP) of the European Union - Priority Objective 3b, is useful for monitoring noise pollution by verifying the population exposure levels recommended by the WHO.