Cristina Frizza
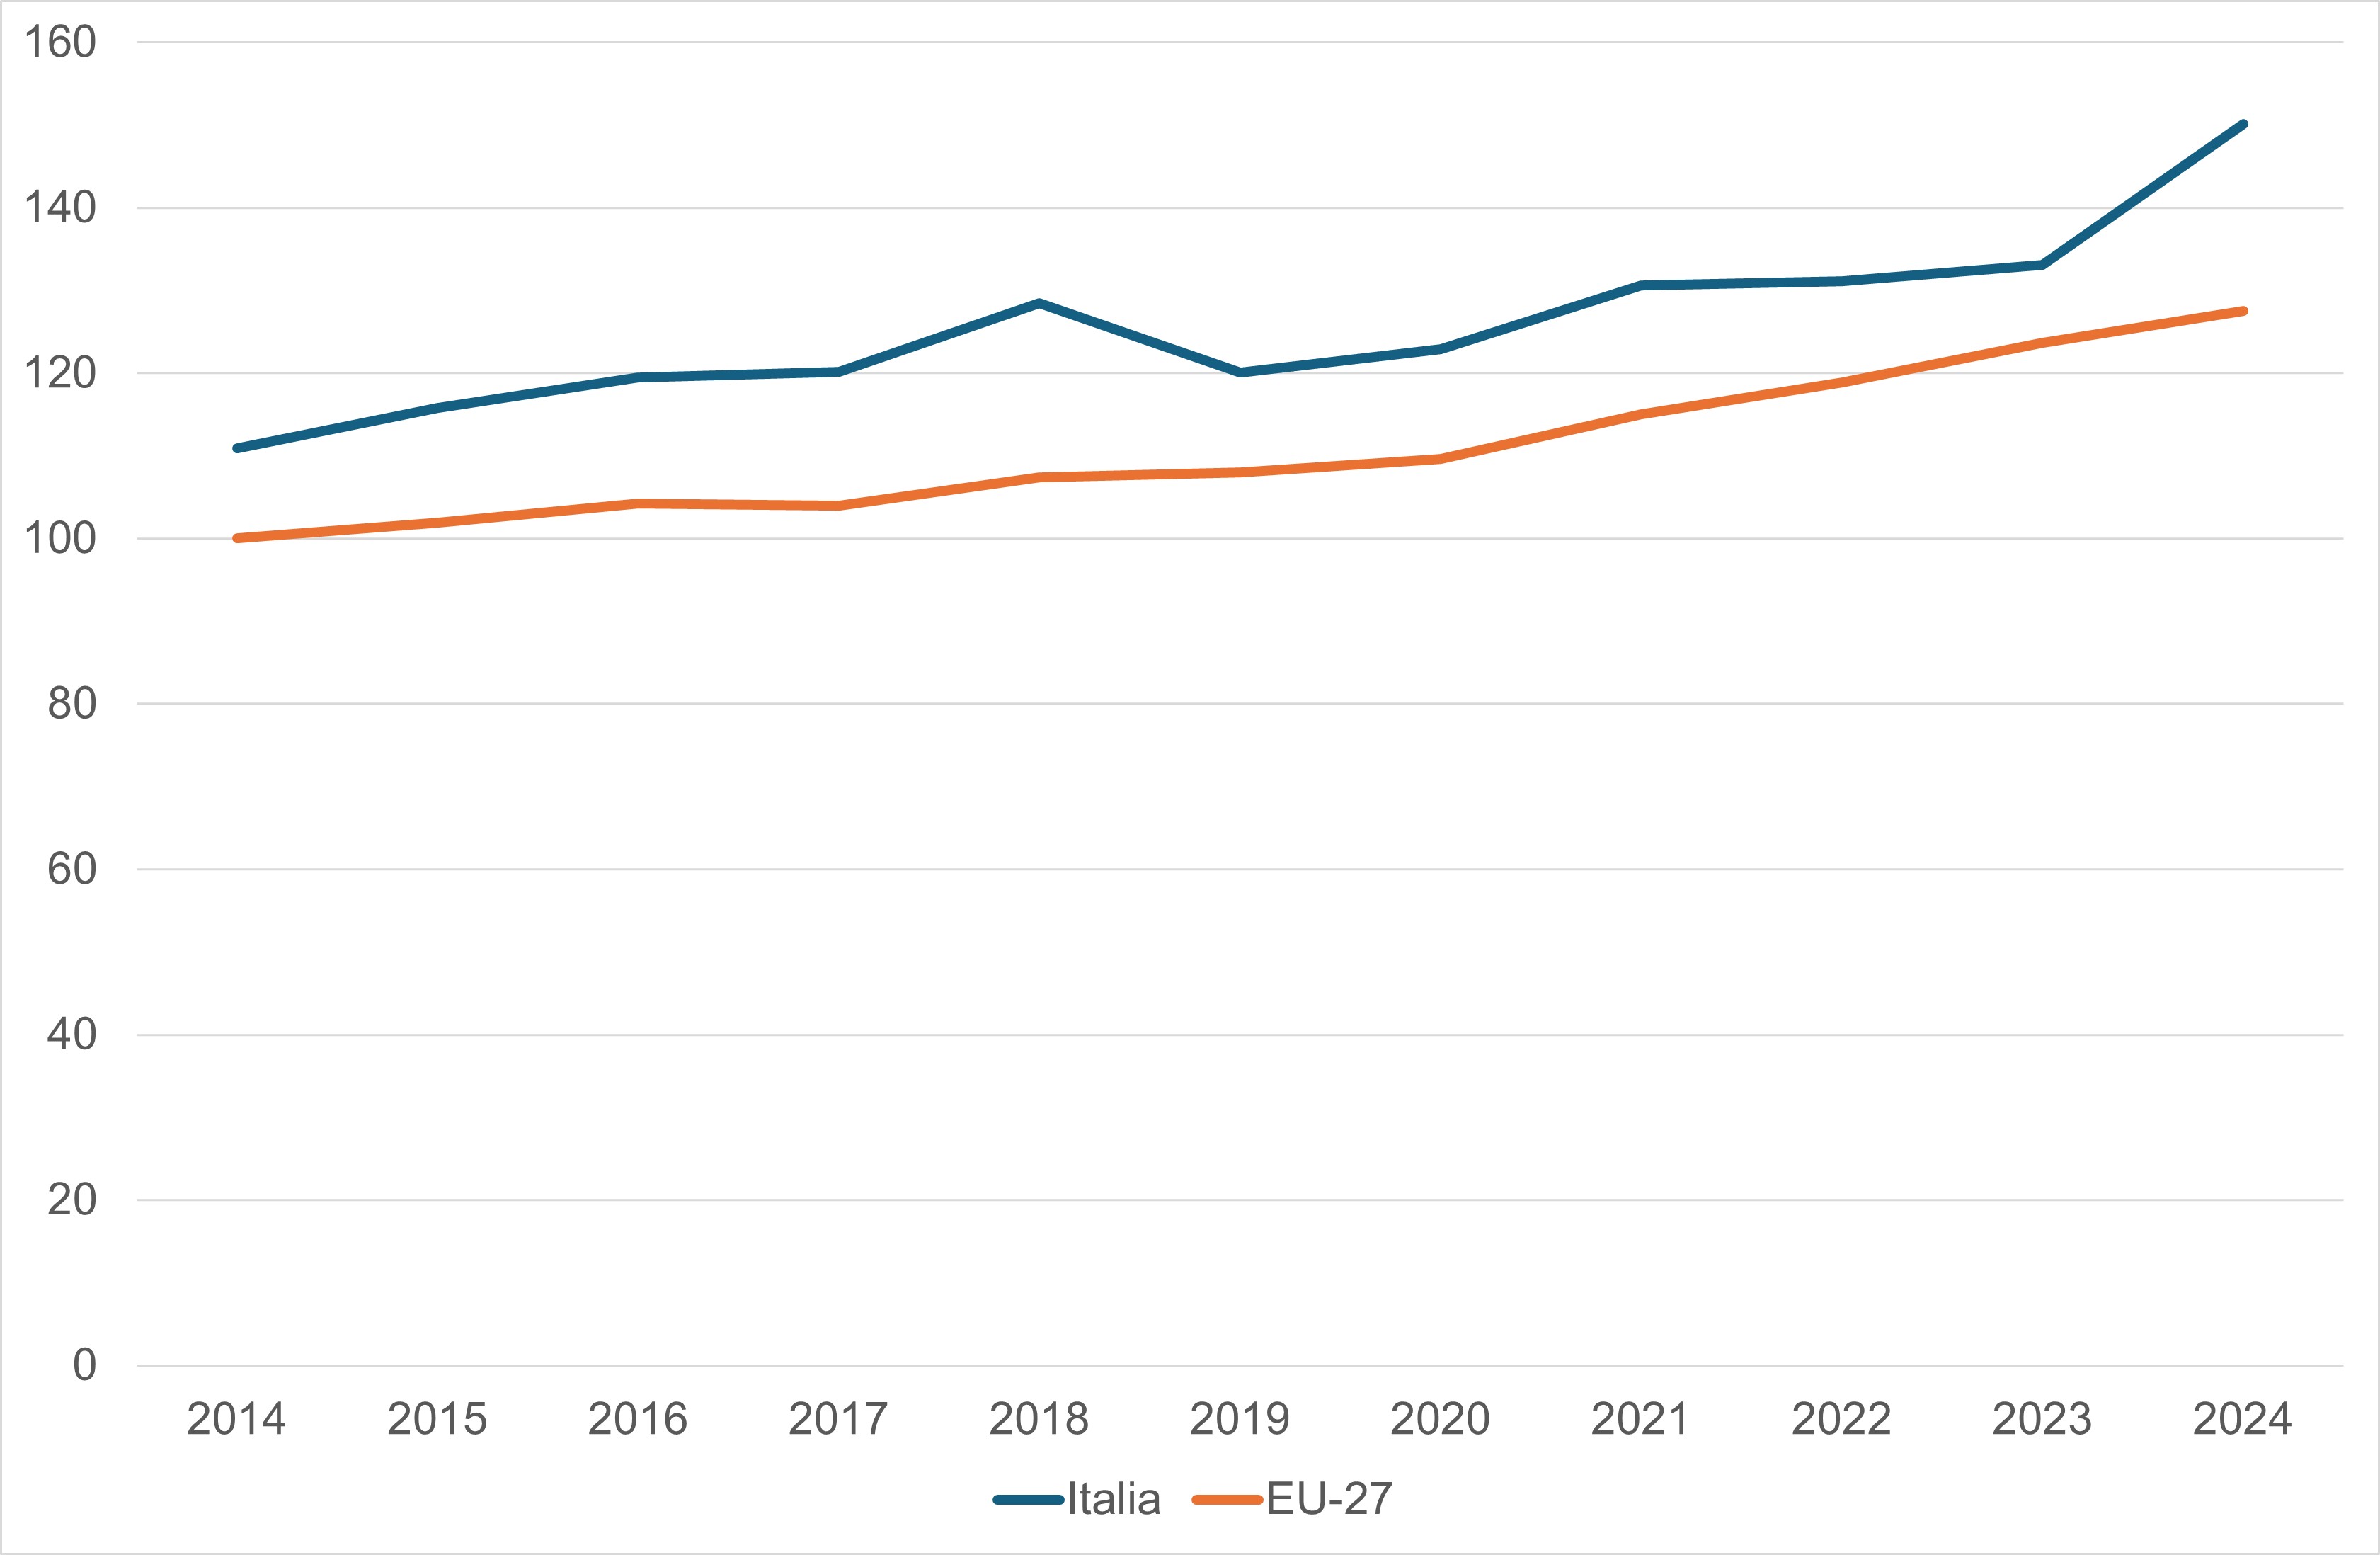
In 2024 Italy confirms itself among the EU leader countries in terms of eco-innovation, with performances above the European average in resource efficiency, energy productivity, and emissions. Between 2014 and 2024, the Italian index grew by +39.2 percentage points (pp), exceeding the EU average increase (+27.5 pp), with a particularly marked improvement in resource efficiency (+64.4 pp compared to +62 pp EU).
Eco-innovation is any innovation that makes progress towards a greener and more sustainable economy by reducing environmental pressures, increasing resilience, or using natural resources more efficiently. The Eco Innovation Index is based on the eco-innovation scoreboard, which includes 12 indicators divided into five thematic areas: Eco-innovation inputs, which include investments in financial and human capital in eco-innovative activities; Eco-innovation activities, which define the extent to which companies in a given country are active in eco-innovation; Eco-innovation outputs, which measure the results of eco-innovation activities in terms of number of patents and academic literature; Resource efficiency outcomes, which identify a country’s resource efficiency and greenhouse gas emission intensity; Socio-economic outcomes, which aim to measure the positive results of eco-innovation both socially and economically. The Eco Innovation Index therefore measures Italy’s eco-innovation performance compared to the EU27 average (EU27 base = 100 in 2014), on the basis of 12 sub-indicators distributed across five thematic areas: inputs, activities, outputs, resource efficiency and socio-economic outcomes. It is calculated annually within the framework of the European Commission’s Eco Innovation Scoreboard.
The purpose is to monitor the capacity of the Italian system to achieve environmental innovations (reduction of environmental impact, resource efficiency, resilience) in line with the objectives of the European Green Deal and the 8th Environment Action Programme.
This indicator is a key indicator for monitoring progress towards the achievement of one of the objectives of the 8th Environment Action Programme and contributes mainly to monitoring the implementation of Article 3, letter (w), which provides for the “strengthening of the environmental knowledge base and its use, also through innovation” (EU, 2022). The European Commission’s communication on the monitoring framework of the 8th EAP specifies that this indicator must be used to monitor the increase of “eco-innovation as a driver of the green transition”.
EC - EU Eco-Innovation Index 2024;
EC, 2022, Communication from the Commission to the European Parliament, the Council, the European Economic and Social Committee and the Committee of the Regions on the monitoring framework for the 8th Environment Action Programme: measuring progress towards the attainment of the programme’s 2030 and 2050 priority objectives, COM (2022) 357 final of 26 July 2022.
EC, 2022, Eco-index 2022 — indicators and methodology, European Commission.
Mohamedaly, Al-Ajlani, H., Kuuliala, V., McKinnon, D. and Johansen, M., 2022, Eco-innovation for circular industrial transformation — a report on the best practices, drivers, and challenges in key sectors, European Commission.
Al-Ajlani, H., Cvijanović, V., Es-Sadki, N. and Müller, N., 2022, EU eco-innovation index 2022 — policy brief, European Commission.
EC, 2011, Communication from the Commission to the European Parliament, the Council, the European Economic and Social Committee and the Committee of the Regions ‘Innovation for a sustainable future — the eco-innovation action plan (Eco-AP)’, COM(2011) 899 final of 15 December 2011.
https://op.europa.eu/en/publication-detail/-/publication/afe9989d-95ac-11ef-a130-01aa75ed71a1/language-en
European Commission
National
2014-2024
The aggregate index is obtained as the unweighted arithmetic mean of the 12 normalized sub-indicators. The values are compared with the EU27 base = 100 to measure Italy’s relative growth. The score of a Member State in a given year t is calculated as the ratio between its score and that of the EU in the base year (t–10), thus offering a standardized and long-term perspective on the progress made.
For this year, 2014 was used as the reference year. Unless otherwise indicated, all indicators, thematic areas, and aggregated index scores are therefore compared with the performance of the EU27 in 2014. In this context, the EU27 score for 2014 is set at 100. Comparisons are based on the extent of deviation from the EU27 level in 2014.
Scores above 100 indicate that a Member State (or the EU27) has a better performance compared to EU2014, while scores below 100 indicate a worse performance compared to EU2014. The index therefore measures the eco-innovation performance of a Member State (MS) compared to the EU27 average.
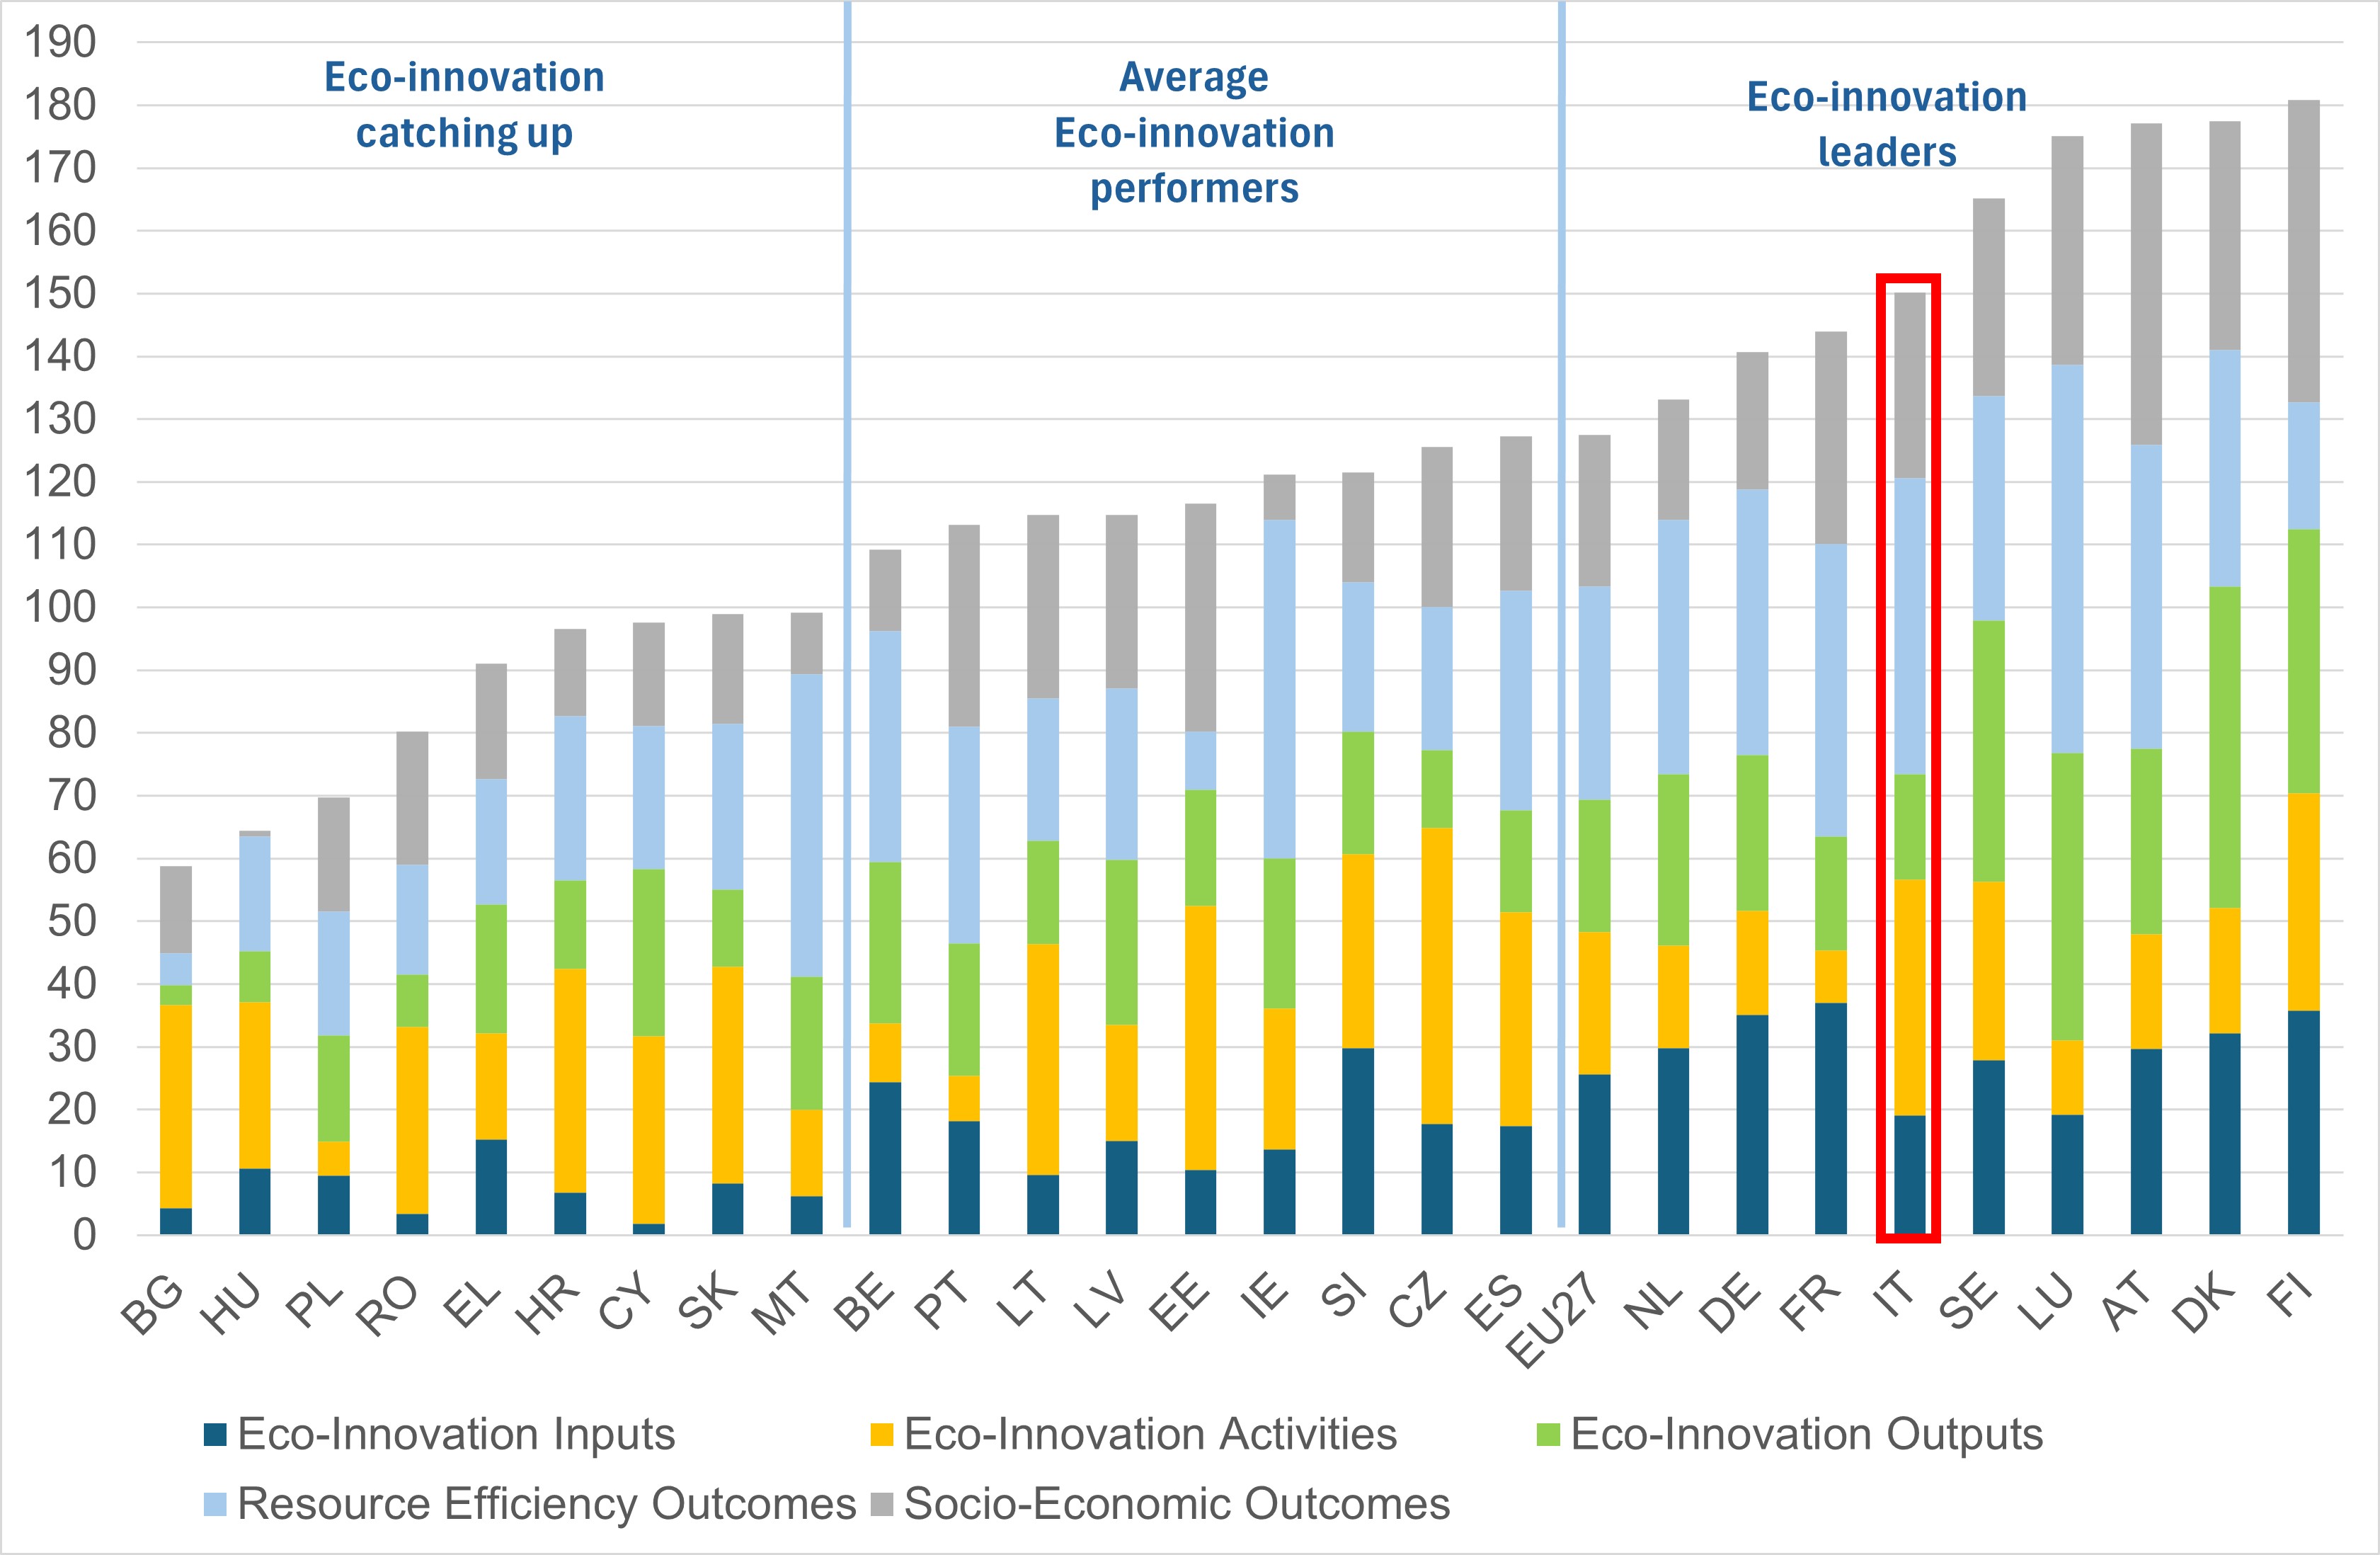
In 2024 Italy ranks among the leading countries in eco-innovation, with a steadily growing performance (Figure 1). In particular, in the field of resource efficiency, the country ranks among the best in the EU (together with Luxembourg), recording results clearly above the European average in terms of resource productivity, energy consumption, and greenhouse gas emissions (Table 2). By virtue of these results, the indicator status can be defined as good.
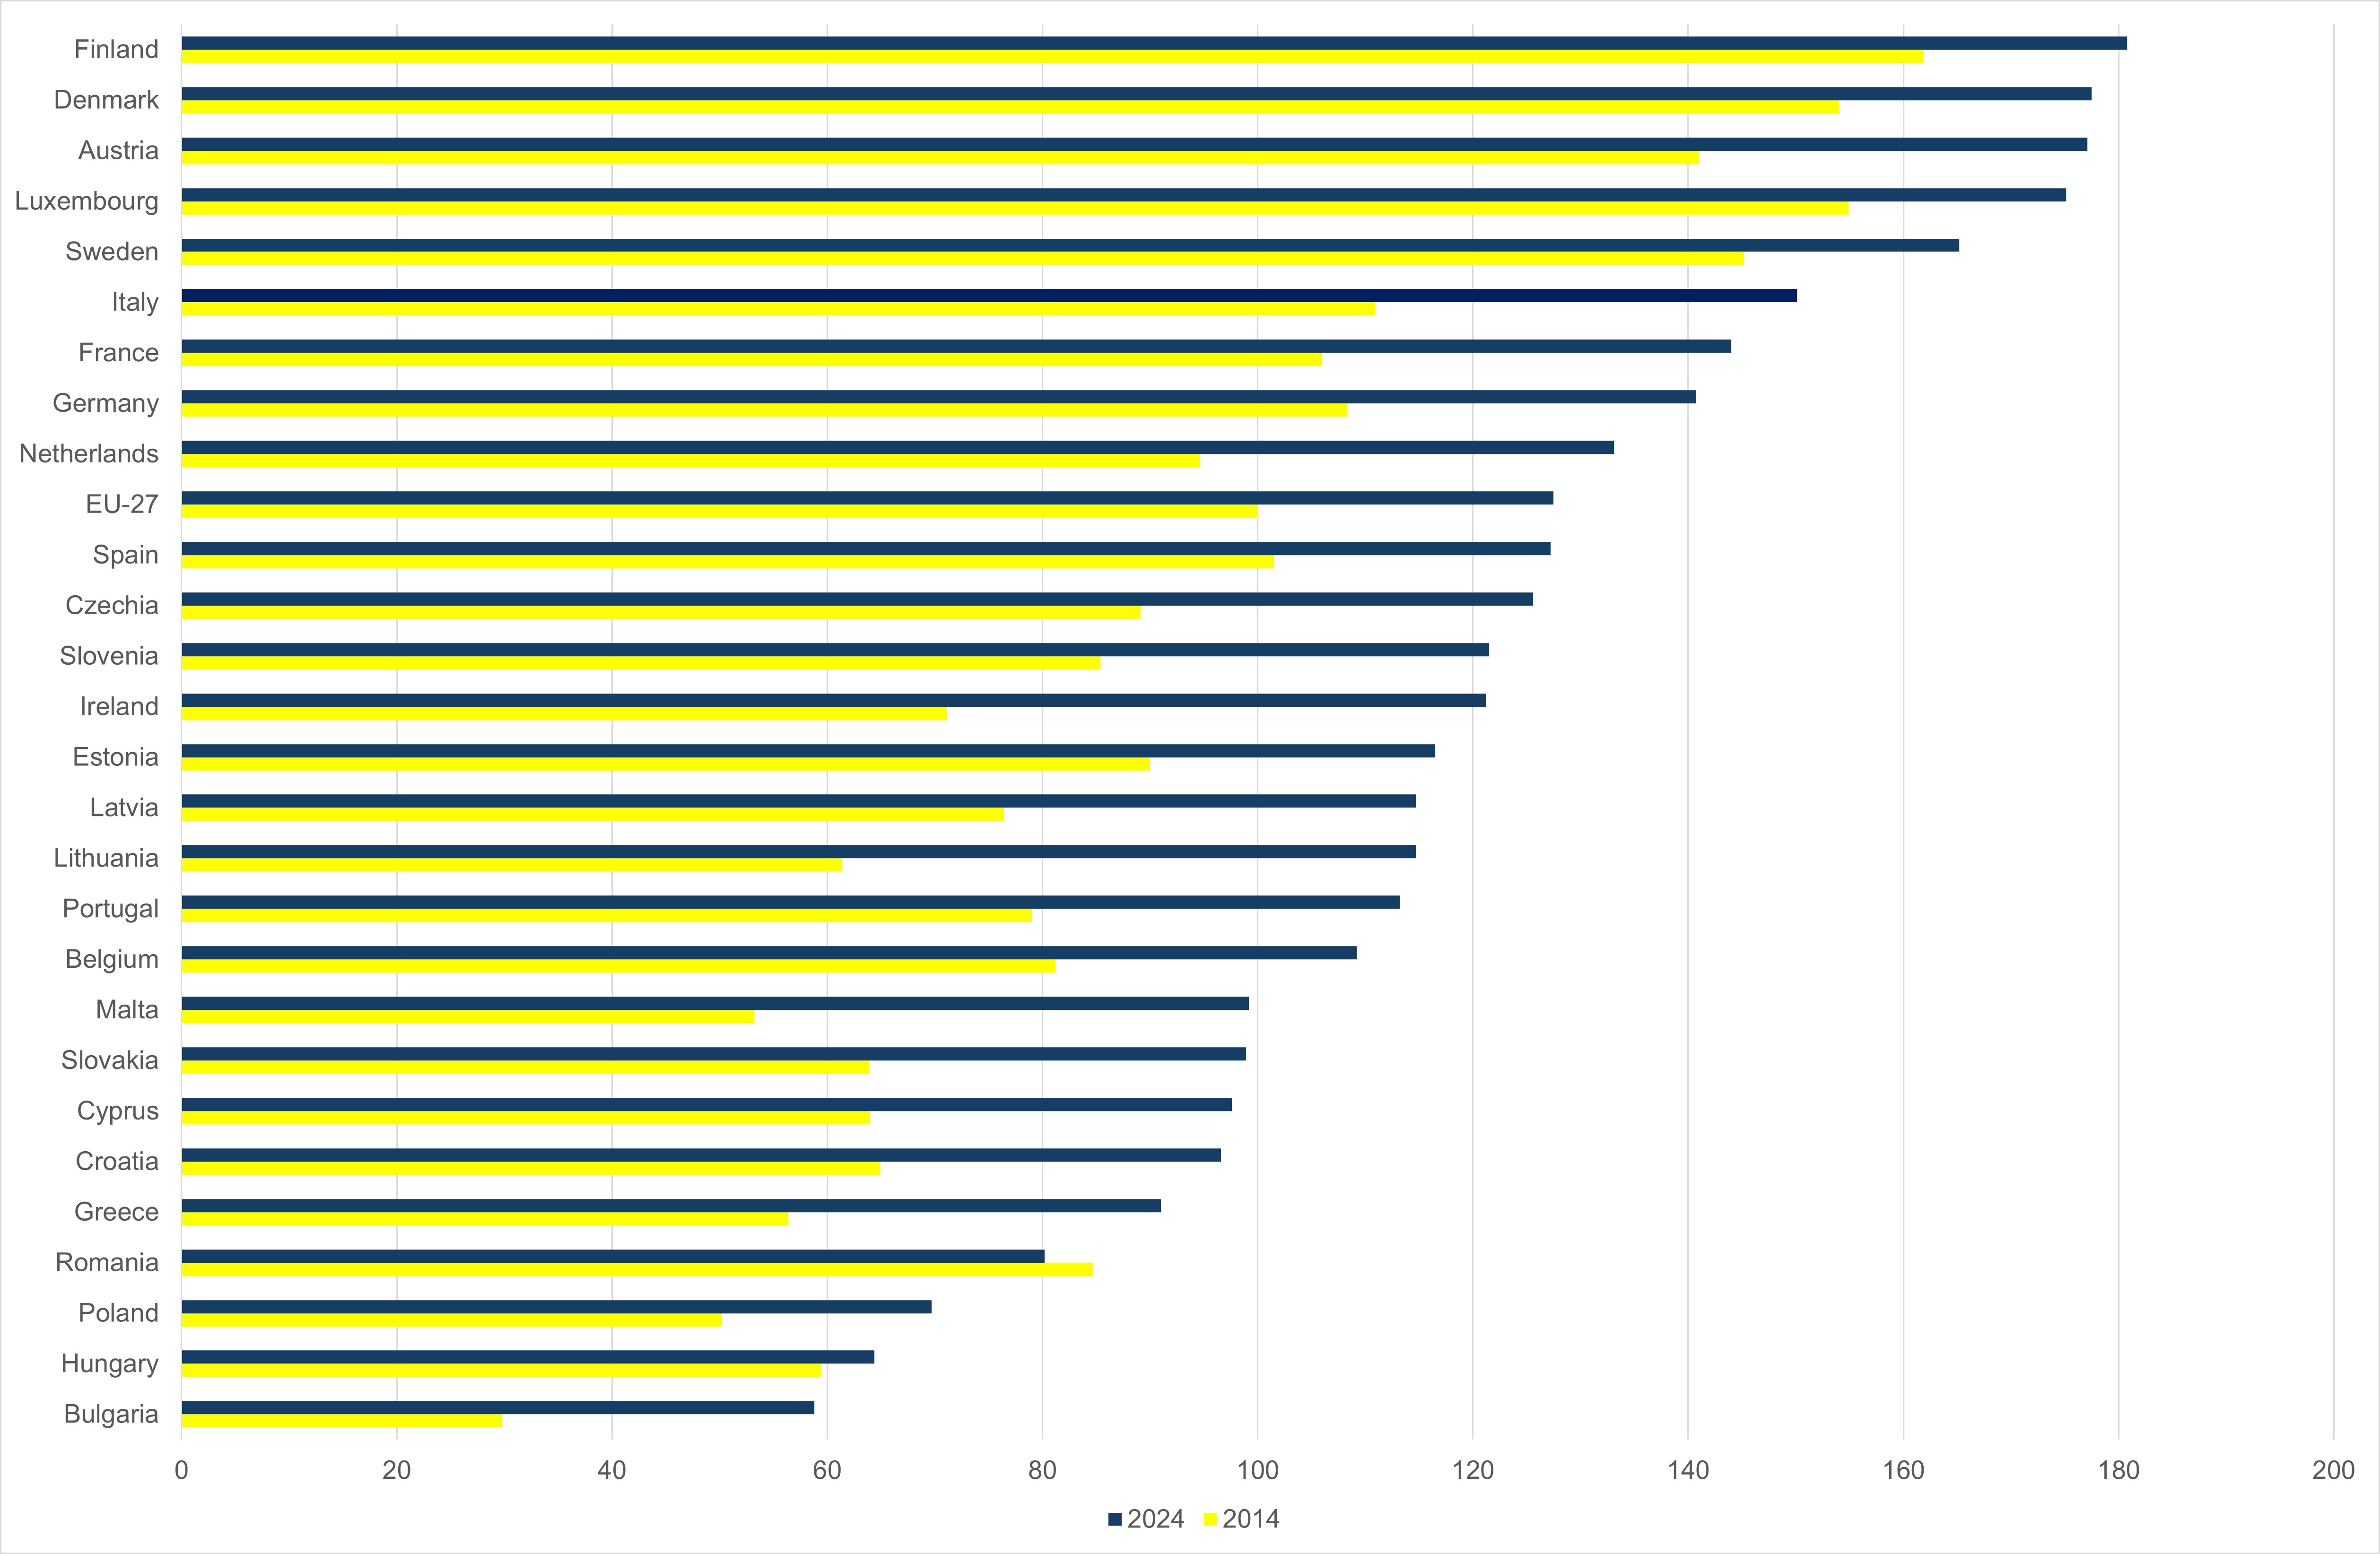
The European index increased by about 27.5 percentage points between 2014 and 2024; Italy contributed with an increase of about 39.2 percentage points. Italy shows a positive and steady trend in the period 2014–2024, with marked improvements especially in resource efficiency (+64.4 percentage points compared to +62 for Europe) (Table 1). Italy shows a positive trend, although less marked compared to the leading countries (Figure 2).
| Allegati |
|---|
Titolo
Table 1: Ecoinnovation Index and single components Fonte
European Commission |
Thumbnail
Titolo
Figure 1: Contribution of each thematic area to the synthetic Eco-Innovation Index 2024 Fonte
ISPRA elaboration on European Commission data |
Thumbnail
Titolo
Figure 2: Performance of the Eco-Innovation systems in 2024 and in 2014 for the Member States Fonte
ISPRA elaboration on European Commission data |
Thumbnail
Titolo
Figure 3: Eco-Innovation Index trend Italy and EU27 Fonte
ISPRA elaboration on European Commission data |
In 2024 Italy shows a clear progress in eco-innovation, supported by a consolidated capacity for efficient resource use. However, areas for improvement remain, particularly in patents, scientific publications, and environmental technologies, indicating the need to strengthen investments in green R&D, the spread of eco-innovation among SMEs (Small and Medium-sized Enterprises), and activities related to the circular economy (Table 2). The main strengths are concentrated in the results related to resource efficiency, with particularly positive indicators in material productivity and the reduction of greenhouse gas emissions. On the contrary, criticalities emerge mainly in socio-economic aspects, such as the limited incidence of eco-innovative patents and exports of environmental goods and services. In the context of the circular economy, Italy stands out for sustainable resource management and urban waste recycling, while business practices and individual behaviors aimed at reuse and consumption reduction, such as the adoption of alternatives to the purchase of new products and the use of self-financing for circular initiatives, are less developed.