Stefano Mariani
The maps of Standardized Precipitation Index (SPI) at 12 months provide a national and large-scale assessment of hydrological drought conditions, obtained using rainfall data collected and published by the regional hydro-meteorological services and those of the autonomous provinces and those of the abolished National Hydrographic and Mareographic Service (SIMN, now merged into ISPRA) of the Department for National Technical Services. The 12-month aggregation time step chosen for the SPI evaluation is the one that best describes the effects of drought (precipitation deficit) on river flow, reservoir recharge and the availability of water in aquifers.
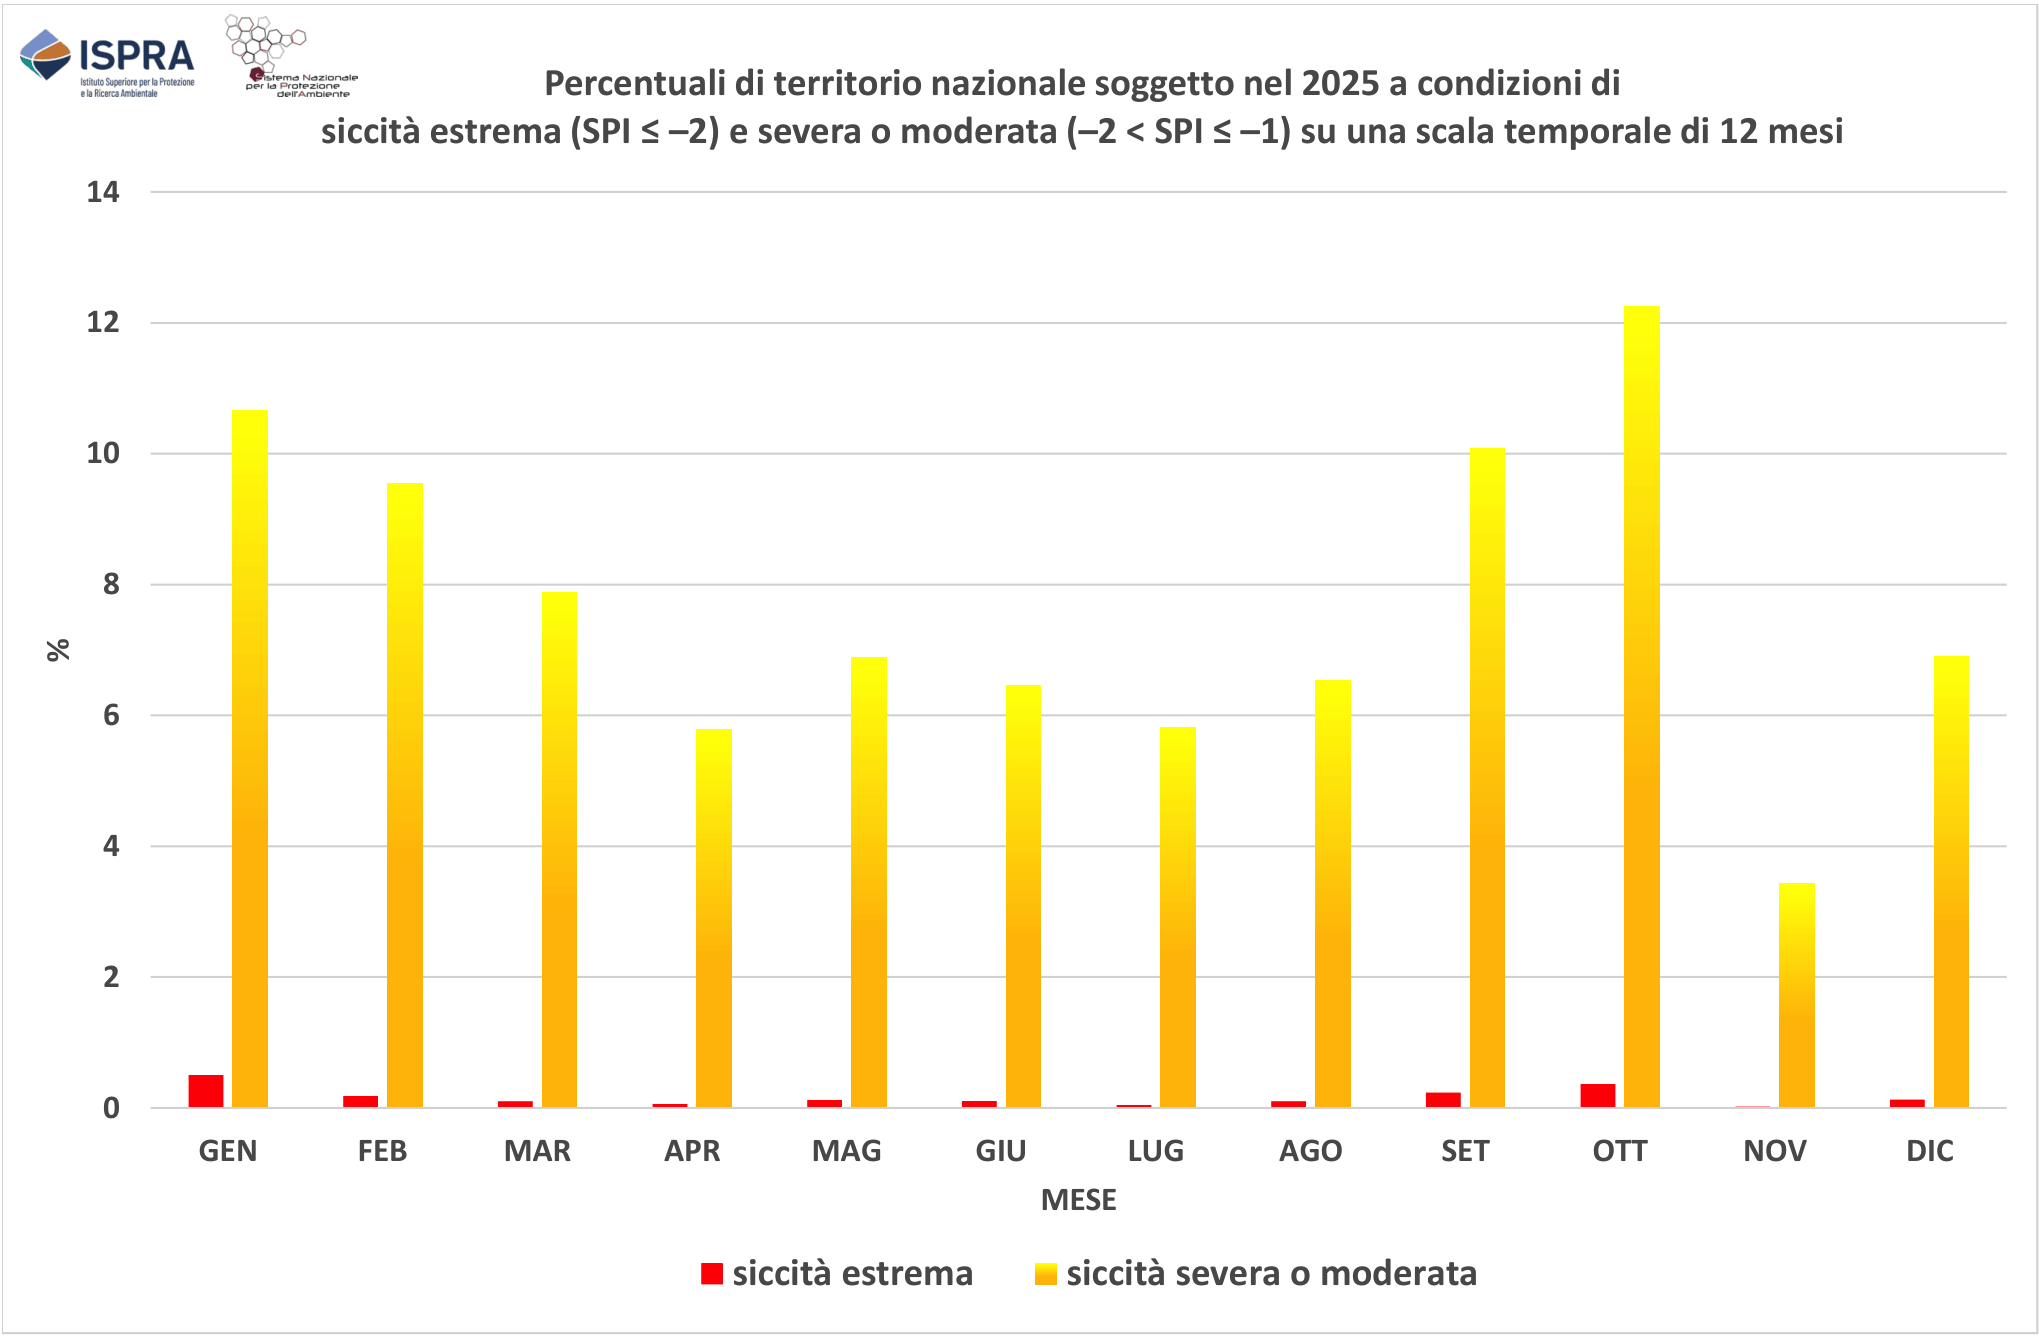
In 2025, the 12-month SPI maps (SPI12) continued to highlight drought conditions for the Central-Southern territories and the major islands, even if these conditions, on an annual scale, were less severe than in previous years and very localized. In terms of SPI12, the months of January, September and October 2025 were those most characterized by drought conditions, from extreme to moderate, although the percentage of Italian territory affected by such conditions was just over 10%. Northern Italy was, however, characterized by situations of mostly severe (1.5 ≤ SPI < 2.0) and locally extreme humidity (SPI12 ≥ 2.0).
Central, Southern Italy and the major islands, due to the rainfall deficits and high temperatures also recorded in 2025, as well as the drought conditions already reported starting from the second half of 2023 and then in 2024, continued to have problems related to the use of water resources (water stress) with environmental and socio-economic impacts.
Drought is a natural and temporary meteorological condition in which there is a significant reduction in precipitation compared to the climatic conditions of a specific place of interest. Therefore, it should not be confused with the phenomenon of aridity, a term which indicates a permanent natural climatic condition in which the low quantity of annual precipitation, associated with high temperatures, does not provide the soil with the necessary degree of humidity to promote the development of life.
There is no single definition of drought, although everyone agrees that drought is a temporary but frequent phenomenon, which can generate environmental, social and economic impacts. The phenomenon of drought presents different characteristics in the components of the hydrological cycle, which, in turn, produce different impacts on water systems, cultures and socio-economic and environmental systems. In relation to the effects produced, drought is generally classified into four categories:
- meteorological drought in case of relative scarcity of precipitation;
- hydrological drought in the presence of a relatively low water supply in the soil, in watercourses, or in aquifers;
- agricultural drought in the event of a deficit in soil water content which causes stress conditions in crop growth;
- socio-economic and environmental drought understood as the set of impacts that manifest themselves as an imbalance between the availability of the resource and the demand for economic activities, for social aspects and for the conservation of ecosystems.
The impact of drought on the environment is then linked to the severity and persistence of the dry conditions. A prolonged lack of rainfall for many months (6-12 months) will have effects on river flow; while for a longer period (one or two years) it will affect the availability of water in the aquifers.
The Standardized Precipitation Index (SPI) is the index commonly used at a national and international level to quantify, on a given time scale, the deficit or surplus of precipitation in the areas of interest with respect to the climatology, i. e. The reference rainfall regime: positive values indicate greater precipitation than the climatology, i. e. Humid conditions; Negative values indicate less precipitation than the climatology, i. e. More or less extreme dry conditions. This index is often used at a regional and/or hydrographic district level for monitoring and identifying dry periods, using for its calculation the rainfall recorded by the regional rainfall networks and those of the autonomous provinces. Furthermore, it has been included both in the European context (from " Water Scarcity & Drought ” Expert Group from the Common Implementation Strategy for the Water Framework Directive 2000/60/EC) and international (since World Meteorological Organization ) as one of the most effective tools for drought monitoring. The SPI is also part of the set of indicators adopted by European Drought Observatory of Joint Research Center of the European Commission. Last but not least, the SPI indicator was also included in the national guidelines which identify the common set of indicators to be adopted in the permanent district observatories for water uses (established in 2016 as a plan measure pursuant to the Water Framework Directive 2000/60/EC and body of the District Basin Authorities pursuant to Legislative Decree 39/2023) in the monitoring activities of drought and scarcity situations water.
The SPI is also used to derive an indicator capable of evaluating, from the local to the national scale, the impact of climate change on water resources, through the calculation of variations in the percentage of territory subjected to unusual wet or dry conditions ( https:// climadat. isprambiente. it /).
For each area under consideration, the calculation of the SPI is based on the normalization of the probability distribution of the cumulative rainfall on the time scale considered (e. g. 1, 3, 6, 12, 24 or 48 months). In doing so, regions characterized by different climatic regimes can be compared. For the purpose of a national and large-scale assessment of hydrological drought conditions, the 12-month SPI maps are used, taking precipitation data aggregated to the monthly scale on the regular 1 km resolution grid of the ISPRA BIGBANG hydrological balance model and the period 1951–2025 as a climatological reference (reference baseline).
Quantify the hydrological drought conditions of a given place in terms of statistical deviation of the precipitation occurring on a given time scale compared to the corresponding rainfall regime (i. e. The reference climatology). Being a normalized index, it allows regions characterized by different climatic regimes to be compared with each other. Consequently, regions with a drier climate and those with a wetter climate are monitored in the same way in a single thematic map.
The severity levels of humidity and drought events in terms of SPI, associated with the surplus and deficit of precipitation, adopted are those defined in the literature: SPI ≥ 2.0 extreme humidity; 1.5 ≤ SPI < 2.0 severe humidity; 1.0 ≤ SPI < 1.5 moderate humidity; –1.0 < SPI < 1.0 normal; –1.5 < SPI ≤ –1.0 moderate drought; –2.0 < SPI ≤ –1.5 severe drought; SPI ≤ –2.0 extreme drought.
Current Italian legislation does not set specific environmental objectives for the SPI index. Nonetheless, the SPI is included in the common set of indicators for the assessment of drought and water scarcity conditions conducted by the permanent district observatories for water uses. Please note that the Observatories, established in 2016 for each river basin district as a measure of the Water Management Plan, pursuant to the Water Framework Directive 2000/60/EC, are currently also the body of the relevant District Basin Authority, pursuant to:
- Legislative Decree no. 152/2006, containing “Regulations on environmental matters” (Official Journal General Series no. 88 of 14-04-2006 – Ordinary Supplement no. 96).
- D. L. N. 39/2023, containing "Urgent provisions to combat water scarcity and for the strengthening and adaptation of water infrastructure" (Official Journal General Series no. 88 of 04-14-2023), converted with amendments by Law no. 68/2023 (Official Journal General Series no. 136 of 13-06-2023), in which the establishment of permanent district observatories on water uses at the district basin authorities was established by a primary regulation.
- European Water Resilience Strategy, adopted by the European Commission on 4 June 2025.
- Braca, G., Mariani, S., Lastoria, B., Piva, F., Archi, F., Botto, A., Casaioli, M., Forte, T., Marchetti, G., Peruzzi, C., Tropeano, R., Vendetti, C., and Bussettini, M., 2023: National hydrological balance: focus on drought and natural availability of renewable water resources. Update to 2022. Reports no. 388/2023, Rome https://www. isprambiente. gov. it/it/pubblicazioni/rapporti/bilancio-idrologico-nazionale-focus-su-siccita-e-disponibilita-naturale-della-risorsa-idrica-rinnovabile-formazione-al-2022.
- Braca, G., Bussettini, M., Lastoria, B., Mariani, S., and Piva, F., 2021: The Gis BAsed Hydrological Balance at National Scale on Regular Grid – BIGBANG: methodology and estimates. Report on the natural availability of water resources. Reports no. 339/21, Rome. Available online at: https://www. isprambiente. gov. it/it/pubblicazioni/rapporti/il-bilancio-idrologico-gis-based-a-scala-nazionale-su-griglia-regolare-bigbang .
- Edwards, D. C., and McKee, T. B., 1997: Characteristics of 20th century drought in the United States at multiple time scales. Climatology Rep. 97–2, Department of Atmospheric Science, Colorado State University, Fort Collins, Colorado, 155 pp.
- Mariani, S., Braca, G., Lastoria, B., Tropeano, R., Casaioli, M., Piva, F., and Bussettini, M., 2024: “The hydrological balance, the availability of water resources and the water balance”, in Drought, scarcity and water crises, Emanuele Romano, Ivan Portoghese (ed.), Habitat signa 1, 29-46. Rome: Cnr Editions. Available online at: https://www. cnr. it/sites/default/files/public/media/attivita/editoria/SiccitaInterattiva_ver2. pdf .
- Mariani, S., and AA. VV., 2020: Technical notes on water crises, drought and integrated water service – UTILITALIA Manual. ISBN: 978 88 998 7903 7.
- Mariani, S., Braca, G., Romano, E., Lastoria, B. And Bussettini, M., 2018: Guidelines on Drought and Water Scarcity Indicators to be used in the Activities of the Permanent Observatories for Water Use, CReIAMO PA project publication, 66 pp. Available online at: http://www. isprambiente. gov. it/pre_meteo/idro/Osservatori/Linee%20Guida%20Publicazione%20Finale%20L6WP1_con%20copertina_ec. pdf .
- McKee, T. B., Doesken, N. J., and Kleist, J., 1993: The relationship of drought frequency and duration of time scales. Eighth Conference on Applied Climatology, American Meteorological Society, Jan 17–23, 1993, Anaheim CA, pp. 179–186.
- Panofsky, H. A., and Brier, G. W., 1958: Some applications of statistics to meteorology. Pennsylvania State University, University Park, 224 pp.
- Thom, H. C. S., 1966: Some methods of climatological analysis. WMO No. 199. Technical Note No. 81., Geneva, 53 pp.
- SNPA, 2026: The climate in Italy in 2025, forthcoming .
- Vicente-Serrano, S. M., Beguería, S., and López-Moreno, J. I., 2010: A Multiscalar Drought Index Sensitive to Global Warming: The Standardized Precipitation Evapotranspiration Index. J. Climate, 23, 1696–1718.
- WMO, 2016: Handbook of Drought Indicators and Indices, WMO-No. 1173, Geneva.
- WMO, 2012: Standardized Precipitation Index User Guide, WMO-No. 1090, Geneva.
- WMO, 2009: Experts agree on a universal drought index to cope with climate risks. Press Release No. 872.
Further references:
- ISPRA monthly drought bulletin, with links to the monthly hydrological and regional drought bulletins and to the EDO. Available online at: http://www. isprambiente. gov. it/pre_meteo/siccitas/index. html .
- SPI grid ASCII file database Standardized Precipitation Index and the SPEI- Standardized Precipitation Evapotranspiration Index , calculated on Italy from 1952 to 2025. Available online at: https://groupware. sinanet. isprambiente. it/bigbang-data/library/bigbang100/ascii_grid .
- SPI images Standardized Precipitation Index and the SPEI- Standardized Precipitation Evapotranspiration Index , calculated on Italy from 1952 to 2025. Available online at: https://groupware. sinanet. isprambiente. it/bigbang-data/library/bigbang100/figures/.
- Portal of "The state of water severity on a national scale", with links to the portals of the permanent district observatories for water uses. Available online at: https://www. isprambiente. gov. it/pre_meteo/idro/SeverIdrica. html .
- “Climate change impact indicators” database. Available online at: https://climadat. isprambiente. it/.
- News on the use of Sentinel-2 satellite data from the European Copernicus Program to quantify the impact of the 2022 drought on the constituent components (morphological macro-units "water", "vegetation" and "sediment") of the Po River. Available online at: https://www. isprambiente. gov. it/it/archivio/notizie-e-novita-normative/notizie-ispra/2022/08/monitoraggio-siccita-copernicus .
-
-
ISPRA
Regional hydro-meteorological services and those of the autonomous provinces
The precipitation data used are mostly those collected and published by the regional and provincial structures to which, based on art. 92 of Legislative Decree no. 112 of 31 March 1998, the functions and tasks of the peripheral offices of the National Hydrographic and Mareographic Service (SIMN, now merged into ISPRA) of the Department for National Technical Services were transferred. The precipitation data used in the development of the SPI indicator can be accessed by consulting the institutions' websites or by making an appropriate request. The data are aggregated at the monthly scale on the regular BIGBANG grid of 1 km resolution, which covers the entire national territory, and are available on the ISPRA Groupware portal ( https://groupware. sinanet. isprambiente. it/bigbang-data/library/bigbang100/).
National
january–December 2025
The SPI is a statistical indicator based on the comparison between the precipitation recorded in a specific place and in a specific period t of months (where t = 12 months in the indicator published here) with the long-term distribution of precipitation for that specific location aggregated for the same period of time t . In other words, if you want to calculate the 12-month SPI at the end of June for a given year, you will compare the total precipitation recorded in the period from July of the previous year to June of the year in question with the long-term series of cumulative precipitation over the period July–June recorded in past years (your reference climatology).
The calculation of the SPI is therefore based on the analysis of a long-term historical series of precipitation observations aggregated over a specific time interval t . Operationally, for each month under examination and for each box of the precipitation data grid aggregated monthly and spatialized on the 1 km grid of the BIGBANG, the series X of the cumulative annual data (the random variable analyzed) is interpolated to a gamma-type probability distribution, estimating the parameters of the distribution with the maximum likelihood technique. However, given that the gamma distribution G ( x ) is not defined for values equal to zero, while the precipitation series may contain zeros (non-rain days), the cumulative distribution is redefined as follows:
H ( x )= q + (1 – q )* G ( x ),
where q is the probability of zero precipitation, which can be estimated as the ratio of the number of zeros in the precipitation time series ( m ) and the total number of precipitation observations:
m / n.
The cumulative distribution H ( x ) is then transformed into a normal distribution. Therefore, the average value of the SPI for a specific place and aggregation period considered is equal to zero. The transformation preserves the cumulative probability, meaning the probability of the random variable X (the cumulative precipitation over 12 months in the specific case) of being below a certain value in the gamma distribution is equal to the probability of the normally distributed transformed variable being below the transform of that value.
Since the SPI is distributed according to a normal probability function, it is possible to monitor both dry and wet periods. Negative SPI values correspond to drier periods compared to the climatology, i. e. They indicate a precipitation deficit (drought), while positive SPI values correspond to wetter periods, i. e. They indicate a precipitation surplus. The greater the distance from the climatology (i. e. From the reference rainfall regime), the greater the severity of the event. Furthermore, the normalization that is the basis of this index allows areas subject to different climatologies to be represented in the same way and on the same map.
Further details on the processing methodology can be found in the ISPRA Drought Bulletin ( https://www. isprambiente. gov. it/pre_meteo/siccitas/spicalc. html ).
During 2025, drought conditions, from extreme to moderate, affected vast areas of southern and central Italy and the major islands, although less burdensome than in previous years. Humidity conditions, i. e. Surplus precipitation compared to the average reference values, even of an extreme nature, have characterized Northern Italy.
On a 12-month time scale, the indicator highlighted a reduced percentage of areas of Italian territory affected by drought.
-
| Allegati |
|---|
Thumbnail
Titolo
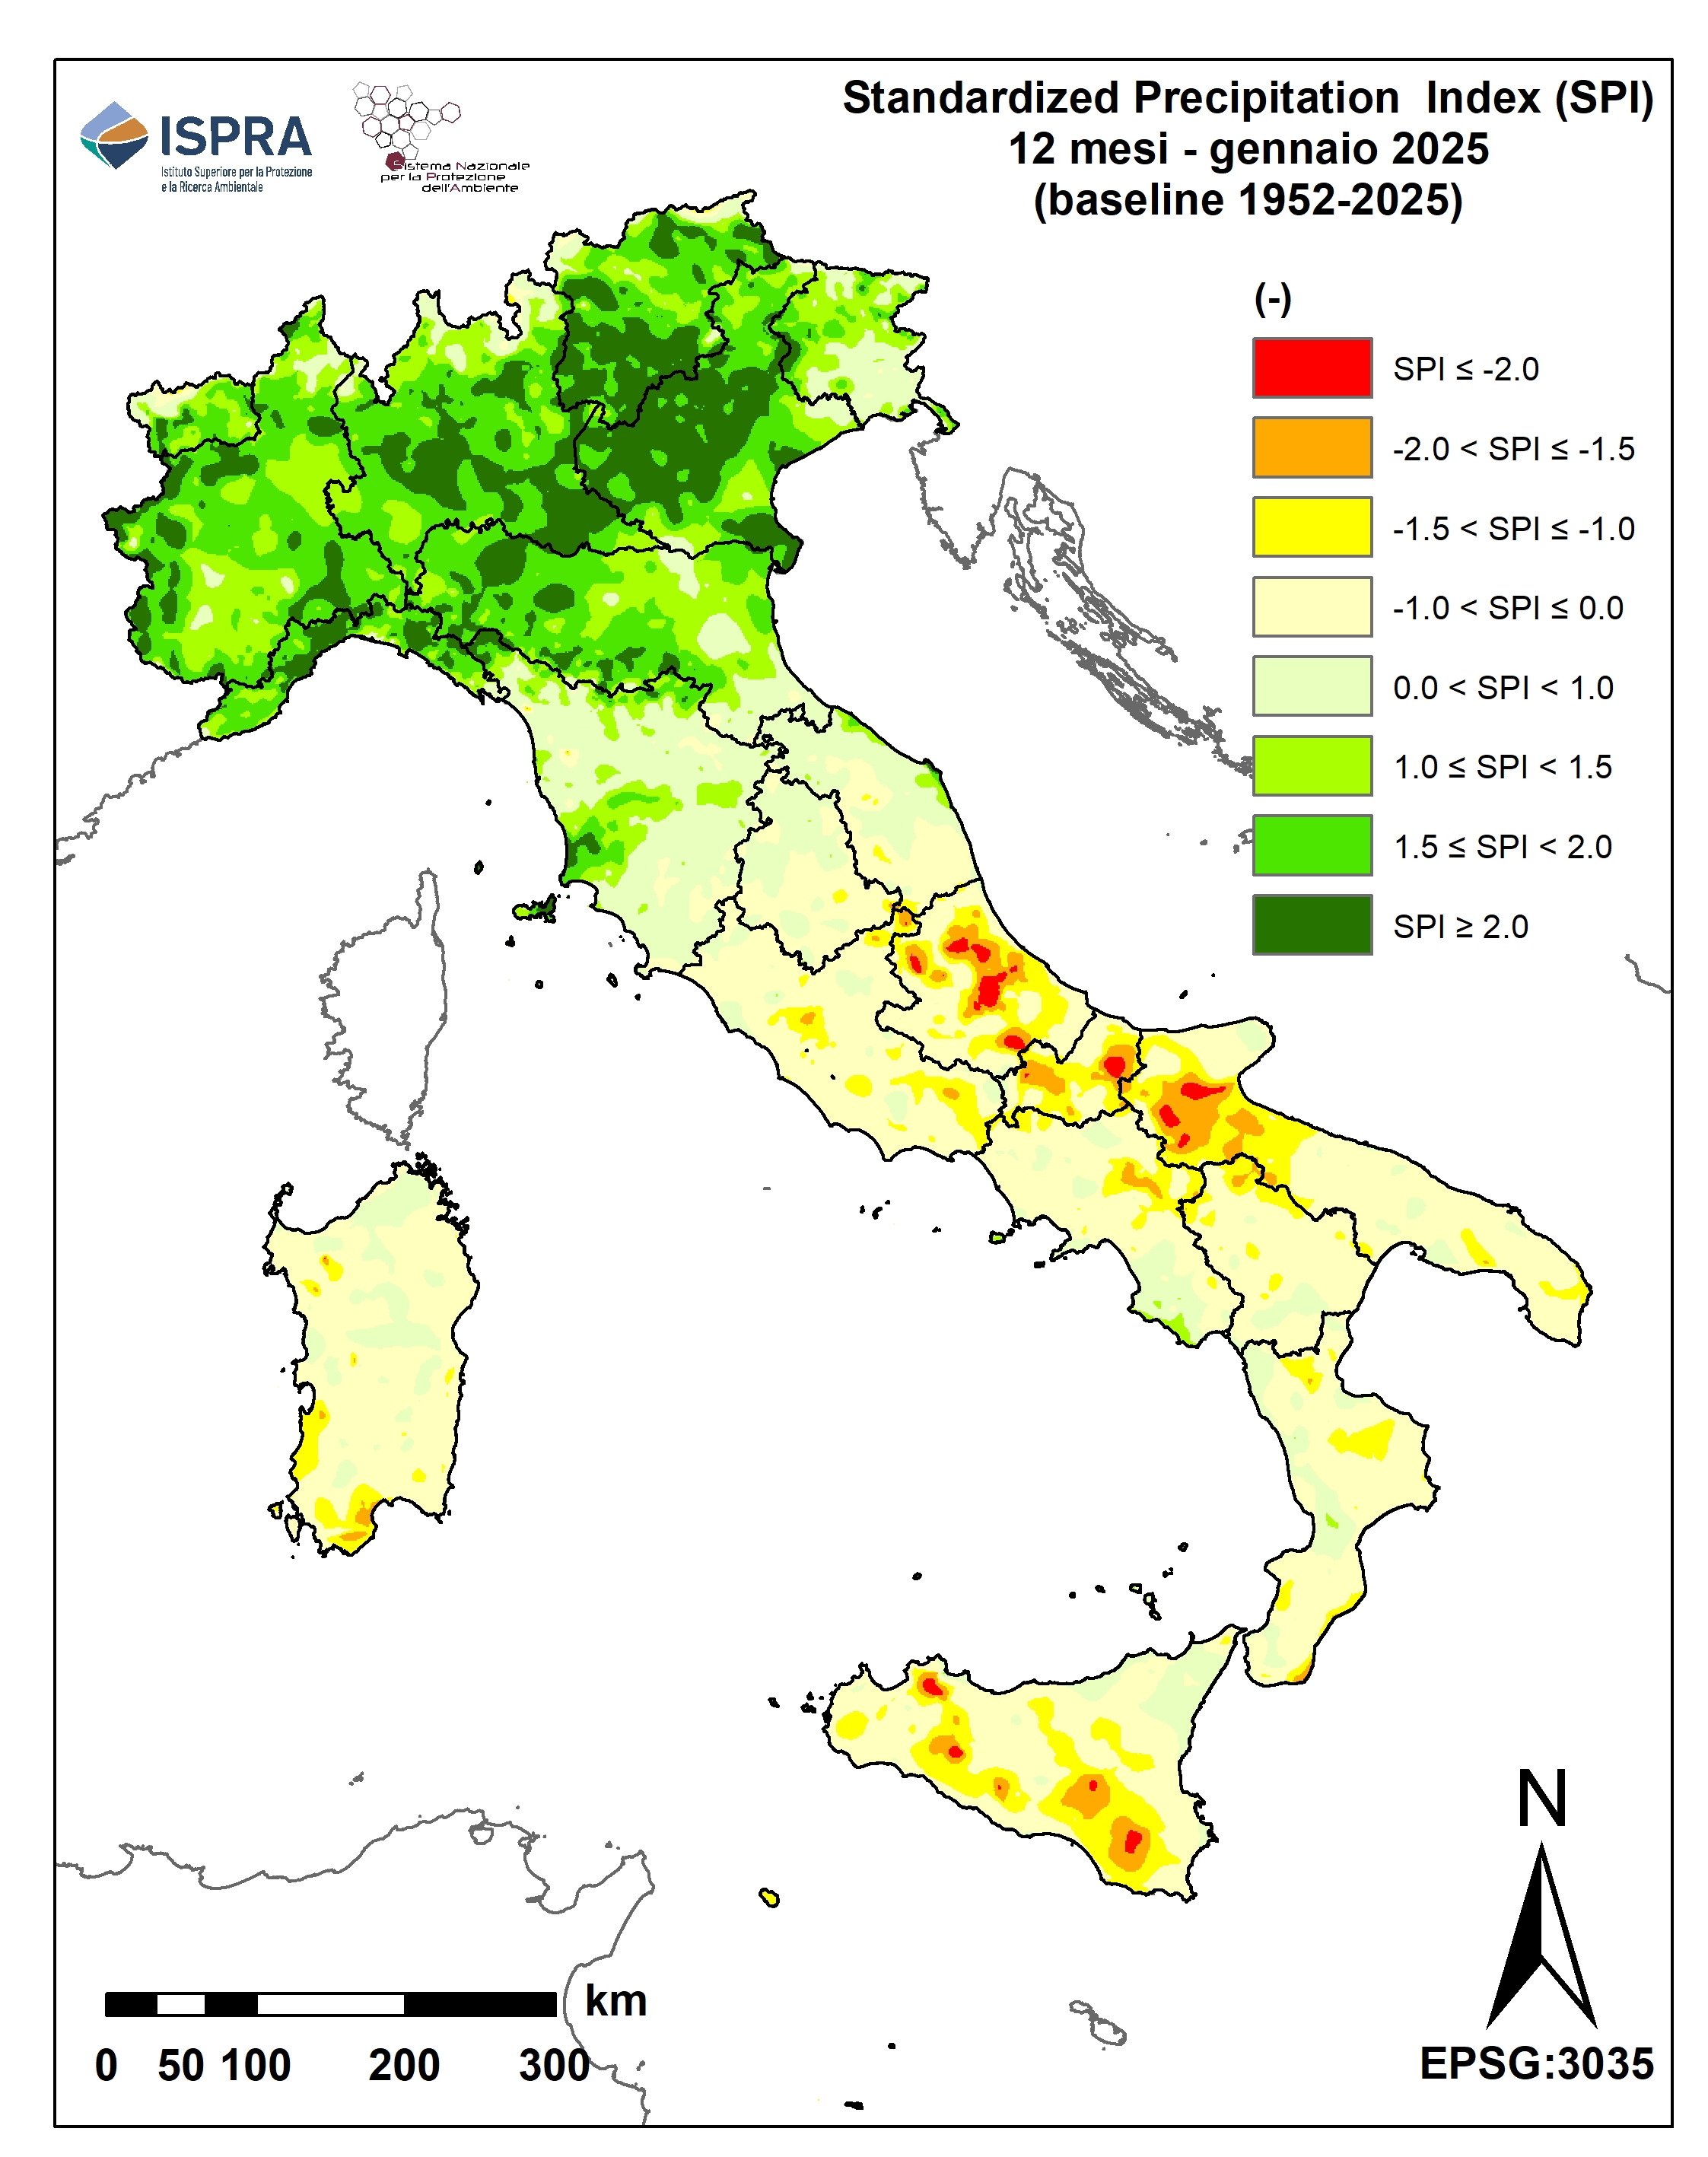
Figure 1: SPI at 12 months - January 2025 Fonte
ISPRA processing on data from regional hydro-meteorological offices and autonomous provinces and historical data from the SIMN suppressed Legenda
SPI ≥ 2.0 extreme humidity |
Thumbnail
Titolo
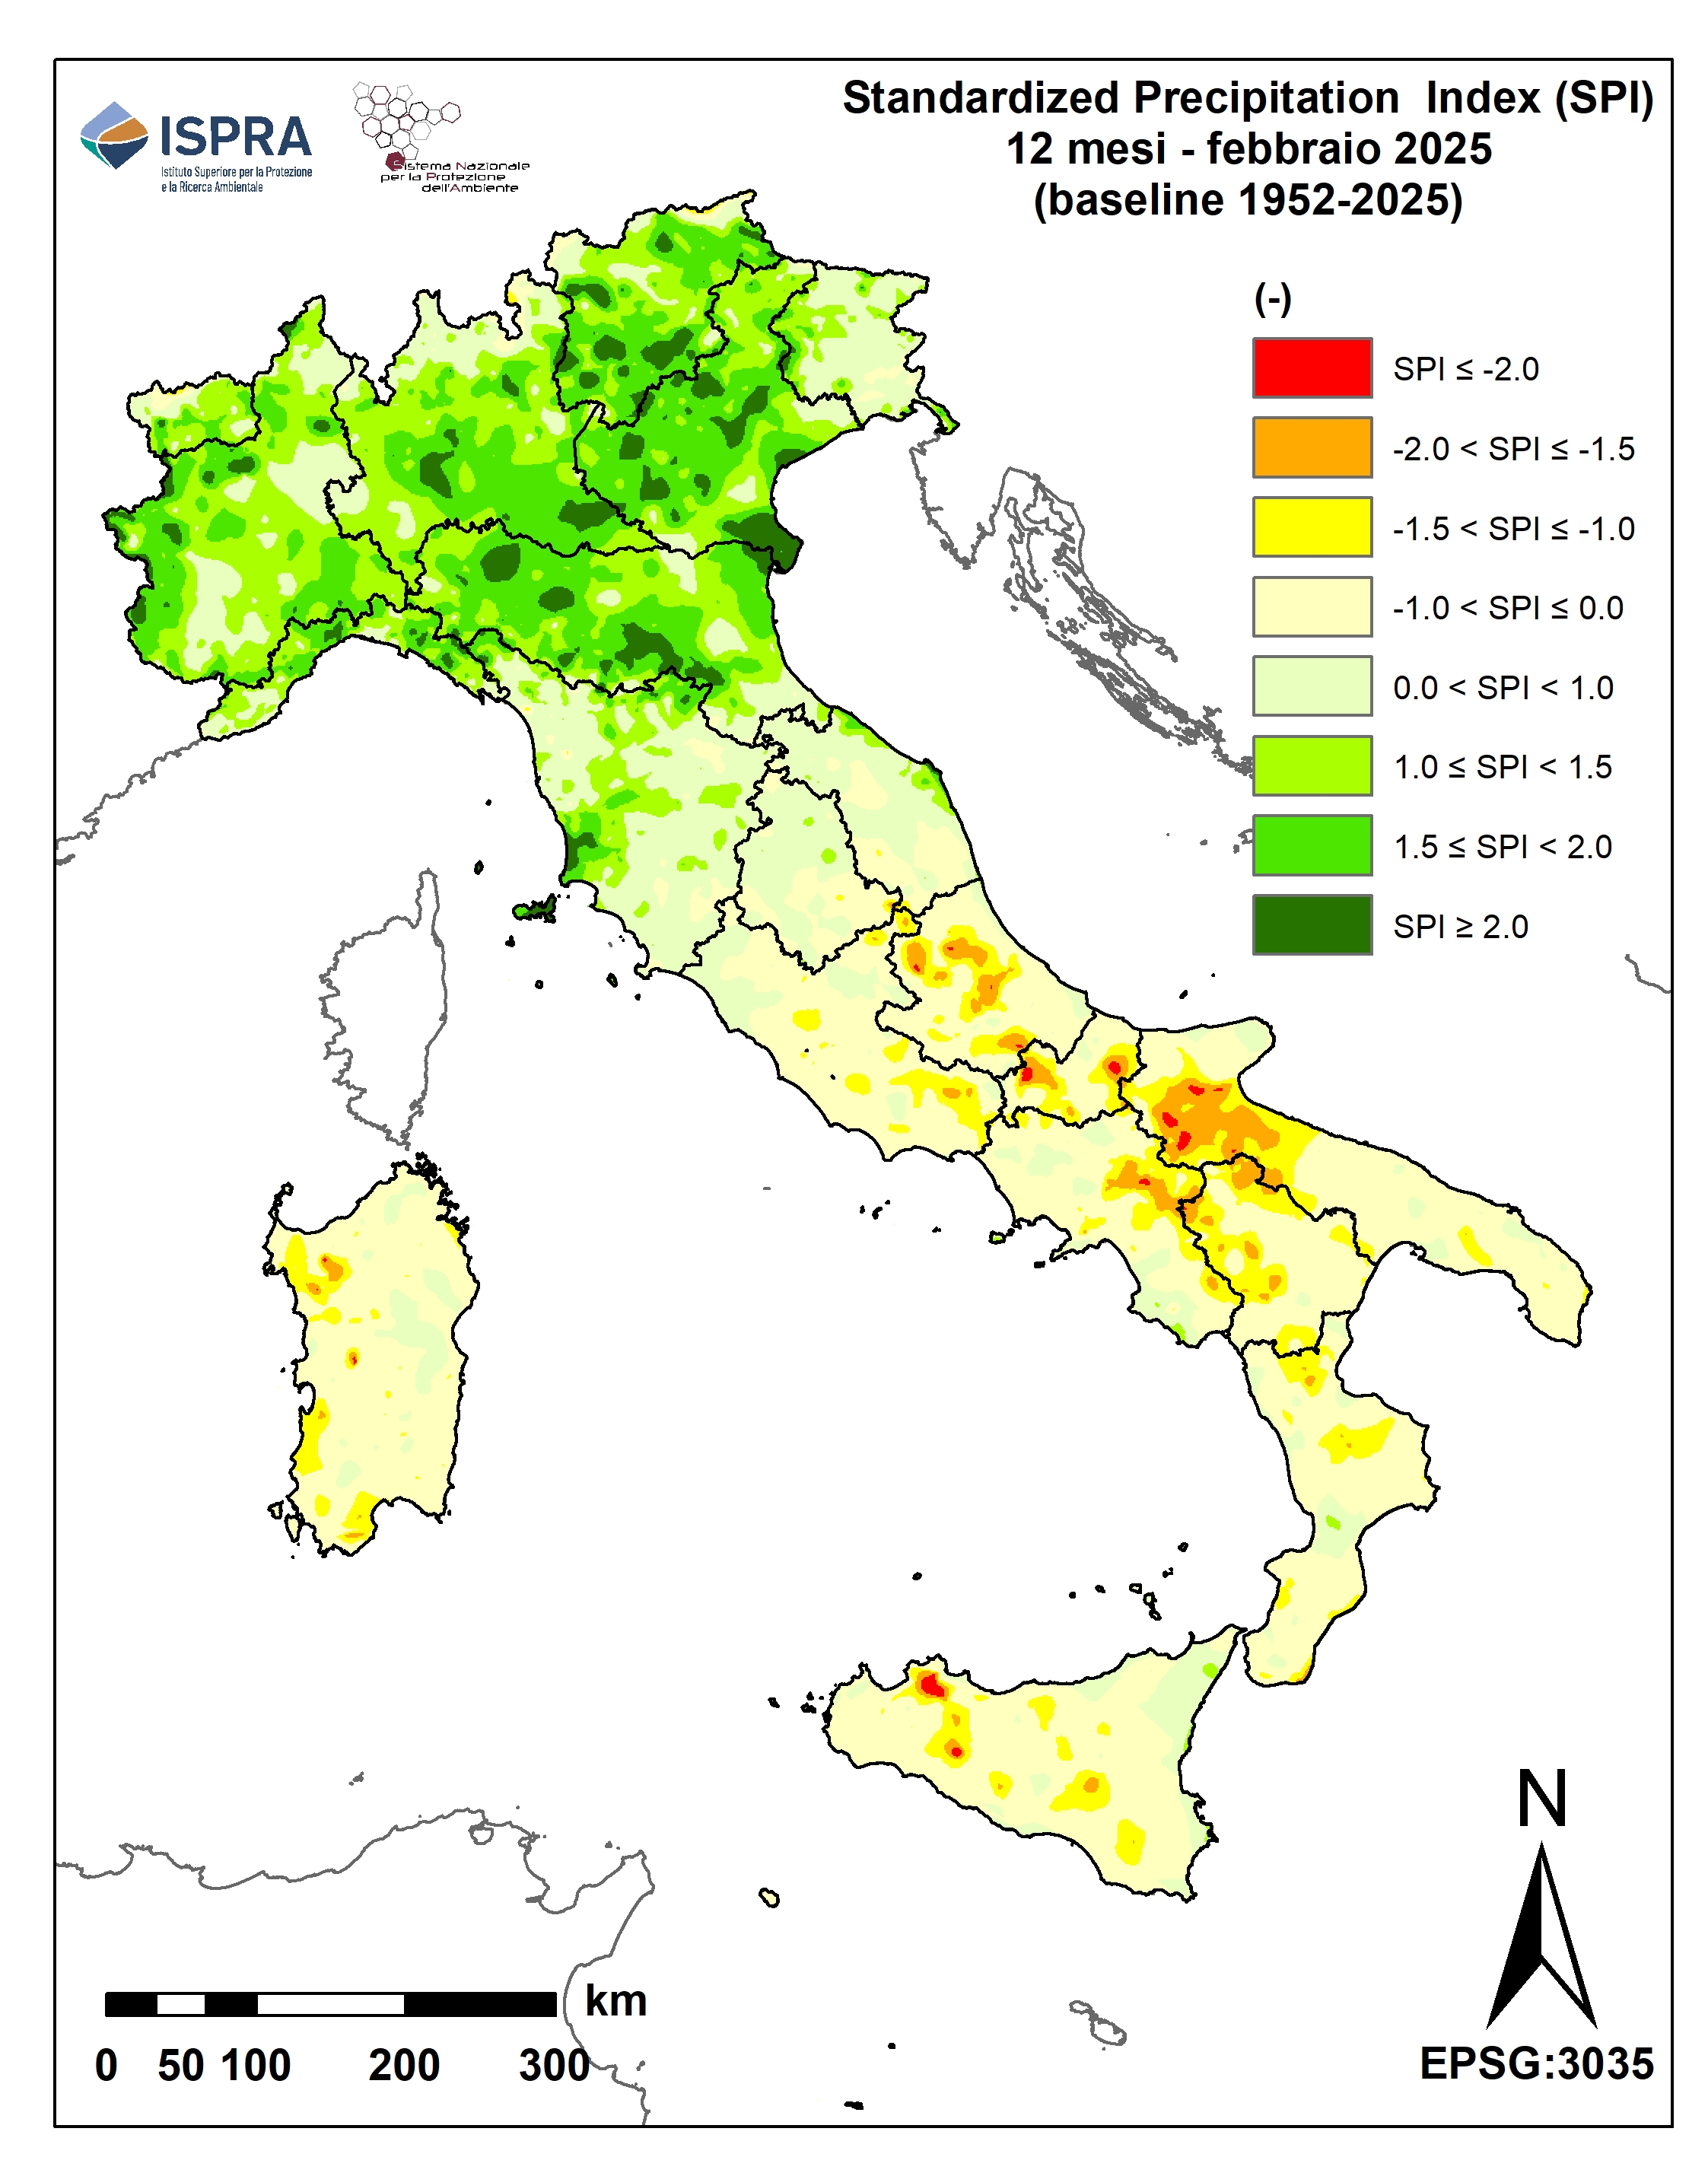
Figure 2: SPI a 12 mesi - February 2025 Fonte
ISPRA processing on data from regional hydro-meteorological offices and autonomous provinces and historical data from the SIMN suppressed Legenda
|
Thumbnail
Titolo
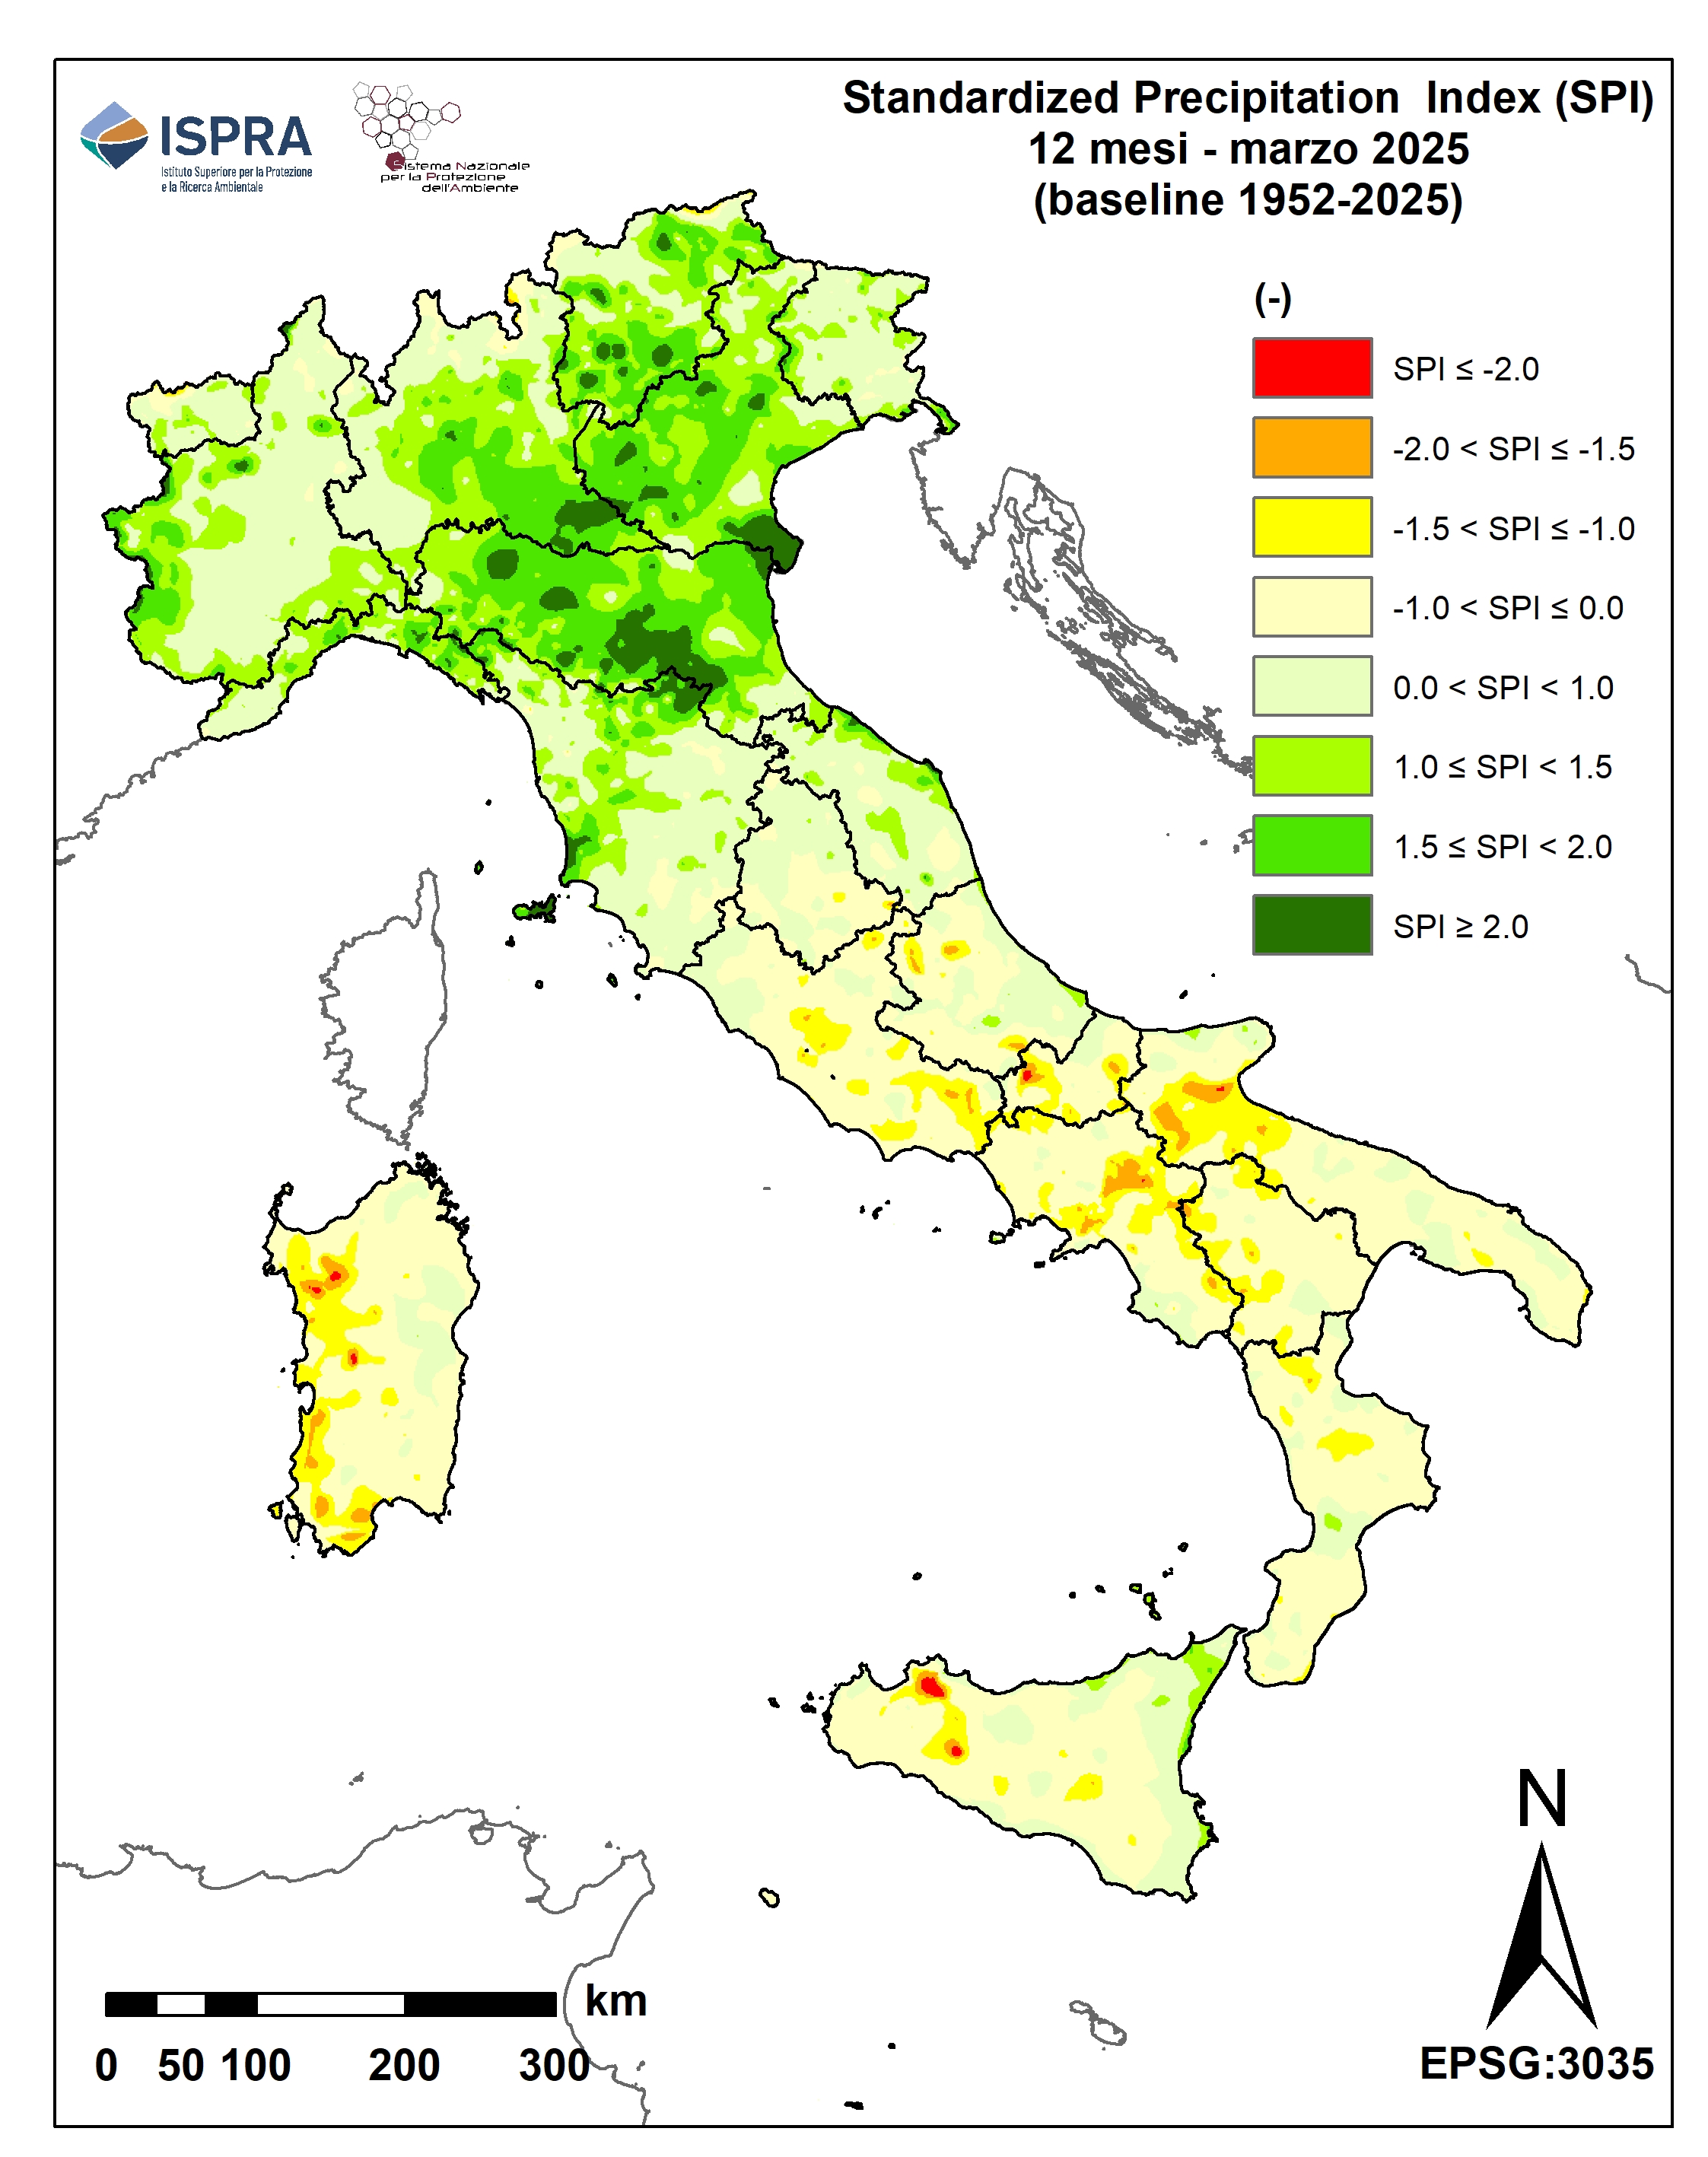
Figure 3: 12-month SPI - March 2025 Fonte
ISPRA processing on data from regional hydro-meteorological offices and autonomous provinces and historical data from the SIMN suppressed Legenda
|
Thumbnail
Titolo
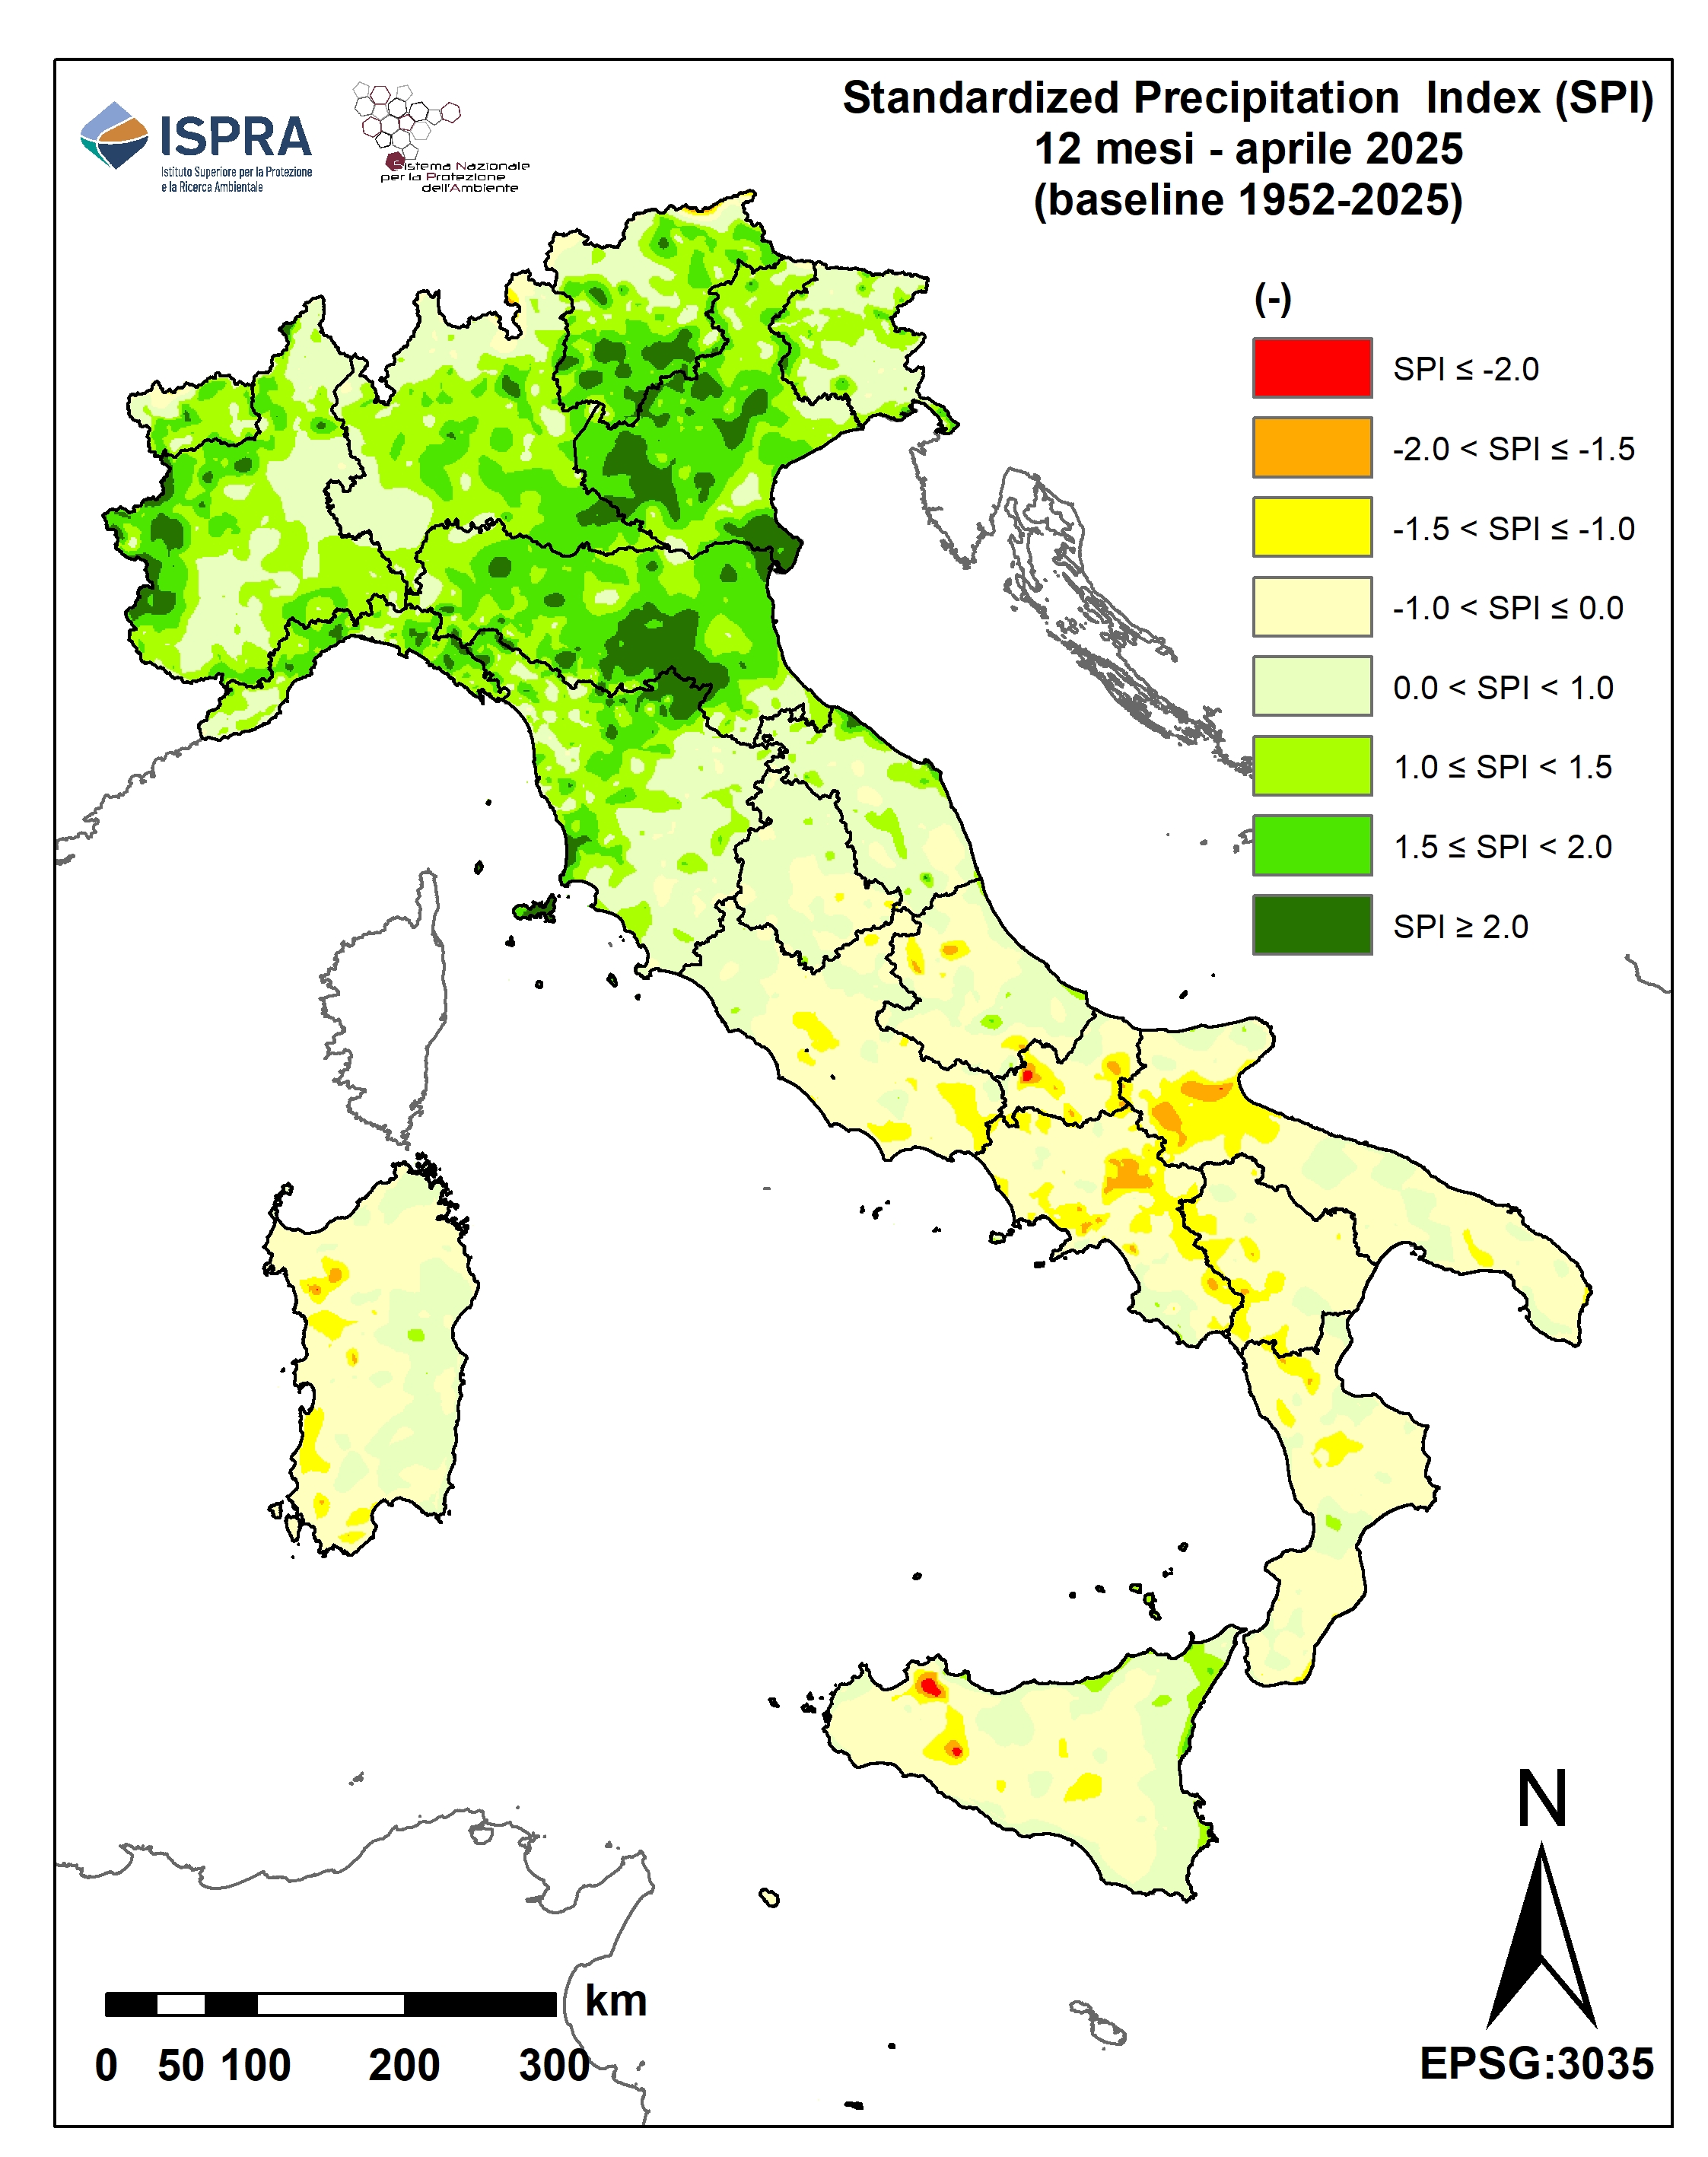
Figure 4: 12-month SPI - April 2025 Fonte
ISPRA processing on data from regional hydro-meteorological offices and autonomous provinces and historical data from the SIMN suppressed Legenda
|
Thumbnail
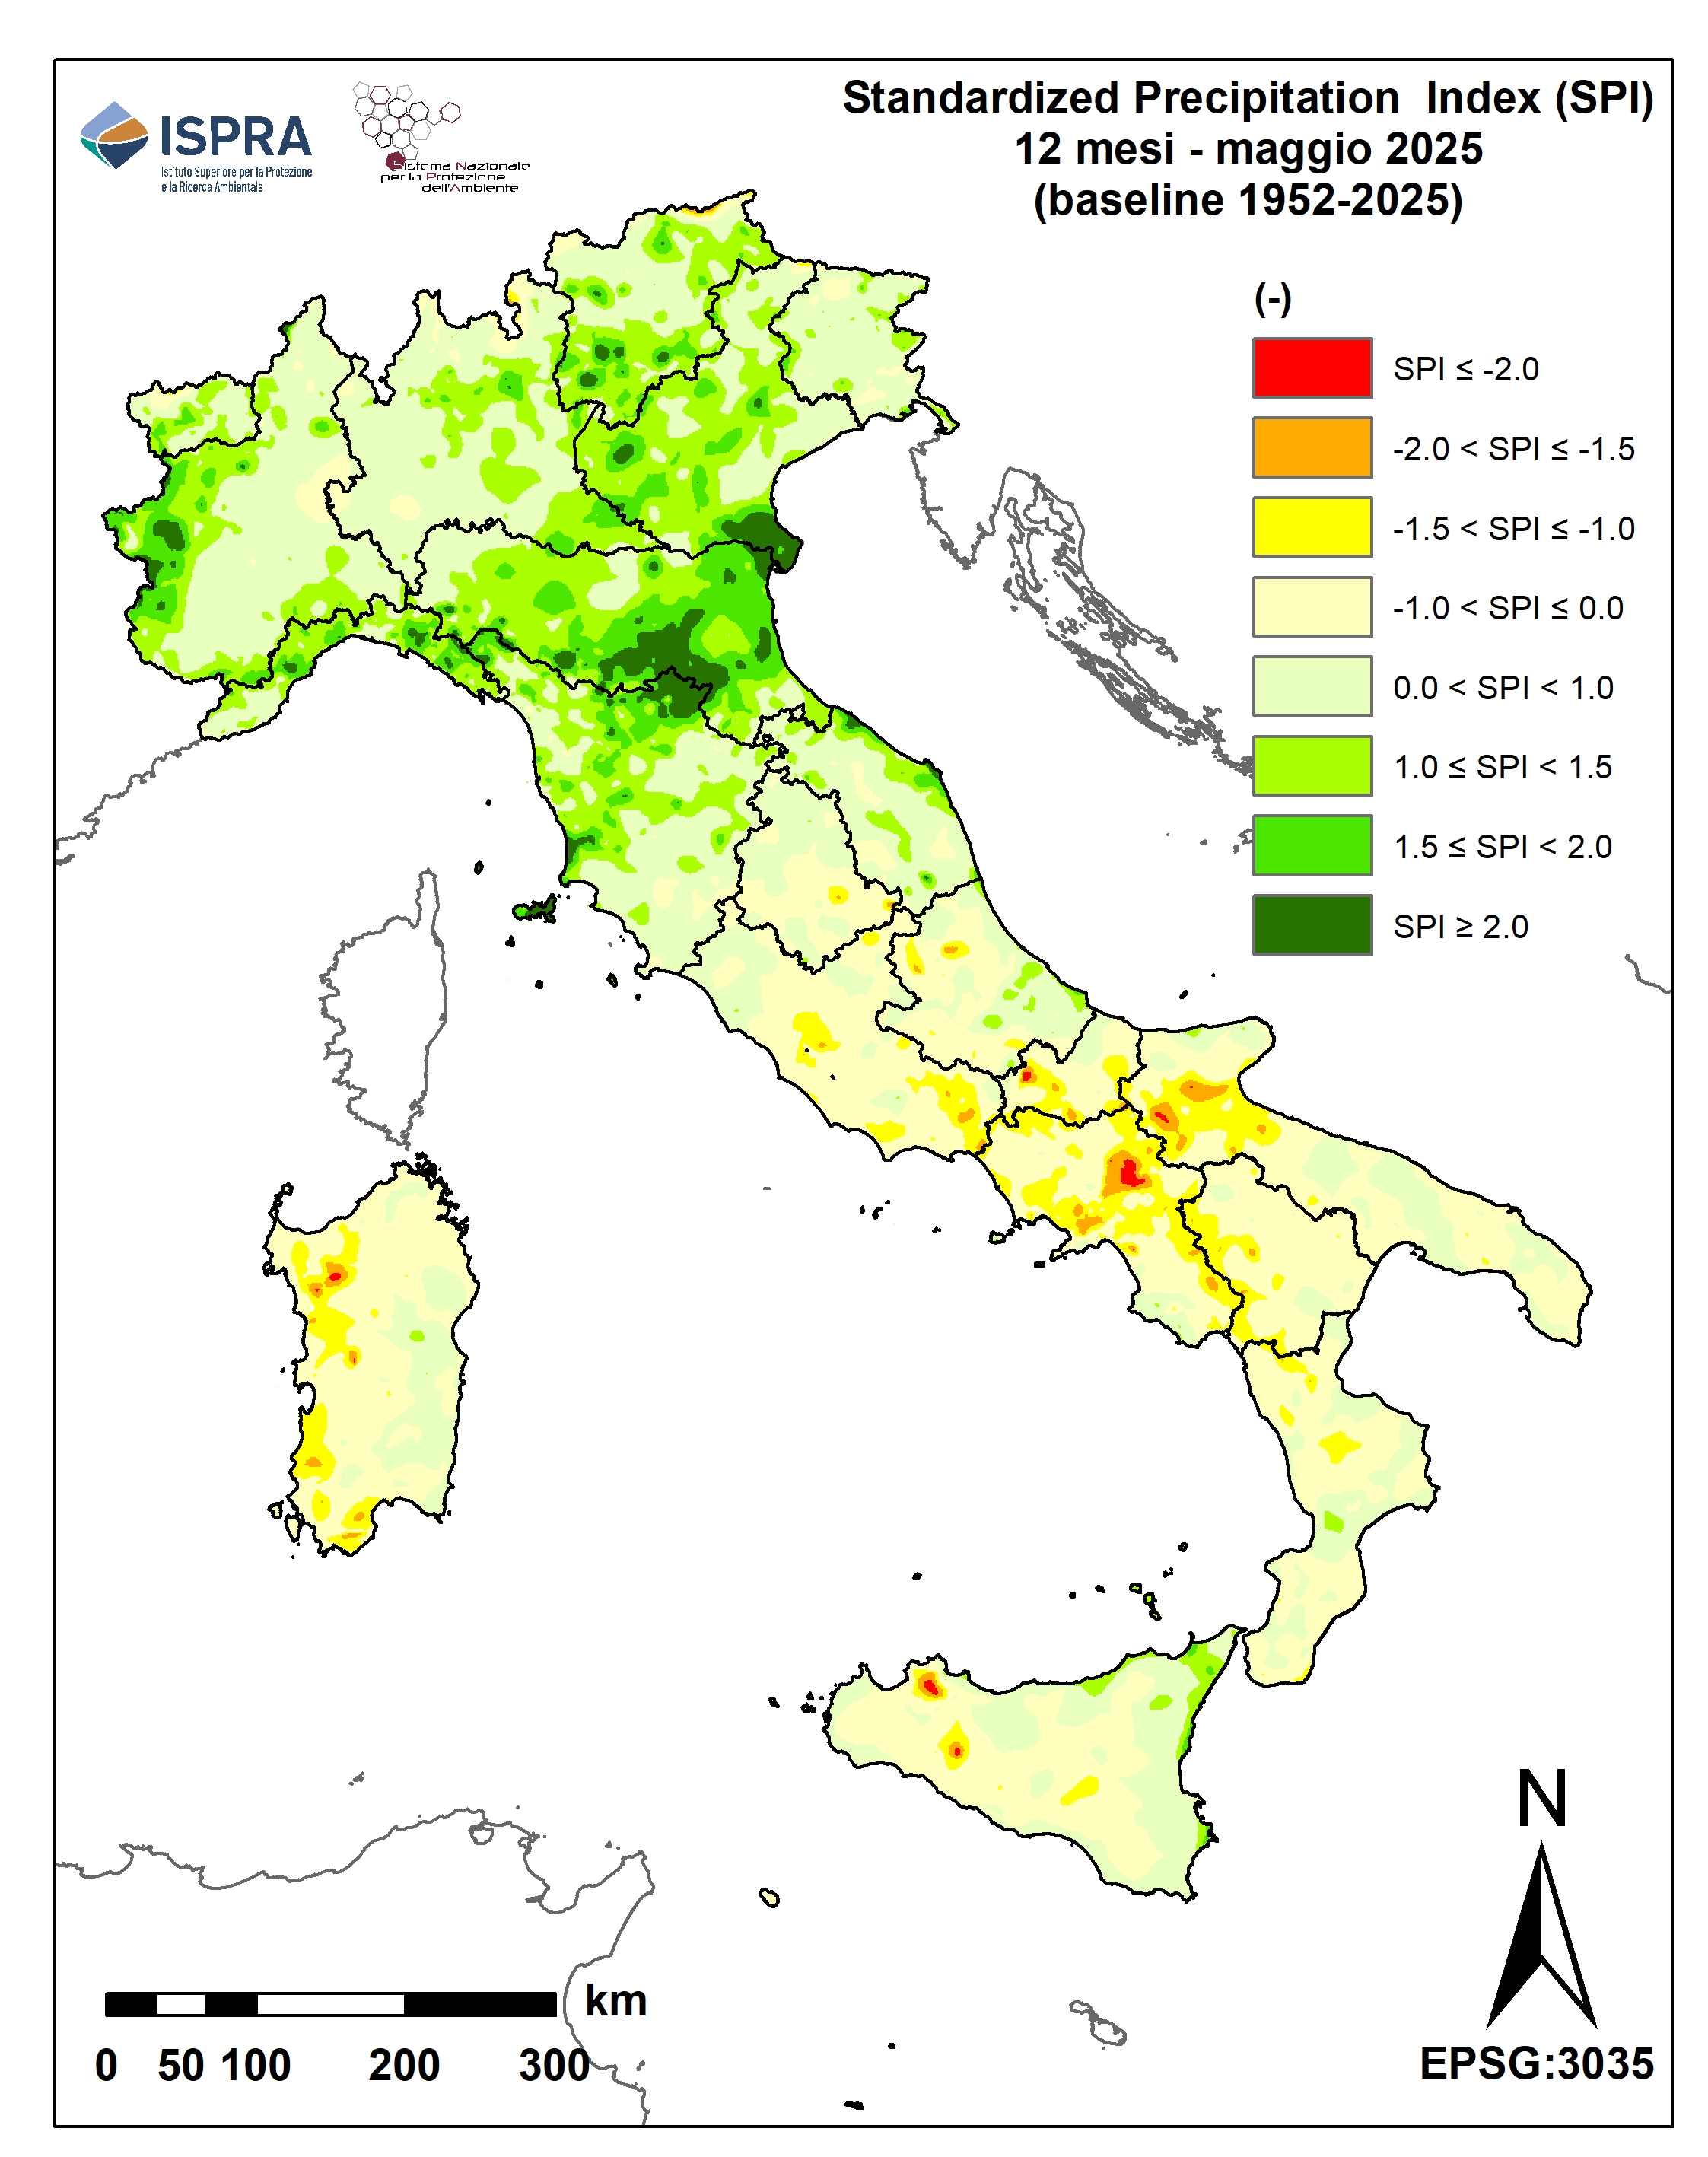
Titolo
Figure 5: 12-month SPI - May 2025 Fonte
ISPRA processing on data from regional hydro-meteorological offices and autonomous provinces and historical data from the SIMN suppressed Legenda
|
Thumbnail
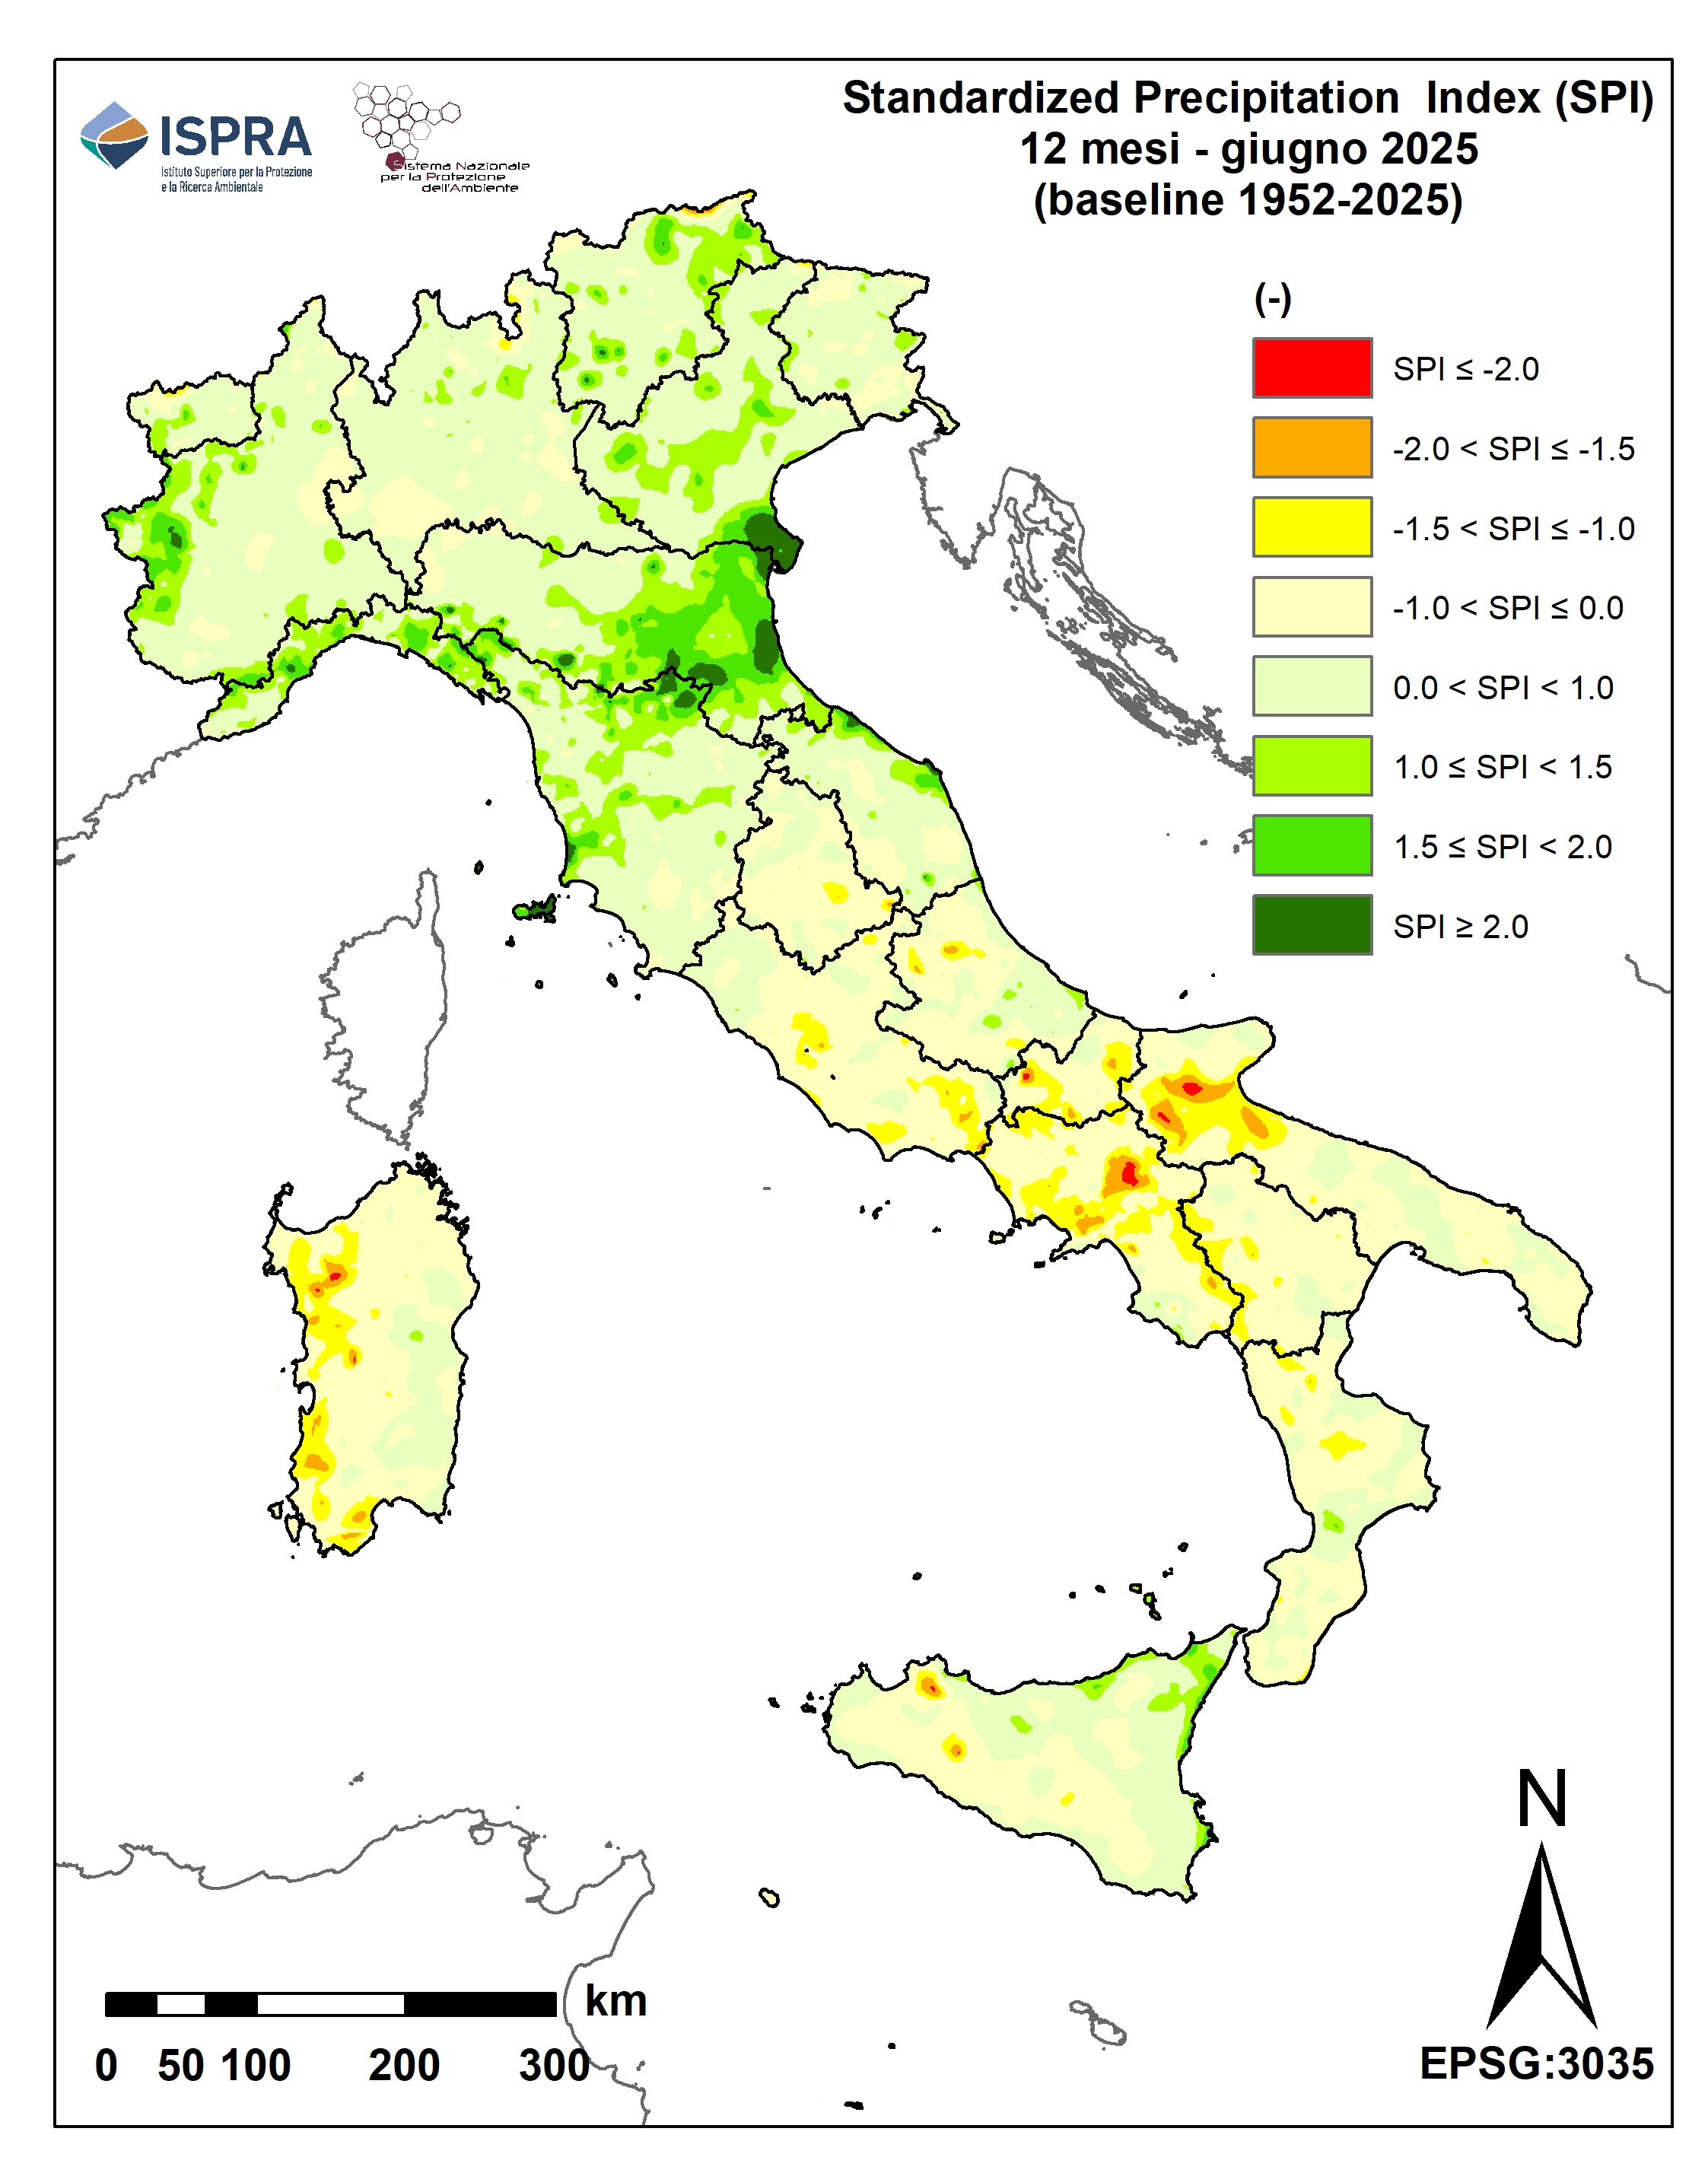
Titolo
Figure 6: 12-month SPI - June 2025 Fonte
ISPRA processing on data from regional hydro-meteorological offices and autonomous provinces and historical data from the SIMN suppressed Legenda
SPI ≥ 2.0 extreme humidity 1,5 ≤ SPI < 2.0 severe humidity 1.0 ≤ SPI < 1.5 moderate humidity ‒1,0 < SPI < 1.0 in the standard ‒1.5 < SPI ≤ ‒1.0 moderate drought ‒2.0 < SPI ≤ ‒1.5 severe drought SPI ≤ ‒2.0 extreme drought |
Thumbnail
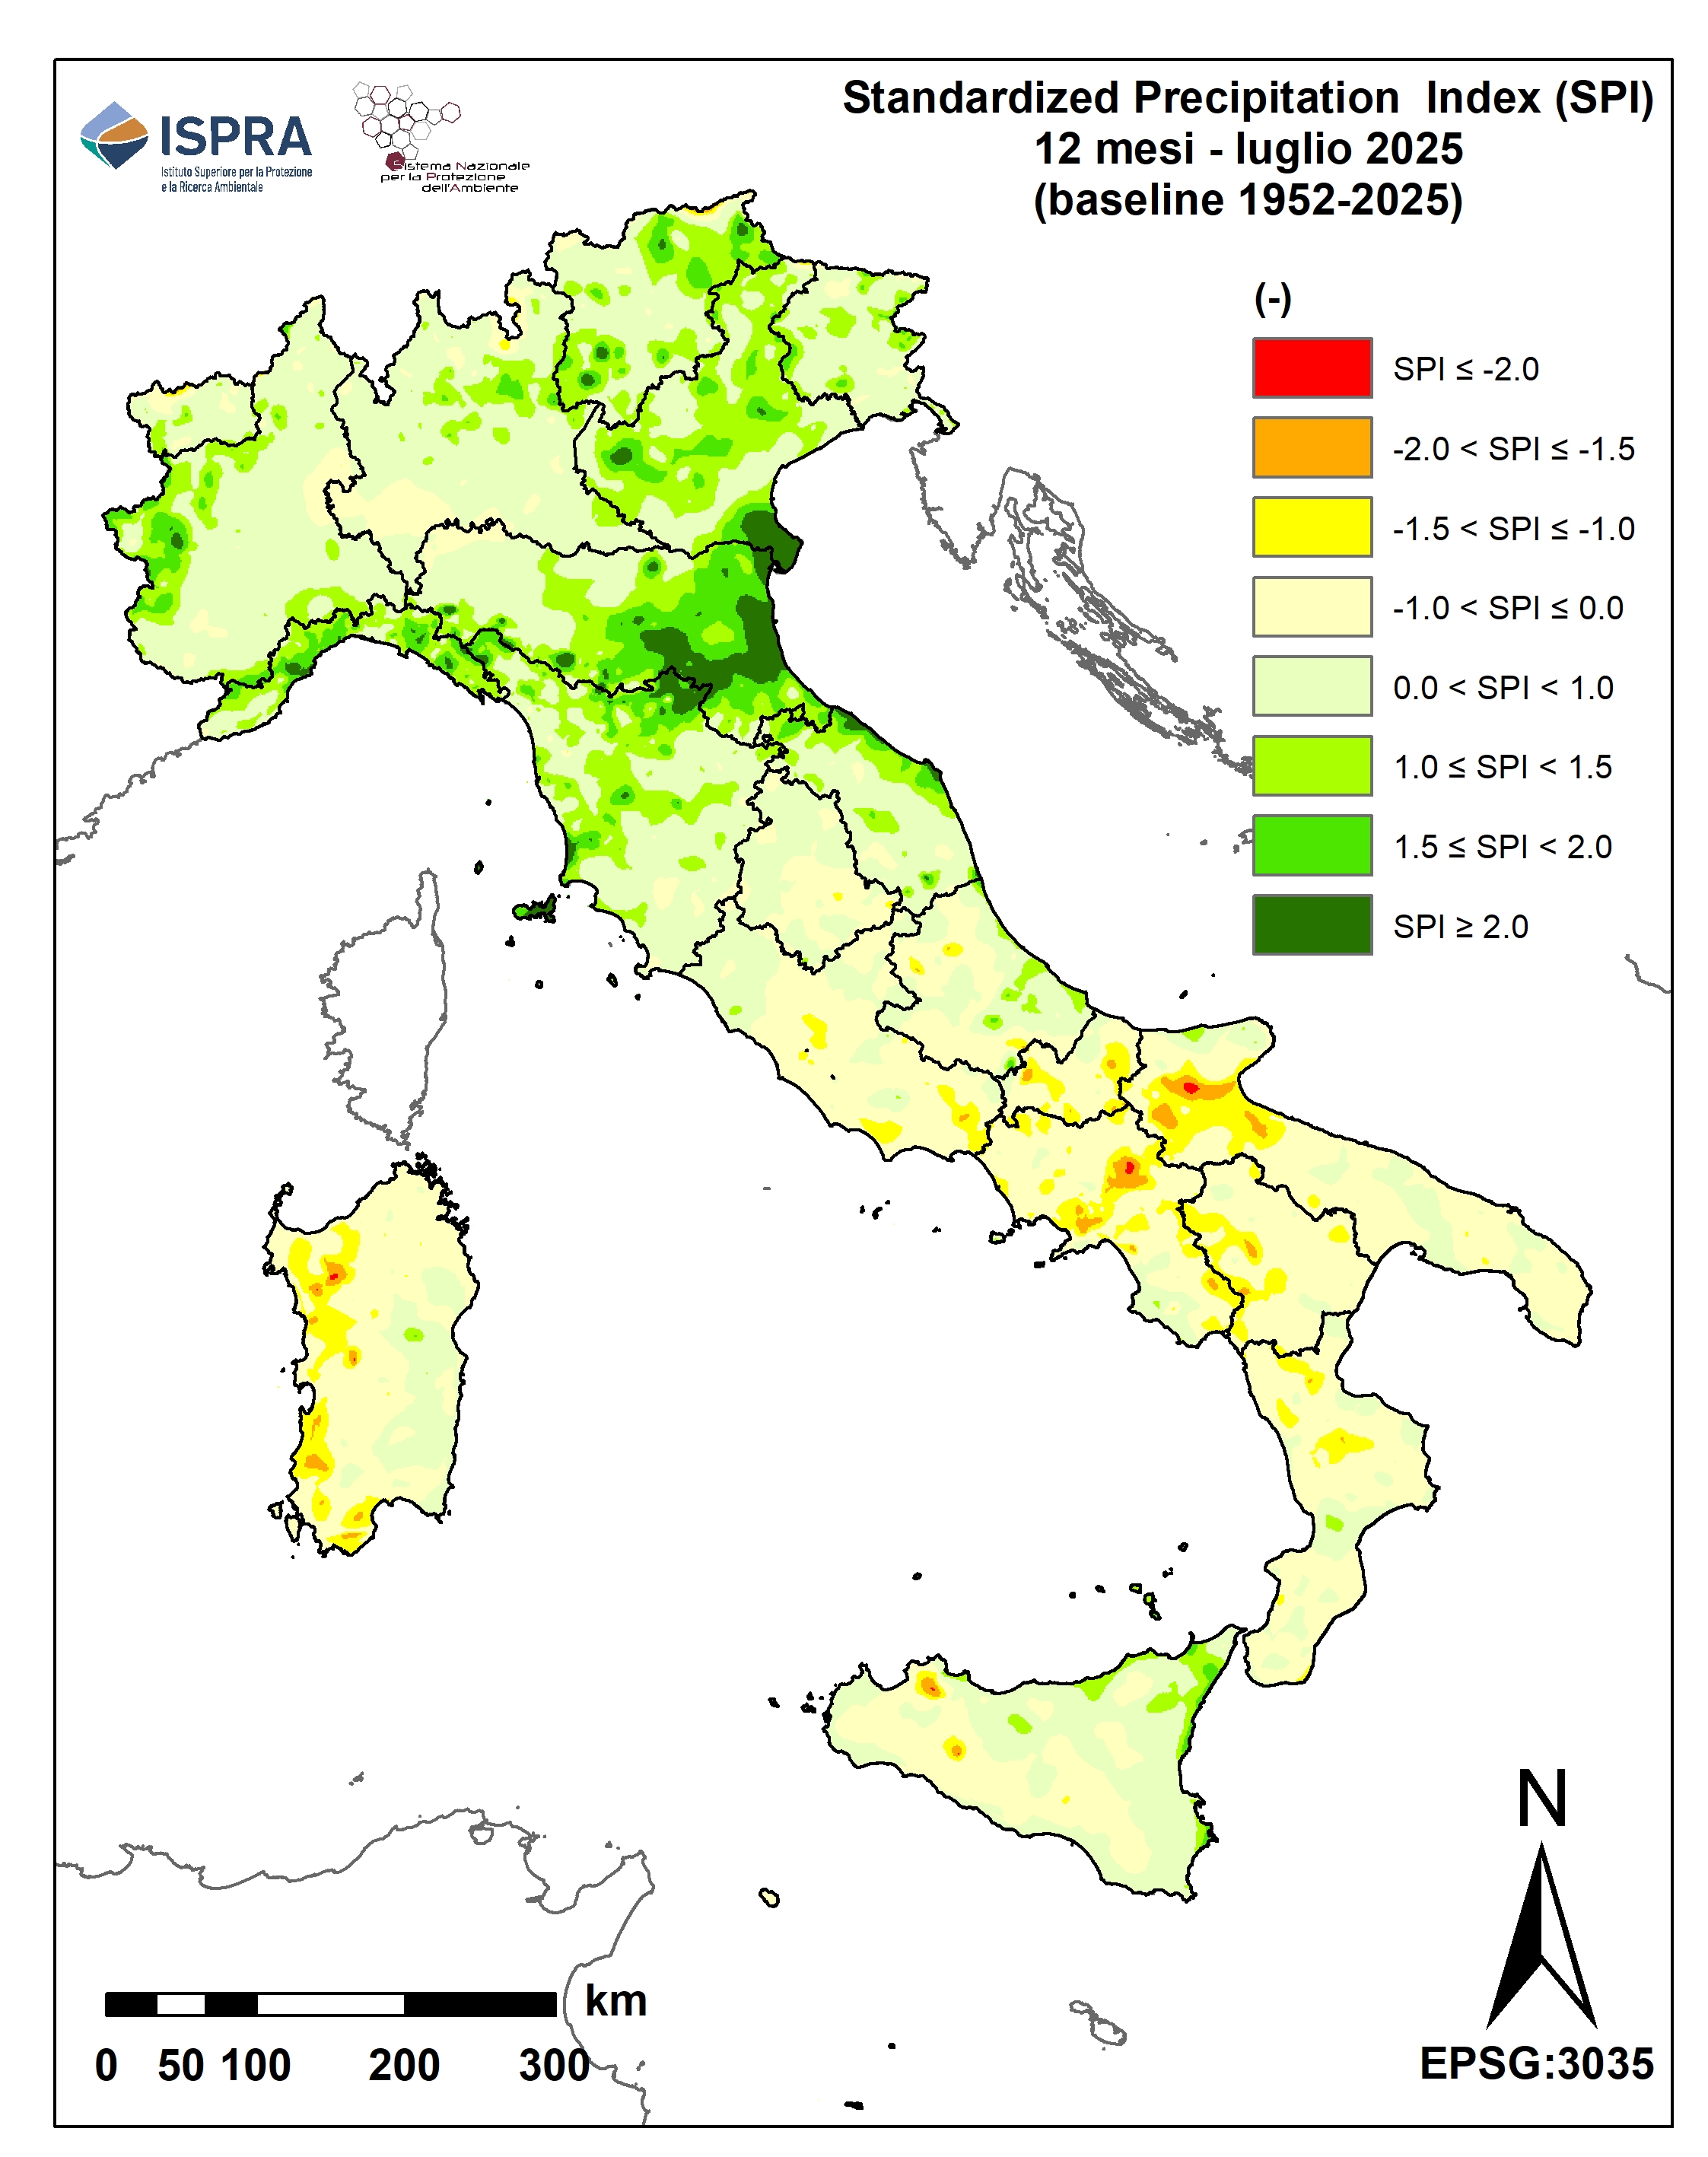
Titolo
Figure 7: 12-month SPI - July 2025 Fonte
ISPRA processing on data from regional hydro-meteorological offices and autonomous provinces and historical data from the SIMN suppressed Legenda
|
Thumbnail
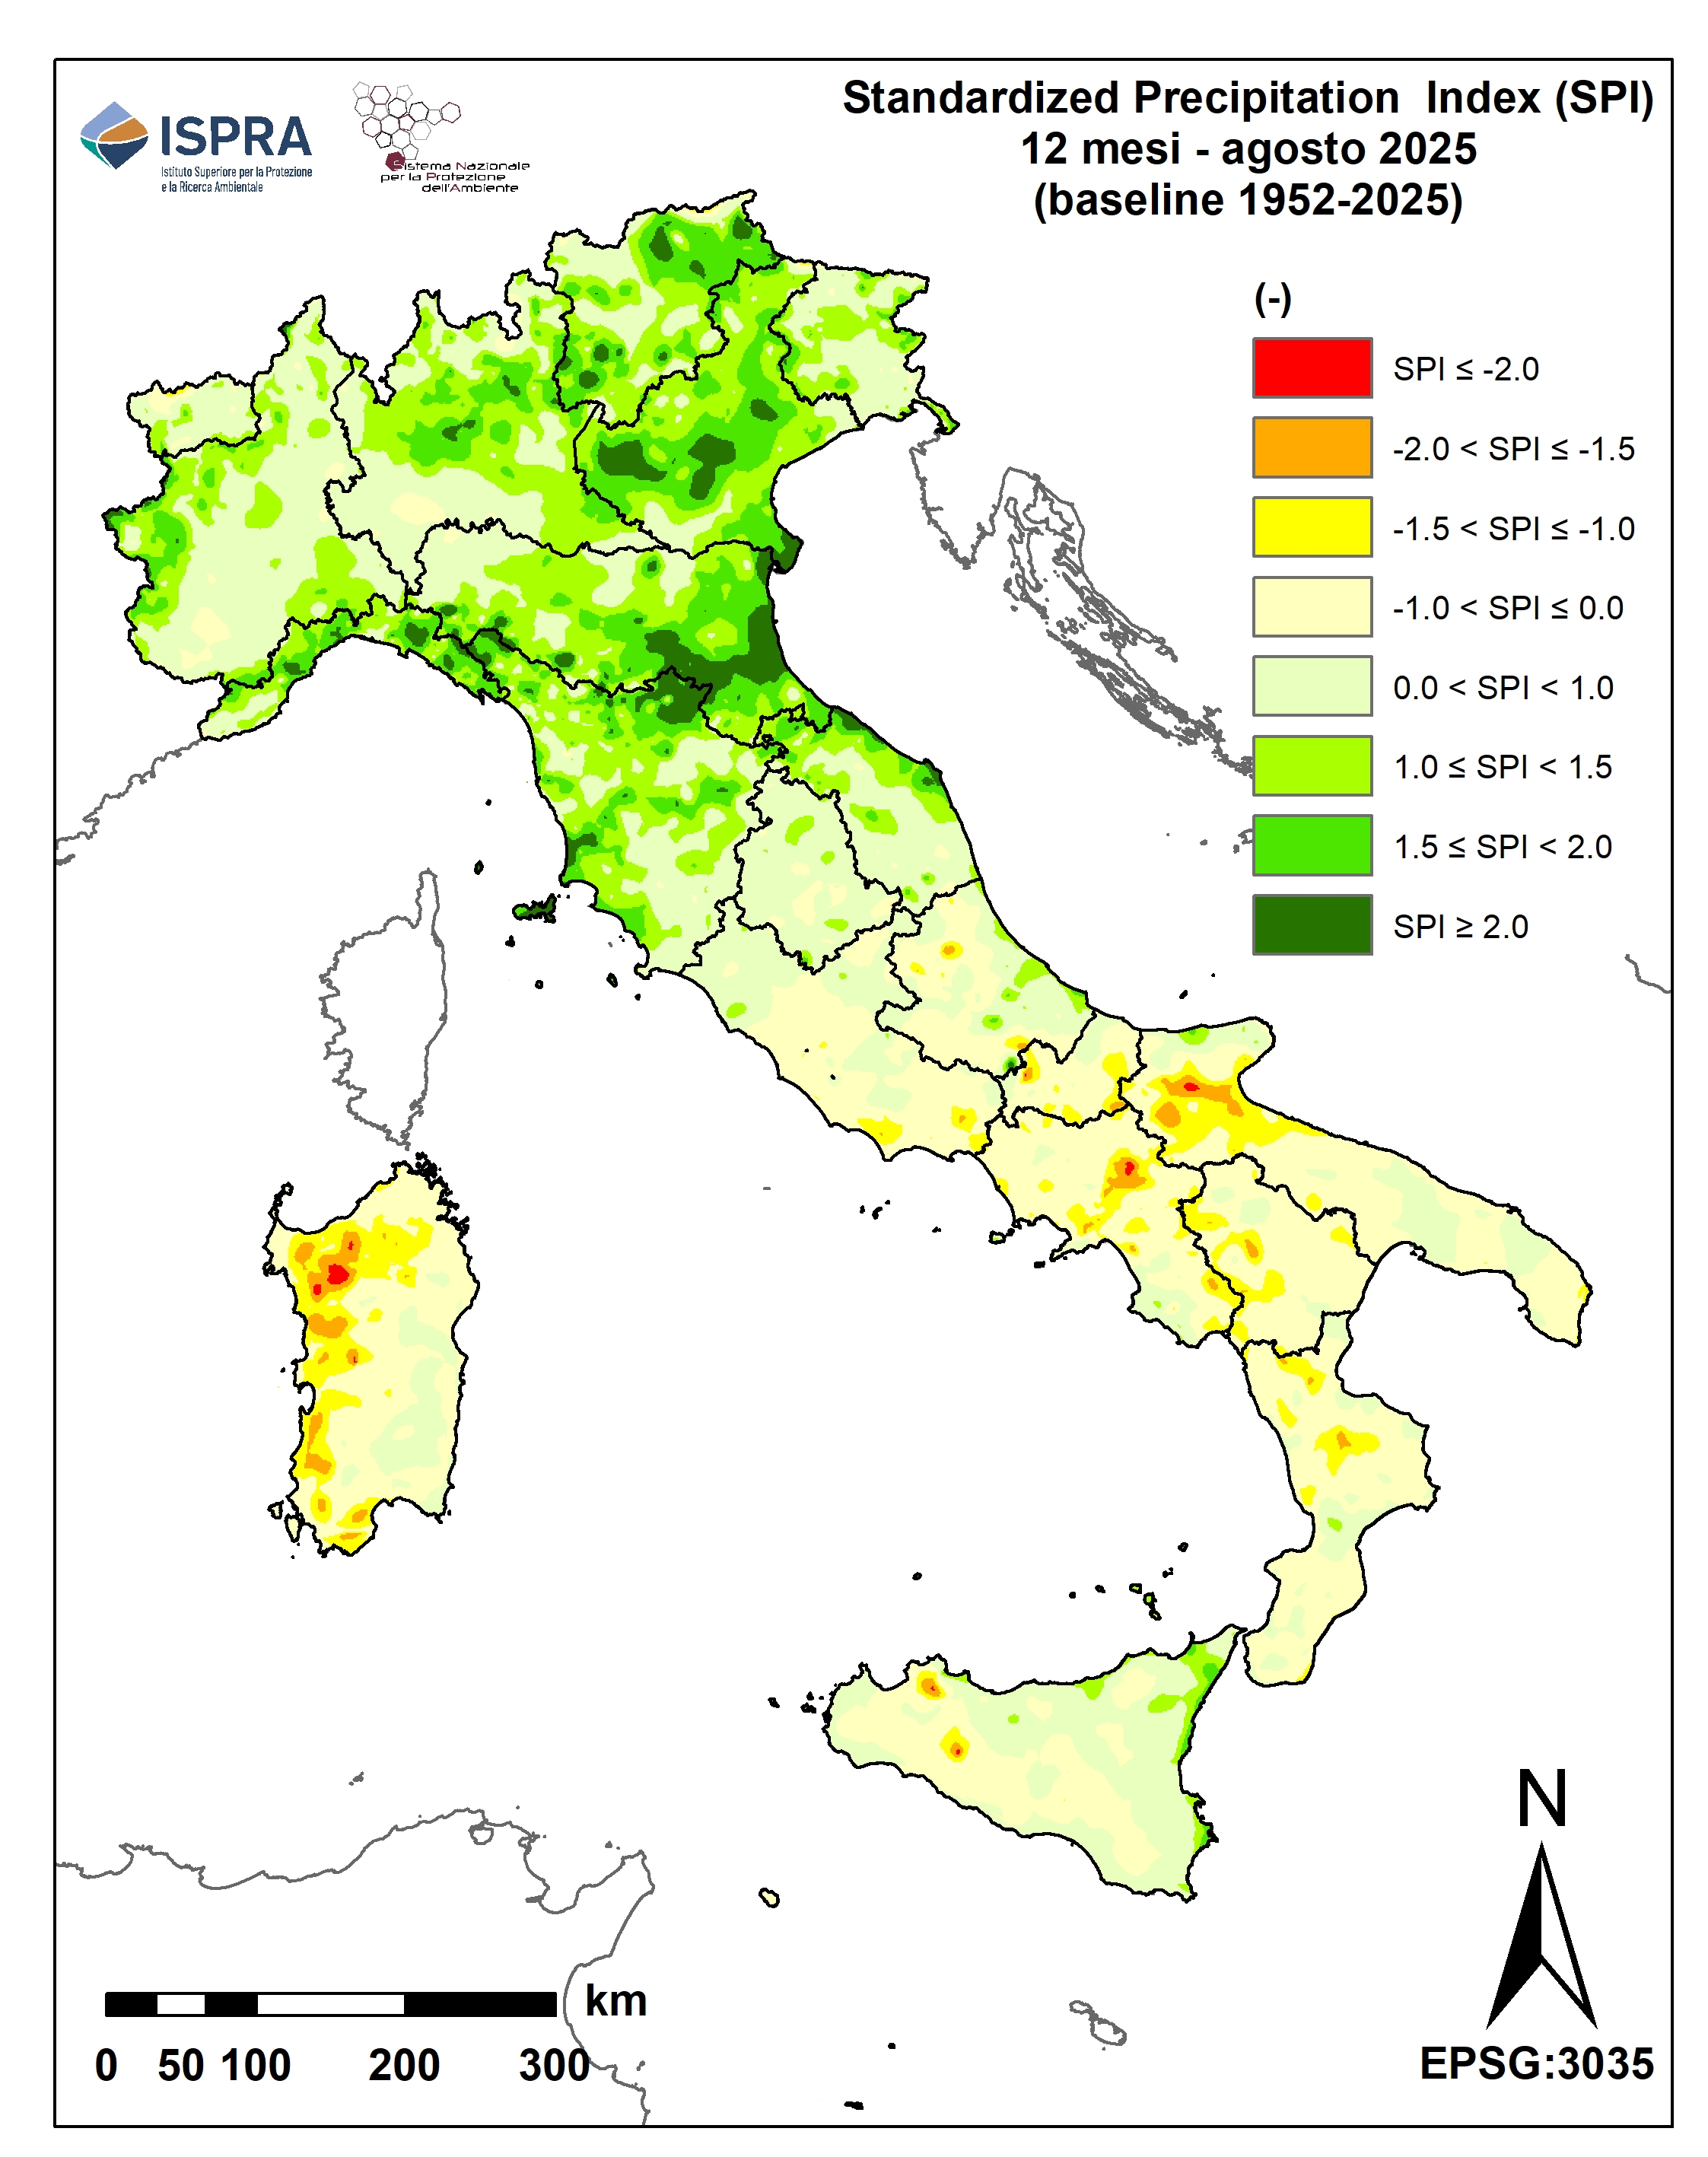
Titolo
Figure 8: 12-month SPI - August 2025 Fonte
ISPRA processing on data from regional hydro-meteorological offices and autonomous provinces and historical data from the SIMN suppressed Legenda
|
Thumbnail
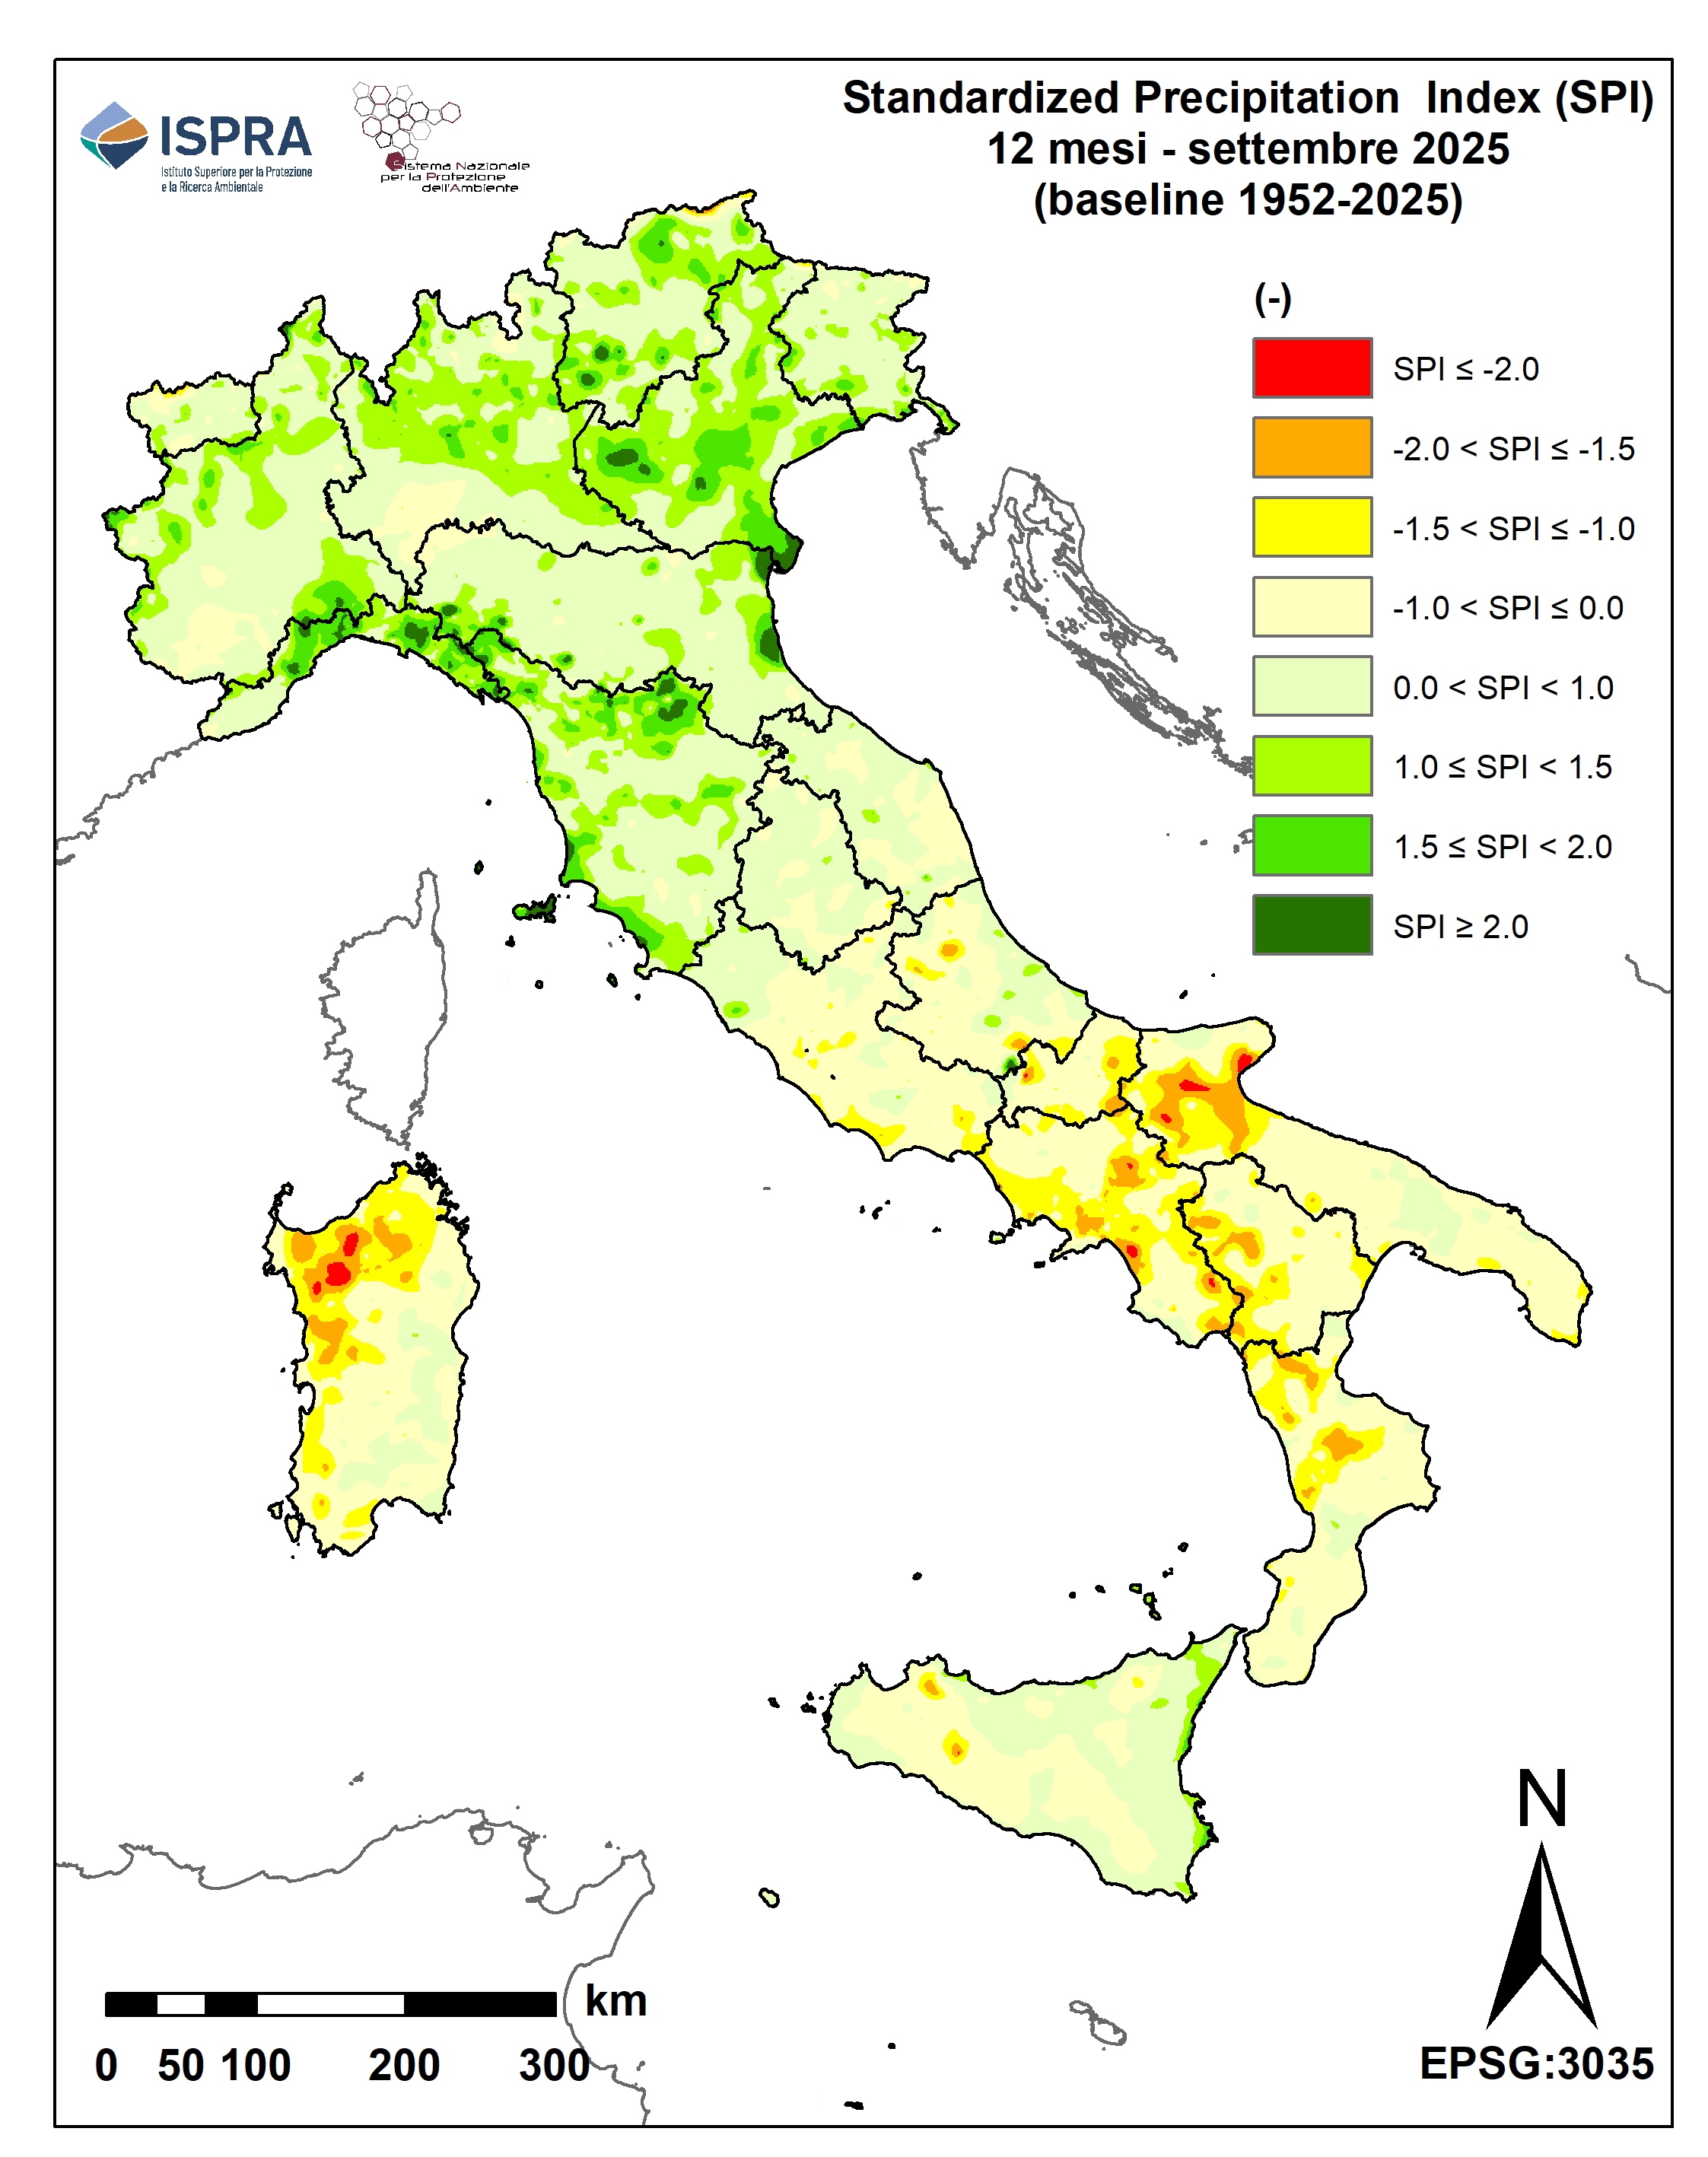
Titolo
Figure 9: 12-month SPI - September 2025 Fonte
ISPRA processing on data from regional hydro-meteorological offices and autonomous provinces and historical data from the SIMN suppressed Legenda
|
Thumbnail
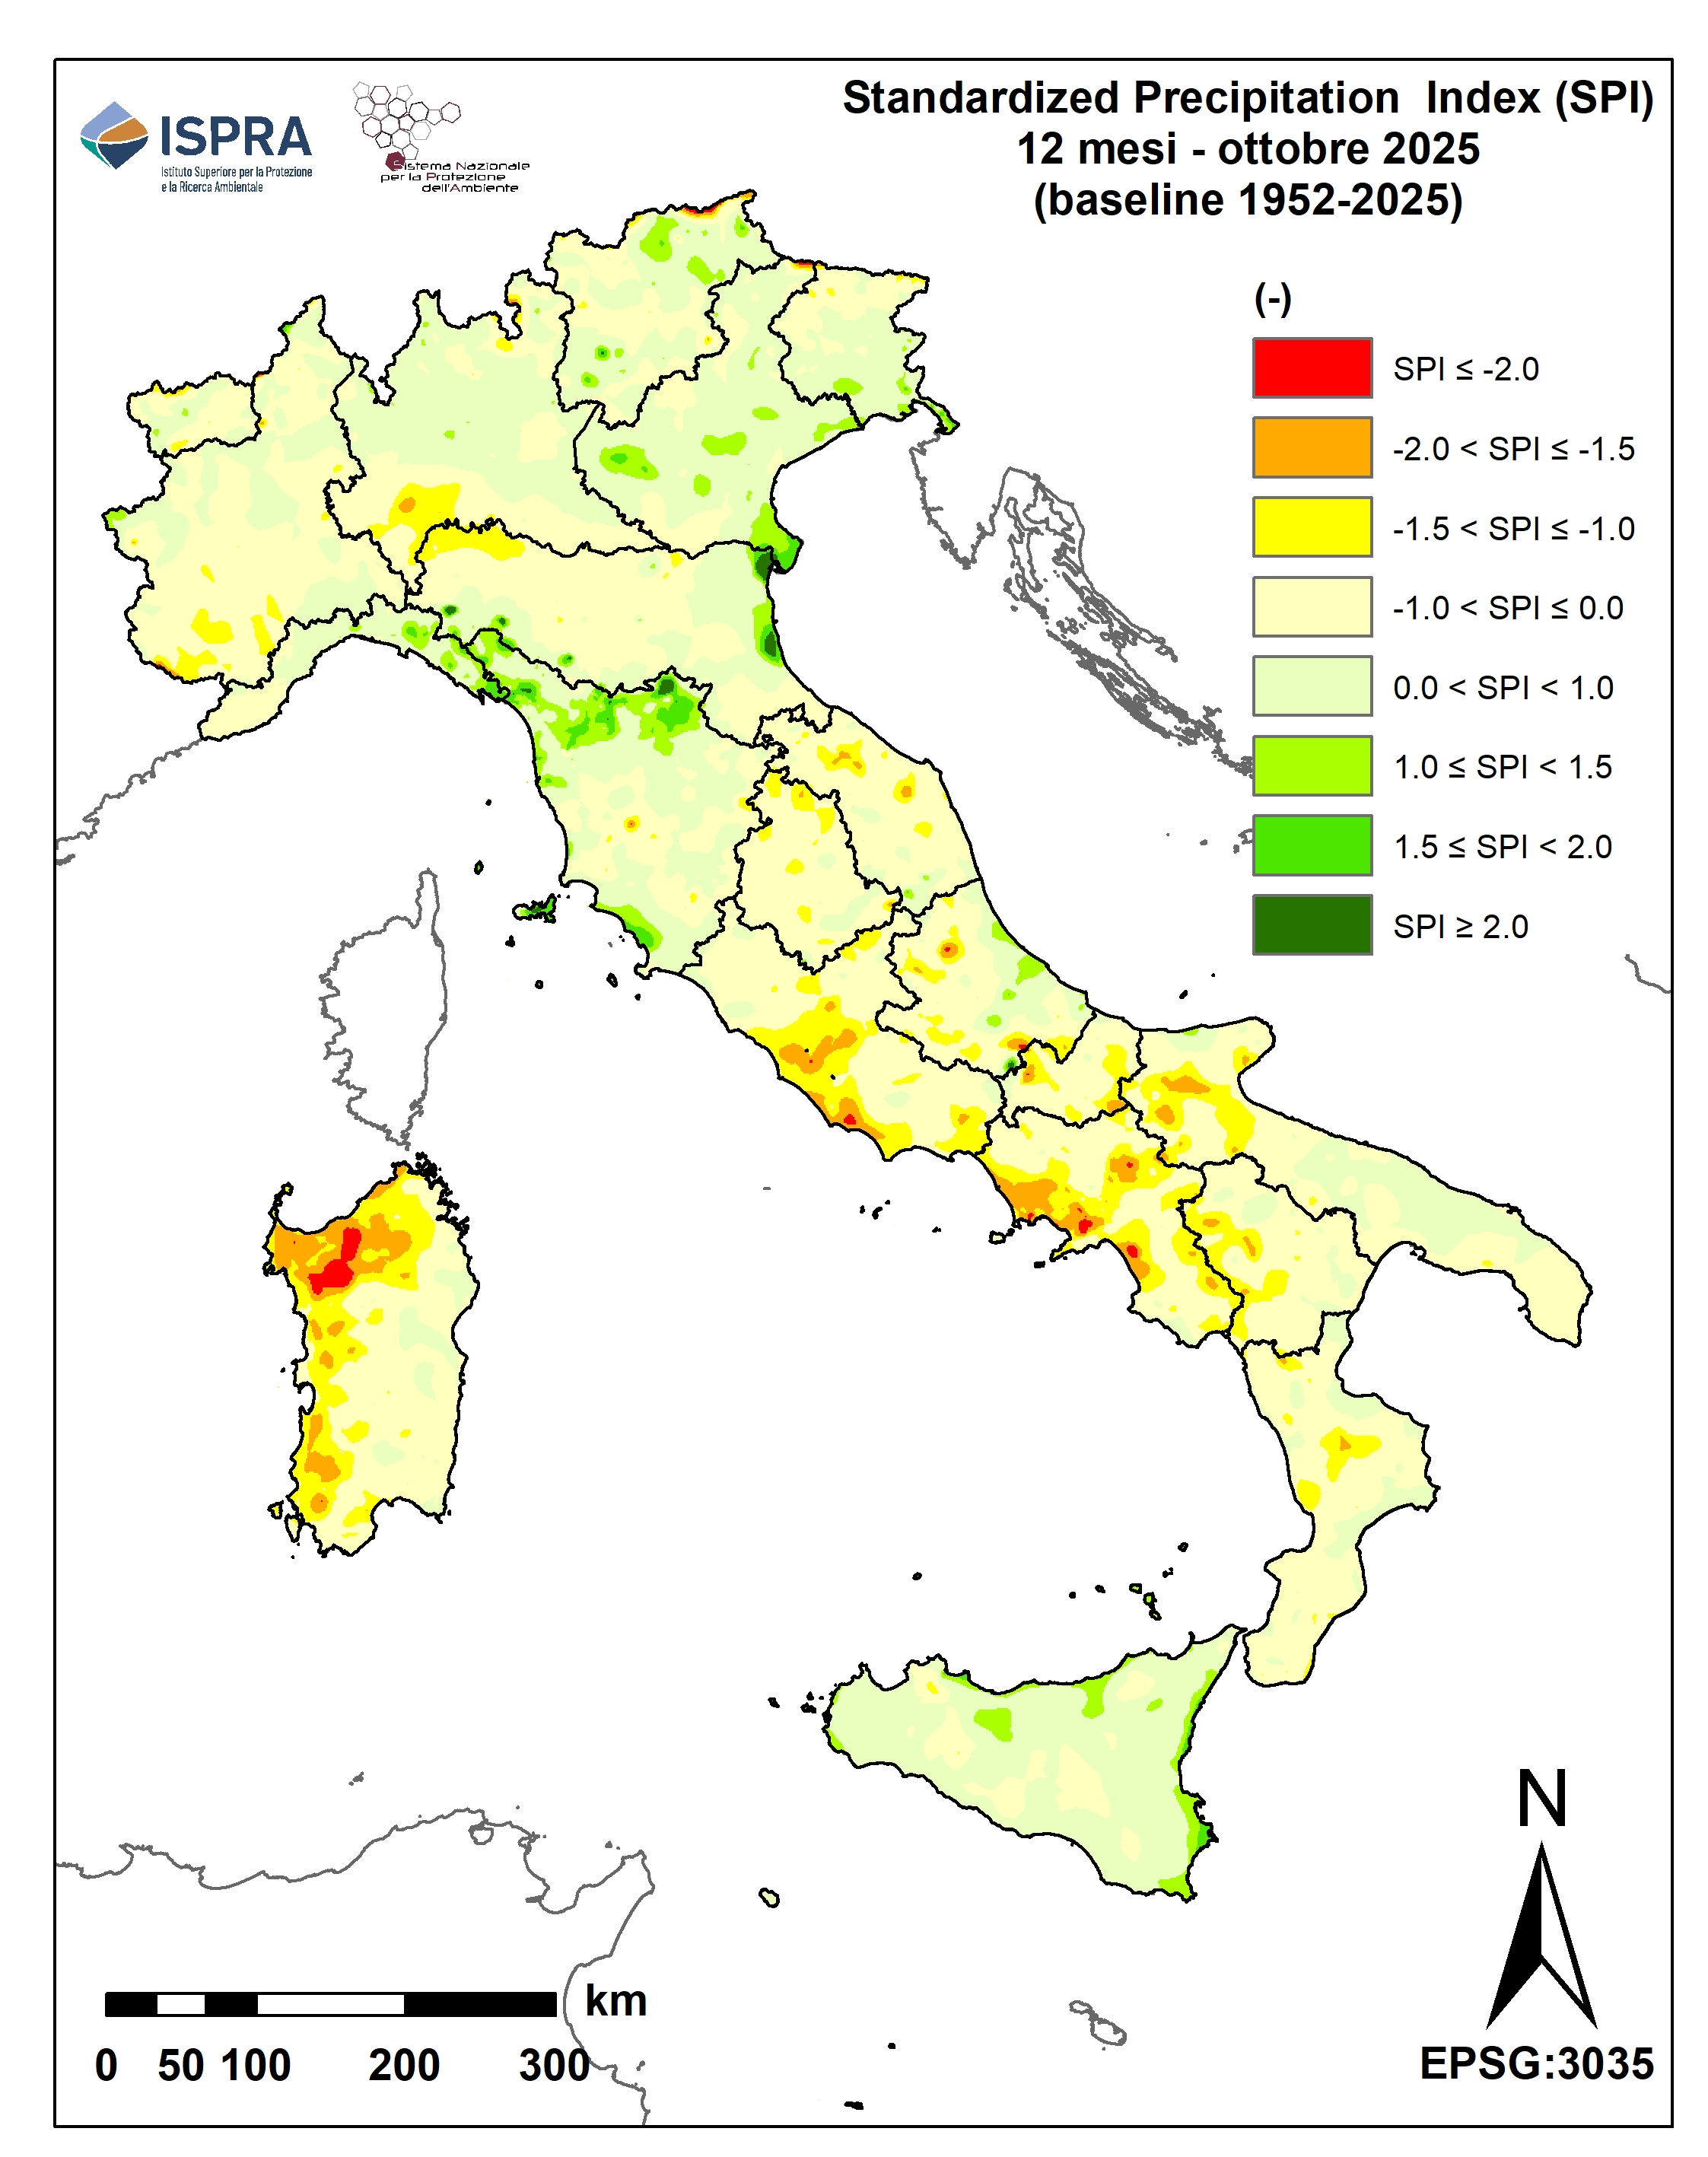
Titolo
Figure 10: 12-month SPI - October 2025 Fonte
ISPRA processing on data from regional hydro-meteorological offices and autonomous provinces and historical data from the SIMN suppressed Legenda
|
Thumbnail
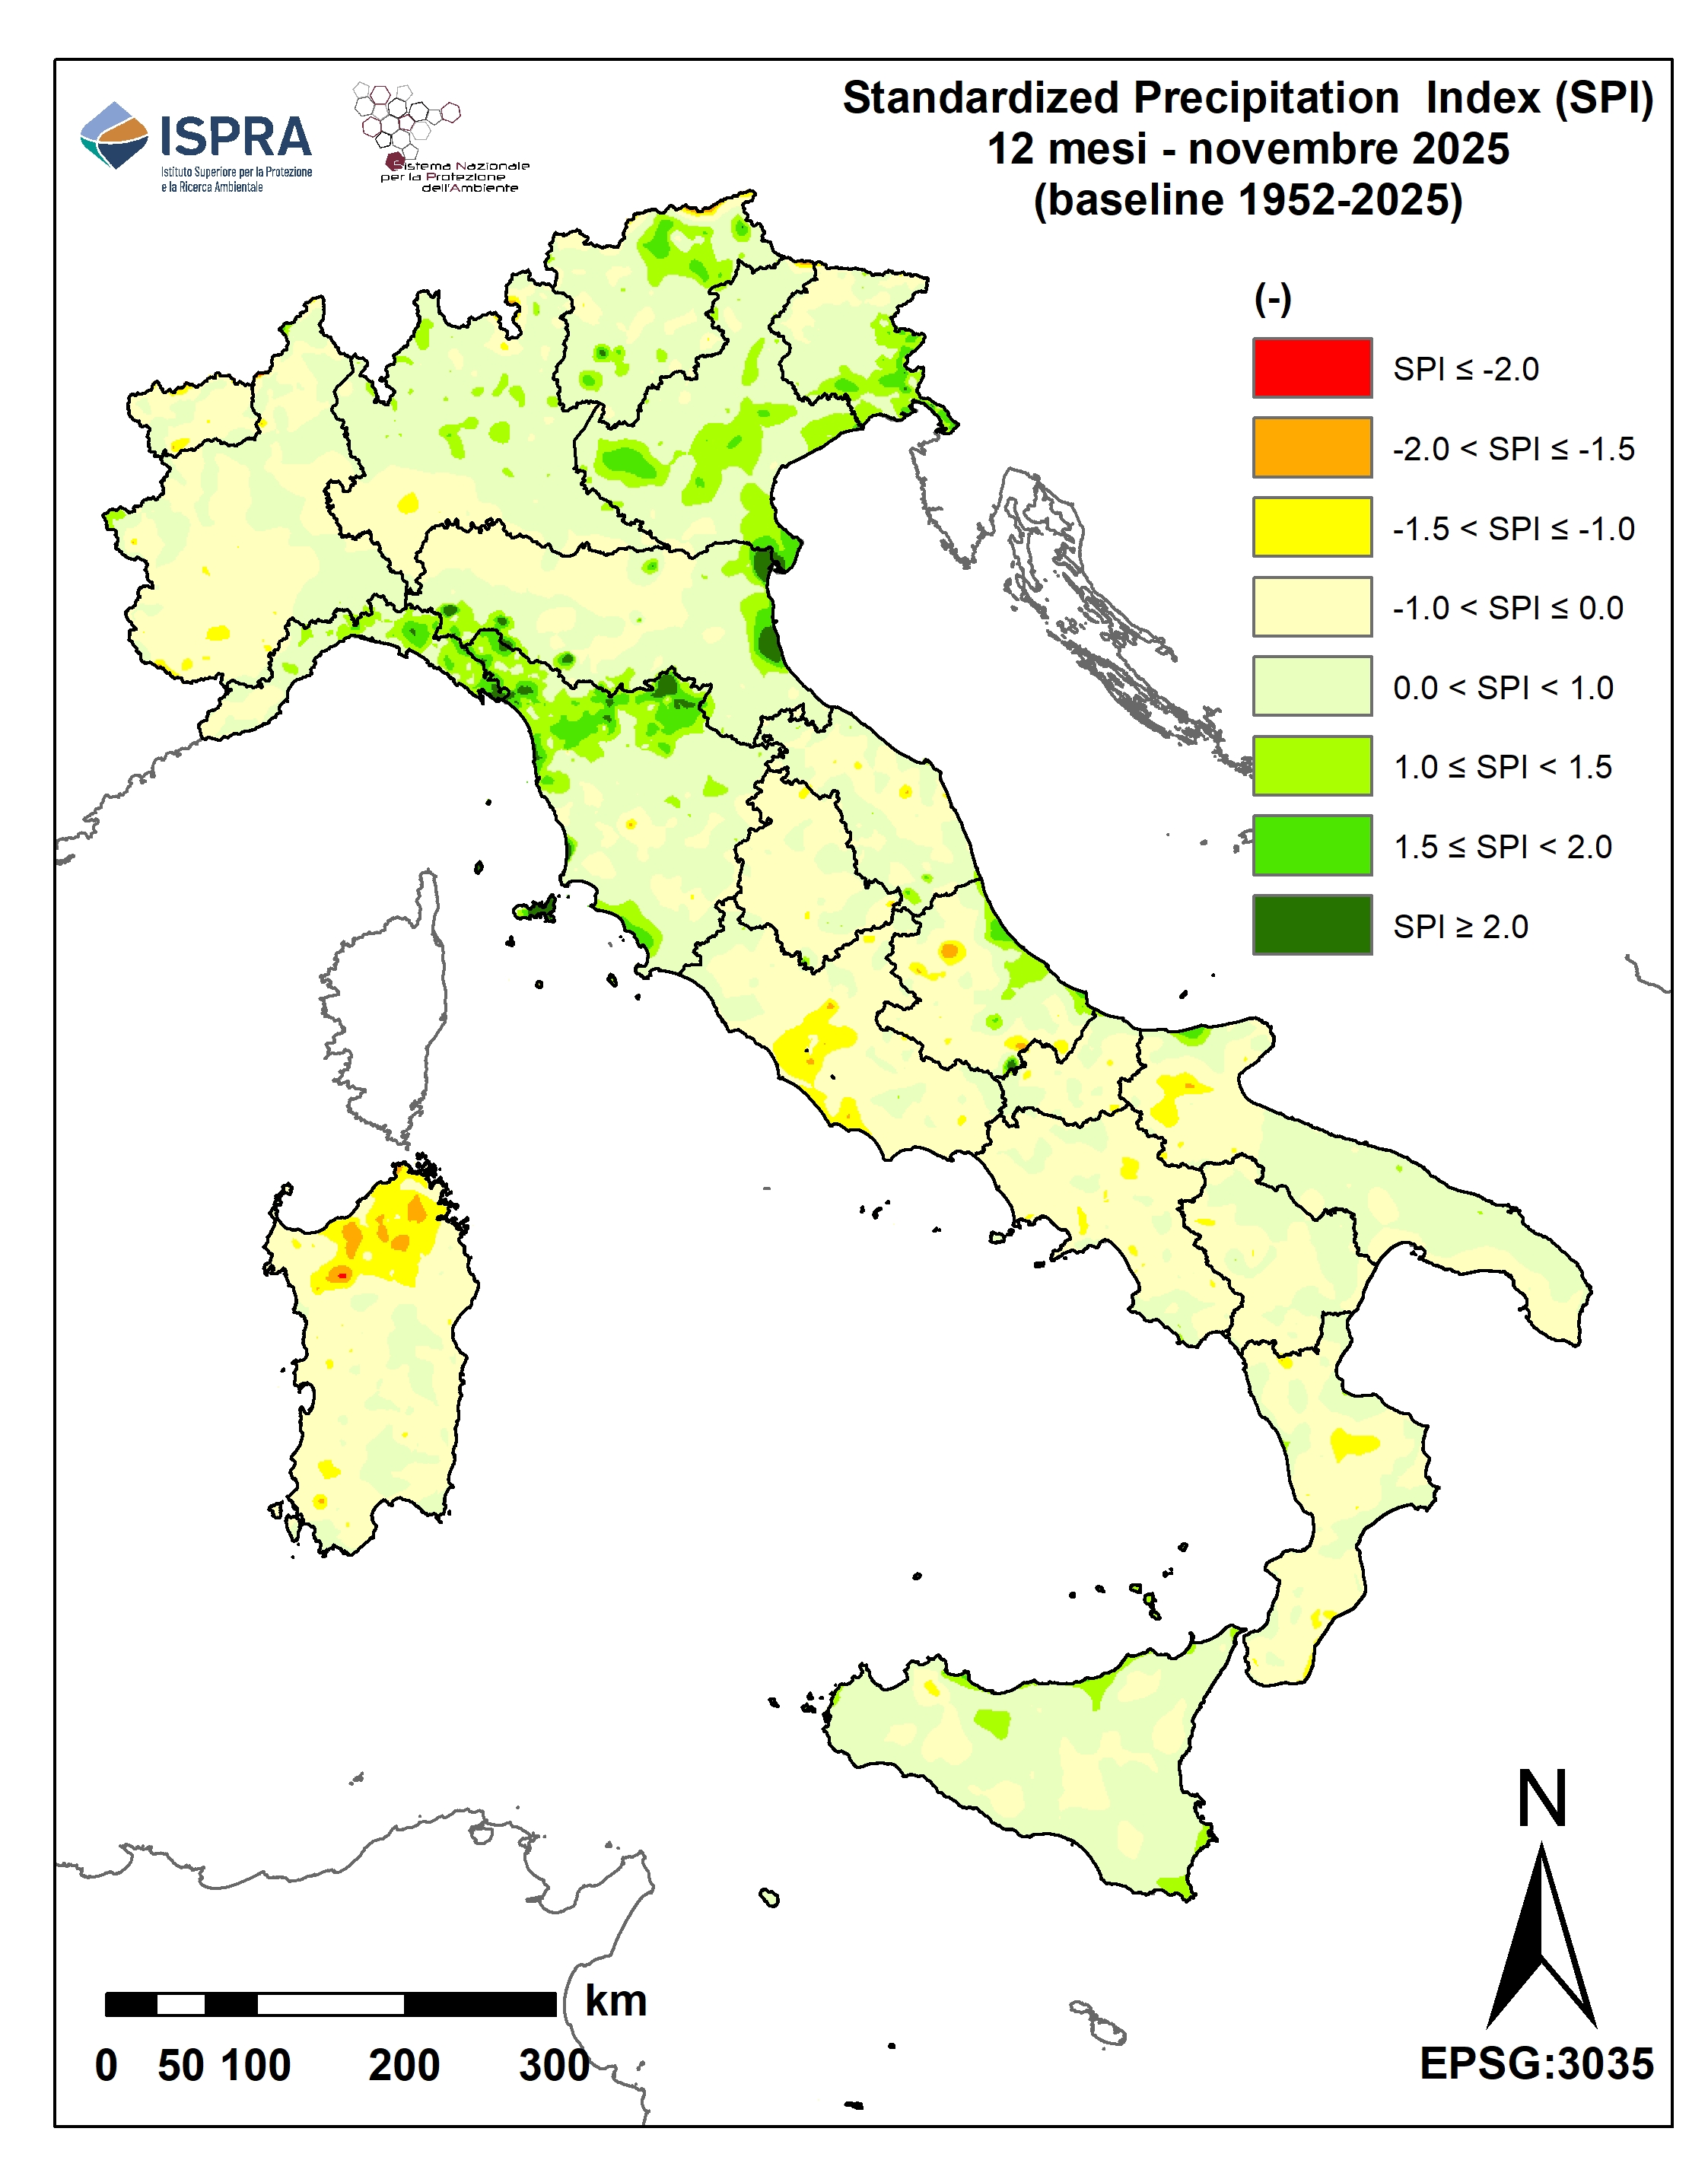
Titolo
Figure 11: SPI at 12 months - November 2025 Fonte
ISPRA processing on data from regional hydro-meteorological offices and autonomous provinces and historical data from the SIMN suppressed Legenda
|
Thumbnail
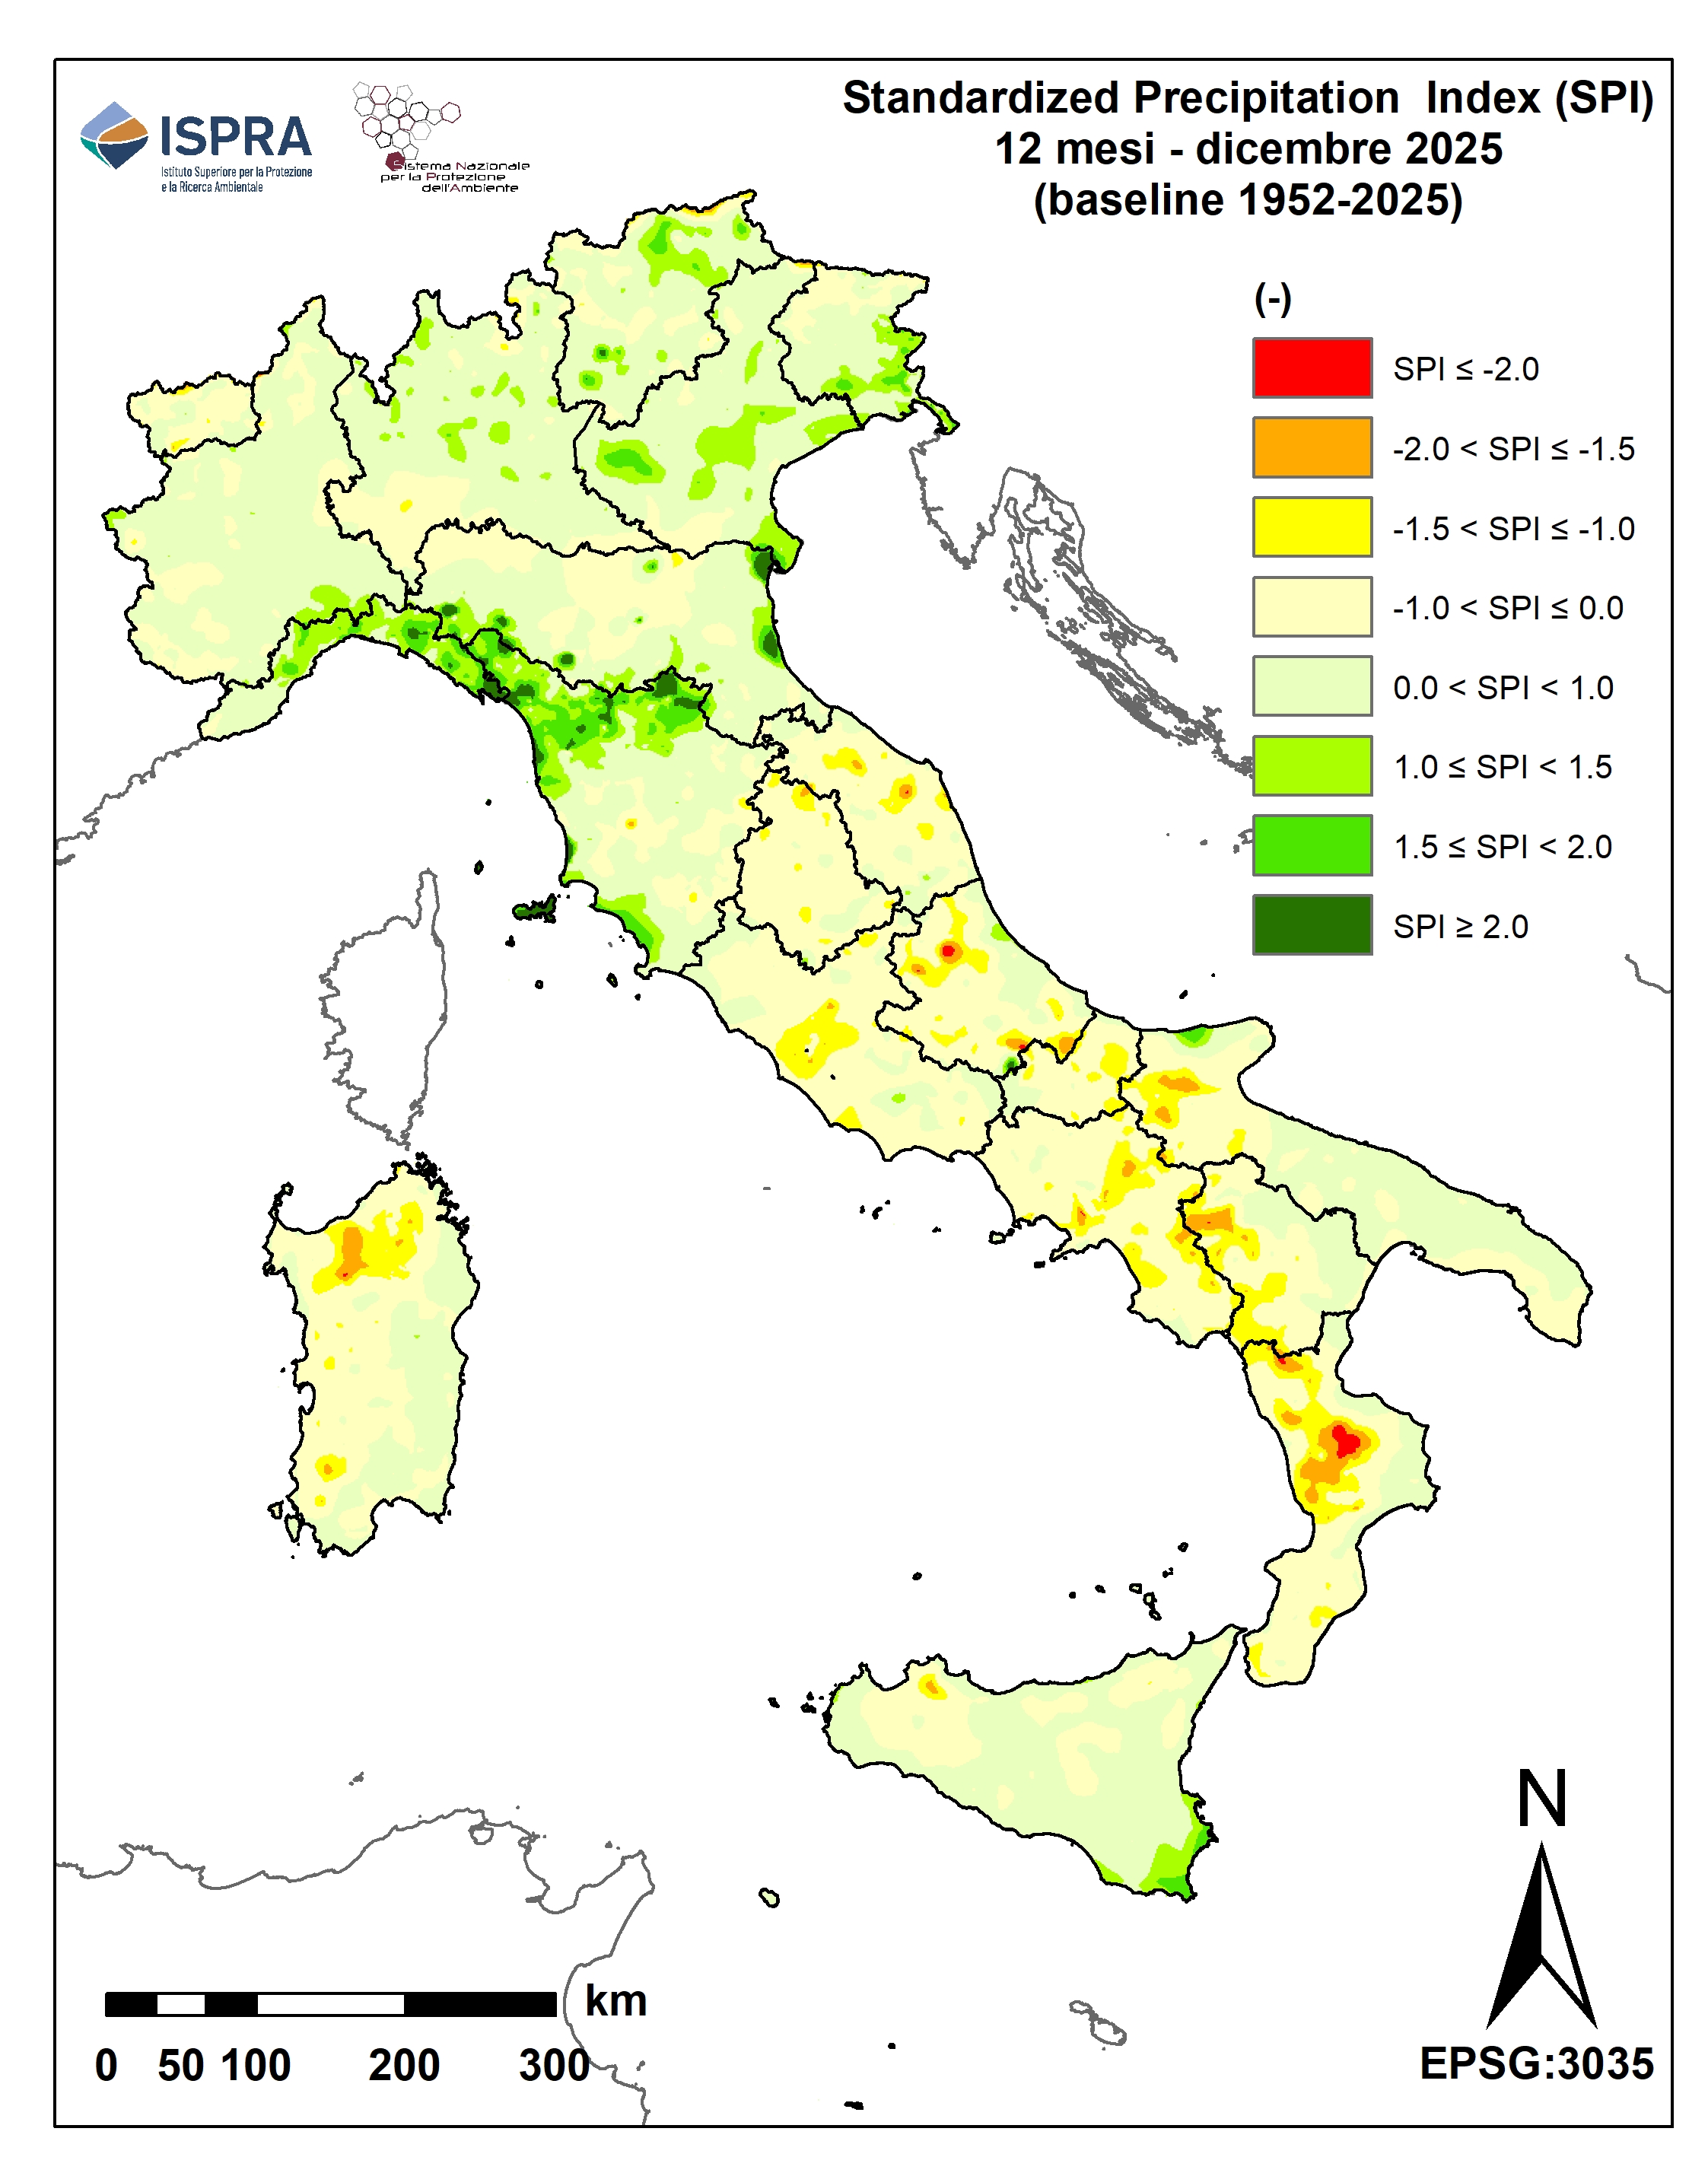
Titolo
Figure 12: 12-month SPI - December 2025 Fonte
ISPRA processing on data from regional hydro-meteorological offices and autonomous provinces and historical data from the SIMN suppressed Legenda
|
Thumbnail
Titolo
Figure 13: Percentages of national territory subject in 2025 to conditions of extreme drought and severe or moderate drought on a 12-month time scale Fonte
ISPRA processing on data from regional hydro-meteorological offices and autonomous provinces and historical data from the SIMN suppressed Legenda
|
Titolo
Dati percentuali di territorio nazionale soggetto nel 2025 a condizioni di siccità estrema e siccità severa o moderata su una scala temporale di 12 mesi |
In 2025, the 12-month SPI maps (SPI12), calculated on the precipitation spatialized on the 1 km horizontal grid of ISPRA's BIGBANG, highlighted conditions of drought, from extreme to moderate, localized in various areas of Central Italy, the South and the major islands, while the North was affected by conditions of humidity, also from extreme to moderate (Figures 1–12). This distinct situation was determined on the one hand by a surplus of precipitation which involved northern Italy, and on the other by a deficit of precipitation from which the remaining part of the national territory suffered (see the "Precipitation" indicator present in the Environmental Theme "Water Resources and Budget" of the Environmental Indicators Database). In some areas, this deficit began to be observed as early as the second half of 2023.
The 12-month aggregation scale, chosen here for the calculation of the SPI, is the one that best describes the effects of drought, i. e. The precipitation deficit, on the flow of rivers, on the capacity of reservoirs and on the recharge of aquifers (the so-called "hydrological drought").
In 2025 the average (of the twelve monthly values) of the percentage of the territory characterized by SPI12 lower than or equal to -1.0 (i. e. All drought classes, Figure 13) was found to be lower than the corresponding average value calculated over the long term (see the indicator "Percentage of Italian territory subject to precipitation deficit and surplus" present in the environmental theme "Water resources and budget" of the Environmental Indicators Database).
The precipitation deficit observed in Central Italy, in the South and in the major islands, aggravated by the high temperatures recorded during 2025 (the fourth warmest year since 1961), continued to determine a reduction in the natural availability of renewable water resources in these territories (see also the indicators "Standardized hydrological-climatic balance" and "Internal flow" present in the environmental theme "Water resources and balance" of the Environmental Indicators Database), with consequent socio-economic impacts and environmental issues linked precisely to the use of water.
The drought and water severity conditions which in 2025 affected the national territory in a diverse manner were the subject of continuous monitoring and analysis by the permanent district Observatories for water uses, a body of each District Basin Authority (pursuant to Legislative Decree no. 39/2023). During the year, the Observatories of the hydrographic districts of Northern Italy (Eastern Alps, Po River and Northern Apennines) saw a substantial normal situation confirmed, i. e. A non-critical scenario of water severity. On the other hand, the Observatories of the hydrographic districts of the Central Apennines, the Southern Apennines, Sardinia, and above all that of Sicily have recorded conditions of water severity, from medium to high ( https://www. isprambiente. gov. it/pre_meteo/idro/SeverIdrica. html/), with the need to adopt appropriate measures and actions governance based on the level of water severity encountered. In some cases (Sicily, areas of Basilicata served by the Basento-Camastra water scheme, and some Calabrian territories in the provinces of Reggio Calabria, Crotone and Cosenza), the state of emergency due to a serious water deficit has been extended by the Council of Ministers compared to the 2024 resolutions.
For a detailed assessment of the 2025 drought, even for time scales of less than 12 months, please refer to the consultation of the hydrological and/or drought bulletins issued monthly at regional level by the offices responsible for hydro-meteorological monitoring (federated within the National Table for Operational Hydrology Services: https://www. isprambiente. gov. it/pre_meteo/idro/Tavolo_IdrologiaOper. html ), as well as consulting the SPI maps published in the ISPRA Drought Bulletin ( http://www. isprambiente. gov. it/pre_meteo/siccitas/) or to the SPI and SPEI evaluations produced within the BIGBANG ( https://groupware. sinanet. isprambiente. it/bigbang-data/library/bigbang100/).