Giovanni Braca
The indicator provides, for each month and for the entire year, the evaluation of the monthly and annual cumulative water height, expressed in mm, summarised to the surface of the national territory that is actually transferred to the atmosphere for evaporation phenomena from the liquid mirrors and the soil and perspiration of the vegetation and, therefore, does not contribute to the formation of renewable water resources.
In 2024, the estimated value of the total annual total real evapotranspiration was 540.3 mm, more than 9.5% at the average value for the period 1951–2024 estimated at 493.4 mm.
Evapotranspiration is defined as the amount of water that moves into the atmosphere for evaporation phenomena directed by the bodies of water, soil and vegetation (interception) and perspiration of vegetation. We talk about real evapotranspiration (actual evapotranspiration) when it represents the actual amount of water that is transformed into steam by the complex of atmospheric factors and vegetation. Unlike potential evapotranspiration, the real one depends, in addition to the climatic factors (temperature, wind, relative humidity, etc.), on the water content in the soil that can be a consequence of the precipitation or artificial irrigation. The actual evapotranspiration, therefore, is always less than or equal to potential evapotranspiration.
The monthly scale indicator is assessed by the ISPRA BIGBANG hydrological budget model with the Thornthwaite and Mather method using a water balance model in the surface layer of the soil where the interactions between the soil and the root plant root system (root zone) are located. The annual value is obtained from the sum of the monthly values. Real evapotranspiration is one of the main components of the hydrological cycle. The indicator is forwarded to the European Environment Agency (Water Information System for Europe (Staman of Environment) as part of the WISE-SoE (Water Information System for Europe - State of Environment) data flow.
Provide, as part of the estimation of the available or potential water resource, an assessment of the amount of water that passes into the atmosphere through the evaporation and transpiration processes of the vegetation and which, therefore, does not contribute to the formation of the renewable water resource.
Existing legislation does not set specific environmental targets
- Braca, G., Mariani, S., Lastoria, B., Tropeano, R., Casaioli, M., Piva, F., Marchetti, G., e Bussettini, M., 2024: Bilancio idrologico nazionale: stime BIGBANG e indicatori sulla risorsa idrica. Aggiornamento al 2023. Rapporti n. 401/2024, ISPRA, Roma. https://www.isprambiente.gov.it/it/pubblicazioni/rapporti/bilancio-idrologico-nazionale-stime-bigbang-e-indicatori-sulla-risorsa-idrica-aggiornamento-al-2023.
- Braca, G., Mariani, S., Lastoria, B., Piva, F., Archi, F., Botto, A., Casaioli, M., Forte, T., Marchetti, G., Peruzzi, C., Tropeano, R., Vendetti, C., e Bussettini, M., 2023: Bilancio idrologico nazionale: focus su siccità e disponibilità naturale della risorsa idrica rinnovabile. Aggiornamento al 2022. Rapporti n. 388/2023, Roma. Disponibile online all’indirizzo: https://www.isprambiente.gov.it/it/pubblicazioni/rapporti/bilancio-idrologico-nazionale-focus-su-siccita-e-disponibilita-naturale-della-risorsa-idrica-rinnovabile-aggiornamento-al-2022.
- Braca, G., Bussettini, M., Lastoria, B., Mariani, S., e Piva, F., 2021: Il Bilancio Idrologico Gis BAsed a scala Nazionale su Griglia regolare – BIGBANG: metodologia e stime. Rapporto sulla disponibilità naturale della risorsa idrica. Rapporti 339/21, Roma. Disponibile online all’indirizzo: https://www.isprambiente.gov.it/it/pubblicazioni/rapporti/il-bilancio-idrologico-gis-based-a-scala-nazionale-su-griglia-regolare-bigbang.
- Mariani, S., Braca, G., Lastoria, B., Tropeano, R., Casaioli, M., Piva, F., Bussettini, M., 2024: “Il bilancio idrologico, la disponibilità di risorsa idrica e il bilancio idrico”, in Siccità, scarsità e crisi idriche, Emanuele Romano, Ivan Portoghese (a cura di), Habitat signa 1, 29-46. Roma: Cnr Edizioni. Disponibile online all’indirizzo: https://www.cnr.it/sites/default/files/public/media/attivita/editoria/SiccitaInterattivo_ver2.pdf.
- Moisello, U., 1998, Idrologia tecnica, La Goliardica Pavese.
- Thornthwaite, C.W., and Mather J.R., 1955: The water balance, Laboratory of Climatology, 8, Centerton NJ.
The indicator is estimated on the basis of a mathematical model, implemented in the national hydrological budget BIGBANG model, version 9.0, of ISPRA, and, as such, can therefore be compared only with indicators obtained with the same model. In addition, it is estimated on the basis of precipitation and temperatures in turn estimated on the basis of a set of rain and thermometric stations that could be not homogeneously distributed on the territory and whose number could be different from year to year. Such circumstances, together with the different hydraulic characterization of the soil, suggest special attention and caution when comparing the indicator in space and time.
The mathematical model does not take into account the different type of vegetation. In addition, previously published estimates referring to earlier versions of the BIGBANG model may have slight deviations from the estimates of the latest version available as some data or schematizations at the base of the model may have changed. Correct comparisons between the values of the indicator must therefore be made using the same version of the BIGBANG model.
Use of a more complex mathematical model to also take into account the type of vegetation.
The temperature data used are mostly those collected and published by the regional and provincial structures to which, according to art. 92 of Legislative Decree no. 112 of 31 March 1998, the functions and tasks of the peripheral offices of the National Hydrographic and Tire Service (SIMN, now merged into ISPRA) of the Department for National Technical Services, were transferred. The temperature data used in the processing of the indicator shall be accessible by consulting the websites of the entities. The temperature data are also accessible via the SCIA portal of ISPRA (https://scia.isprambiente.it). The temperature and evapotranspiration data, aggregated to the monthly scale on the regular grid of the 1 km resolution BIGBANG, which covers the entire national territory, are available on the Groupware portal of ISPRA (https://groupware.sinanet.isprambiente.it/bigbang-data/library/bigbang-90). Data on the hydraulic characteristics of the soils are accessible (subject to registration) to the JRC/ESDAC portal (http://esdac.jrc.ec.europa.eu/content/lucas-2009-topsoil-data).
national
1951–2024
The calculation method used is that of Thornthwaite and Mather as implemented in the BIGBANG-Billionological Cycle Gis BAsed model at National scale on Regular Grid, version 9.0, developed and implemented in GIS environment by ISPRA. The BIGBANG model schematizes the volume of land by 1 km x 1 km and 1 m deep as a tank, the maximum available capacity of the soil weaving. The tank is filled with precipitation and emptied by the evapotranspiration. When the tank is full, the excess of precipitation turns into a runoff and deep infiltration according to the scheme adopted. The real evapotranspiration remains at the value of the potential, as long as the accumulation of water in the soil is maintained above a certain fraction of the value known as "field capacity". Subsequently, the actual evapotranspiration decreases linearly to the zero value when the water content reaches the value known as the "withweld dot".
In 2024 the estimated total annual total evapotraspiration value was 540.3 mm higher than the average value of the period estimated at 493.4 mm.
A higher than average value leads to a reduction in the availability of water resources.
It is noted, through the Mann-Kendall test, a growing trend, statistically significant at 5%, in the period 1951–2024 of the total annual real evapotraspiration calculated with the BIGBANG model, version 9.0.
This trend leads in perspective a reduction in the availability of water resources.
| Data |
|---|
Thumbnail
Headline
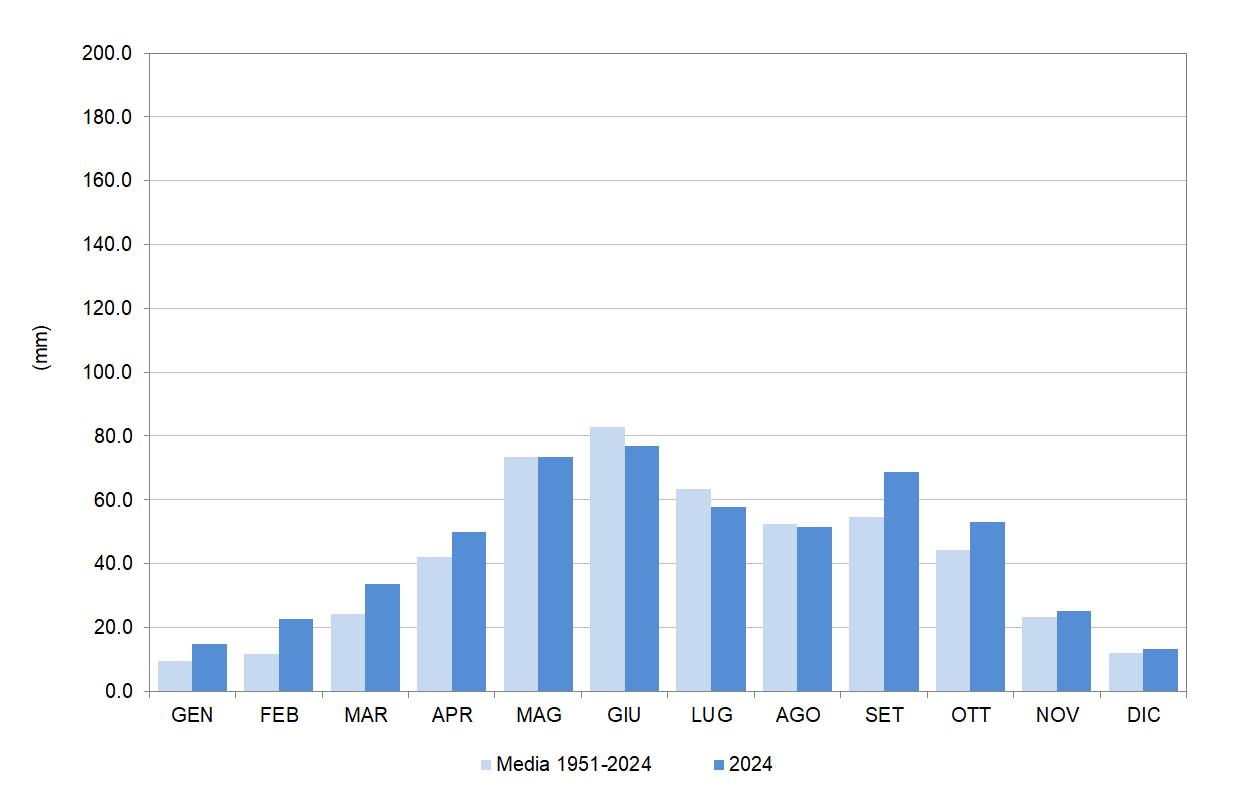
Figure 1: Monthly real evapotranspiration height, summarised to the national territory for 2024 and average for the period 1951-2024 Data source
ISPRA elaboration on data from regional hydro-meteorological offices and autonomous provinces and on historical data of the Suppressed SIMN |
Headline
Dati per Figura 1 Data source
Elaborazione ISPRA su dati degli uffici idro-meteorologici regionali e delle province autonome e su dati storici del soppresso SIMN |
In 2024, at national level, the estimated total annual total evapotraspiration value was 5400.3 mm, higher than the average value for the period 1951–2024 estimated at 493.4 mm. Monthly values in 2024 were lower than average only in the months of May, June, July and August, while in all other months the values were higher than average (Figure 1).
The real evapotranspiration depends not only on the climatic factors also on the rainfall that occurred in the previous months and on the hydraulic characteristics of the soils. Therefore, the trend of the indicator is not directly connected to temperature alone.