Maria Luisa Cassese, Filippo D'Ascola, Valeria Pesarino, Andrea Salmeri
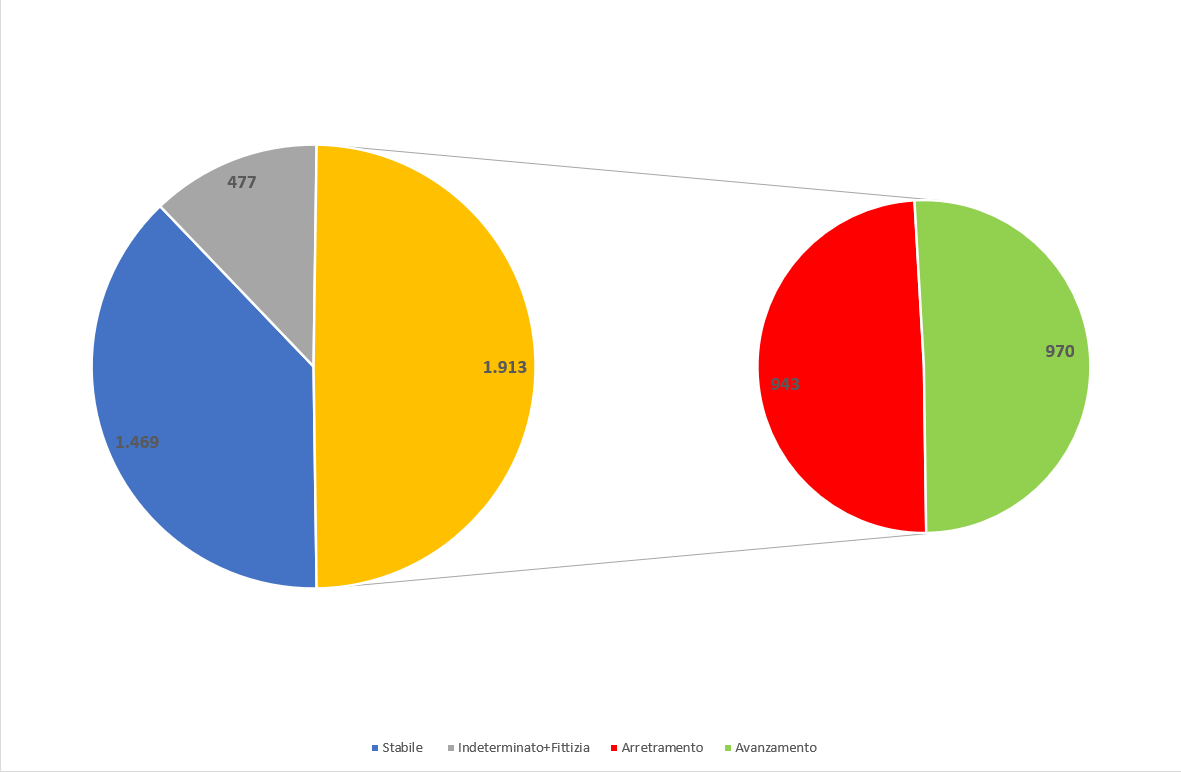
The indicator provides the national and regional estimate of the state conservation of Italian coasts in 2020 and of the changes due to erosion or progress suffered since 2006, useful for the assessment of the vulnerability of coastal areas and the risk to which urban centers, infrastructure and socio-economic activities that develop near the coast are exposed. In 2020 there was a significant instability over 1,913 km of coastline, of which 943 km for erosion and 970 km for advance, however, compared to the previous surveys (1950-2000, 2000-2006), there is a slight trend to greater stability and an increase in the stretches of coast in progress.
The coast is an area in continuous evolution and its changes are highlighted above all in correspondence with low and sandy coasts, with new adjustments of the shoreline and with territorial surfaces emerged and submerged by the sea. The dynamics of the coasts depend essentially on the action of the sea (wave motion, tides, currents, storms), but it is also influenced by all those direct and indirect actions, natural and anthropic, which intervene on the balance of the coastal territory by modifying its geomorphological characteristics. The extraction of inerts from the riverbeds and the barriers along the course of the rivers, the safety of the embankments and mountain slopes for the containment of the hydrogeological instability reduce the flow of sediments to the river foci, intended for natural distribution along the coasts. Coastal urban and productive settlements, land and sea traffic infrastructure, including coastal defense works, invade sea-coastal spaces and their presence interacts with the natural dynamics of the coasts. The indicator provides an estimate on a national and regional basis of the natural coast that has undergone geomorphological changes by erosion and for advancing towards the sea. The indicator is the result of cartographic and statistical processing of the data acquired as part of the periodic monitoring activities of the state and changes in the geomorphology of the Italian coast, the maritime and coastal protection works carried out at sea and close to the shore started in ISPRA in 2003. Updated to each new survey, the indicator is the synthesis of the analysis of the geomorphological variations of the coasts, in terms of soil lost and recovered due to all the direct and indirect causes that act near the coast, found between two subsequent surveys.
Arrange synthetic information on the evolution of the country’s coastal structure that supports the definition of national strategies and protection and management plans in line with the relevant European directives. The indicator, updated periodically, is a basic parameter for the assessment of the vulnerability of coastal areas and the degree of risk to which urban centers, infrastructure and socio-economic activities that develop near the coast are exposed. Observing the trend of coastal erosion is a reference data both to determine the solutions and economic resources necessary to mitigate the phenomenon and to evaluate the effects and effectiveness of coastal defence measures and interventions implemented by the various levels of management (regional, municipal, basin authorities and more).
Legislative Decree no. 112 of 31 March 1998, in implementation of Chapter I of Law No. 59 of 15 March 1997, confers the functions and administrative tasks of the State to the regions in the field of protection and observation of coastal areas (Article 70 paragraph 1 letter a) and programming functions, planning, integrated management of coastal and coastal residential interventions (Article 89 paragraph 1 letter h), leaving the State with the general important tasks related to the general guidelines. The indicator is functional to the definition of general guidelines and reports on the state of implementation of the numerous directives that recall the protection of coastal areas.
ISPRA
Used data ISPRA - Progetto "Stato e variazioni delle coste italiane", ed. 2000, 2006, 2020
National; Coastal Regions
1950-2000, 2000-2006, 2006-2020
For the calculation of the indicator, a methodology was defined for collecting data on the coastal strip based on photointerpretation and classification of information derived from mosaics of color zenithal orthophotos with sub-metric spatial resolution. For the cartographic representation, processing, and description of the geomorphological features of shorelines and artificial structures built along the coast—such as ports, protective works, and other constructions—uniform standards were established and consistently applied to all Italian coastlines.
The survey and processing methodology, applied to the available national land cover datasets, enabled the generation of a historical data series on the state of Italian coasts and the creation of a database for calculating indicators of coastal area changes.
The reference sources used for the cartographic survey of base data were, for 2020, the color orthophoto mosaics available on Google platforms; for 2006 and 2000, the mosaics from the IT2006 and IT2000 flights, respectively, available on the National Cartographic Portal.
The analysis of changes was carried out in a GIS environment by overlaying two shoreline configurations surveyed in different periods (2000–2006 and 2006–2020) and applying spatial analysis procedures to identify deviations in the most recent survey compared to the previous one exceeding +/- 25 meters (1950–2000) and +/- 5 meters (2000–2006 and 2006–2020). This range is considered sufficient to exclude both natural variations due to tidal range and potential errors related to cartographic transposition as well as the quality and resolution of the imagery from which the base data were derived.
In the period under review, coastal stretches with deviations of less than +/-5 meters compared to the previous survey were classified as stable, while those with greater deviations were classified as modified. Specifically, coastal stretches that receded inland by more than 5 meters compared to the previous survey were classified as undergoing erosion, whereas stretches that advanced seaward by more than 5 meters were classified as accreting.
Recent activities carried out by ISPRA have led to the definition of a new standard for the digitization and characterization of the coastal layout, integrating—where appropriate—data processing updated to 2020. This standard is capable of addressing technical inconsistencies (coregistration, georeferencing, orthophoto sharpness) and photointerpretation uncertainties (shadows, rough sea, presence of stranded Posidonia, marsh areas, Po River mouth, lagoon). It also limits the sections excluded from spatial analysis to only those areas with high variability in coastal dynamics, corresponding to parts of the Po River delta and the Friulian coast.
The indicator is of national importance, the quality of the basic information used for processing allows comparability in time and space, including comparative assessments between the different territorial and climatic characteristics of the coastal areas of the country.
The analysis of changes in the coasts compared to 2006 shows in relative terms a decrease in stability (about 370 km) which translates into an increase in both erosion (about 50 km) and, in a more sensitive way, of the advance (about 130 km).
| Allegati |
|---|
Thumbnail
Titolo
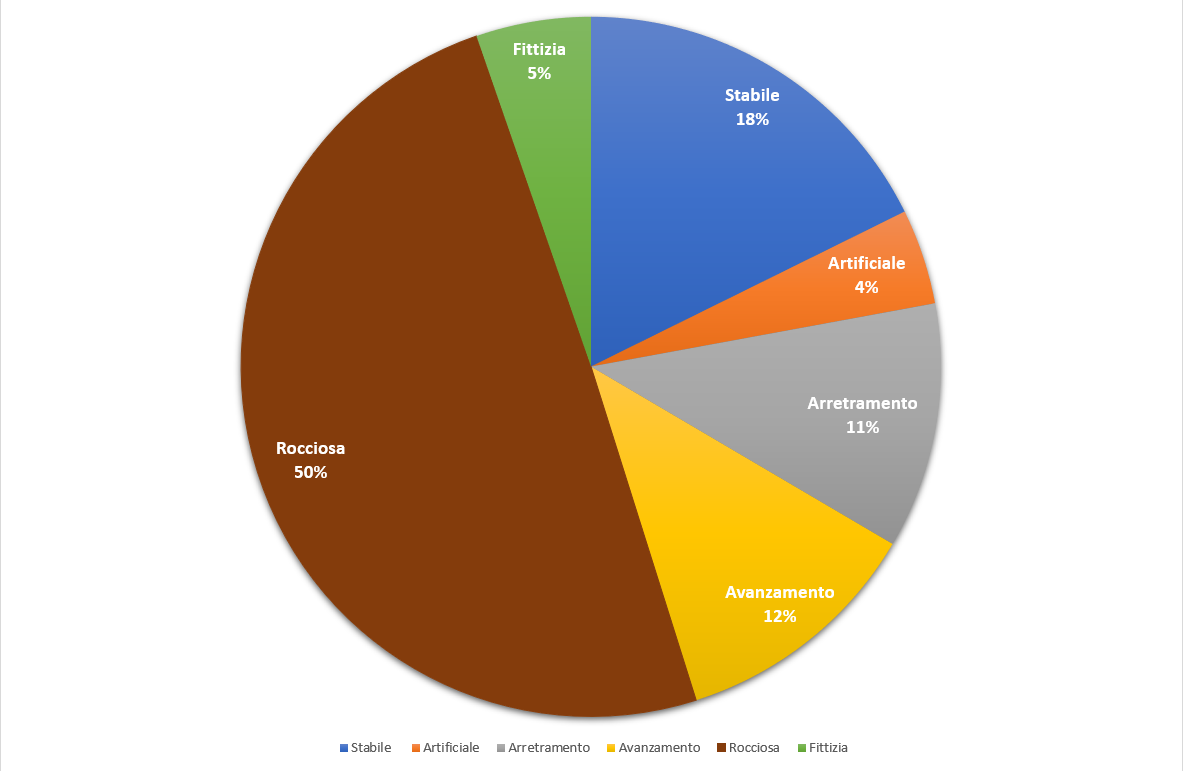
Figure 4: Percentage distribution of the types of the Italian coast Fonte
ISPRA |
Thumbnail
Titolo
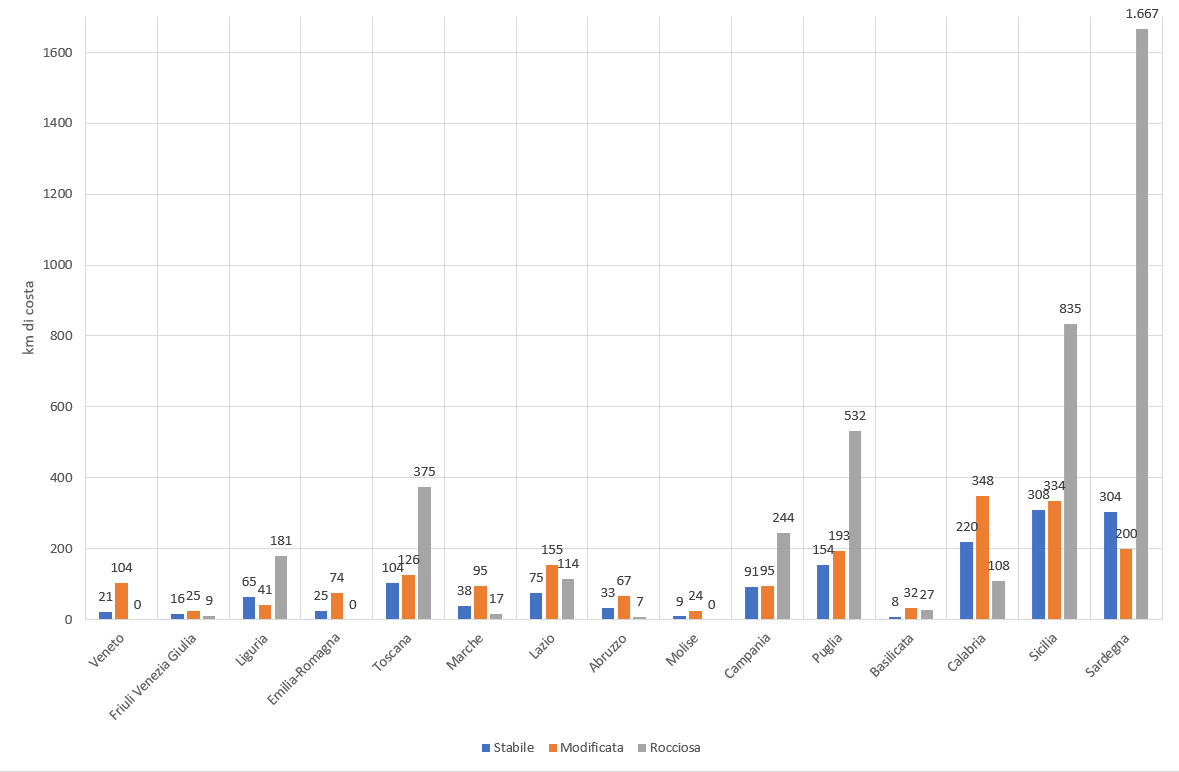
Figure 5: Distribution by region of stable low coast and coast that has changed over the period 2006-2020 Fonte
ISPRA |
Thumbnail
Titolo
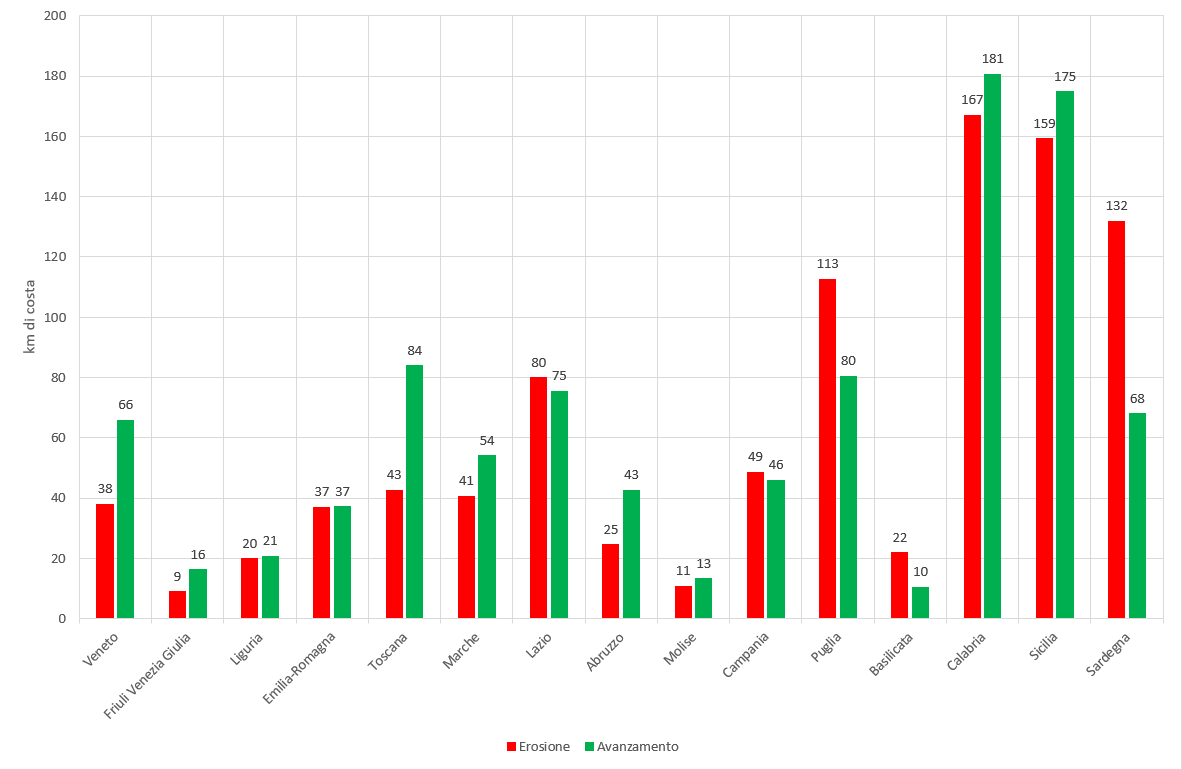
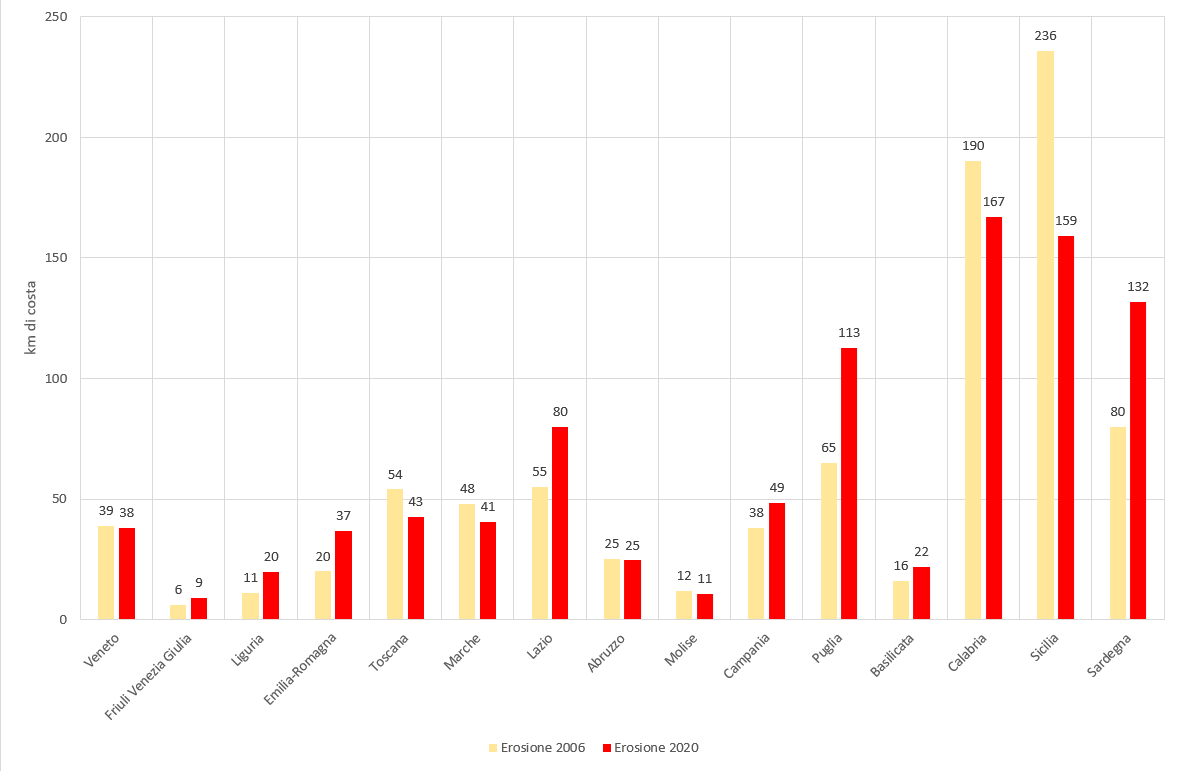
Figure 6: Distribution by region of the low coast in erosion and progress in the period 2006-2020 Fonte
ISPRA |
Thumbnail
Titolo
Figure 7A: Distribution by low coastal region erosion in 2000-2006 and 2006-2020 Fonte
ISPRA |
Thumbnail
Titolo
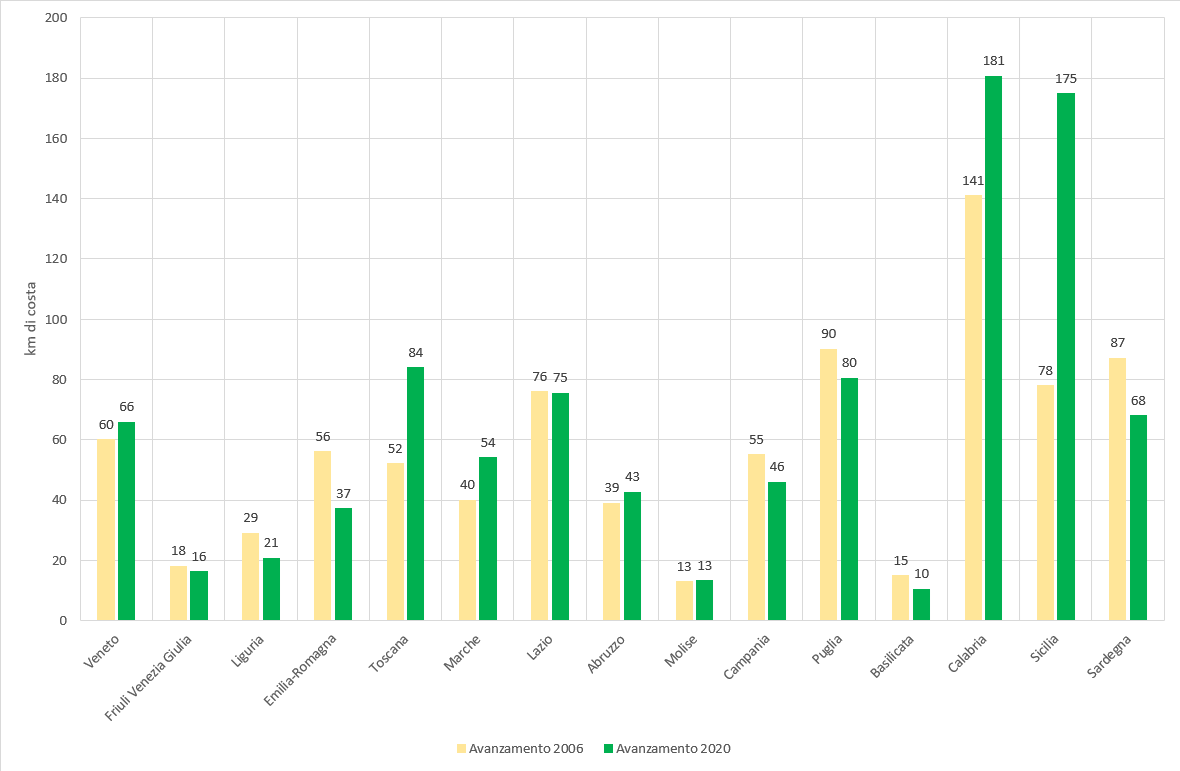
Figure 7B: Distribution by low-rise coastal region in progress in the periods 2000-2006 and 2006-2020 Fonte
ISPRA |
Titolo
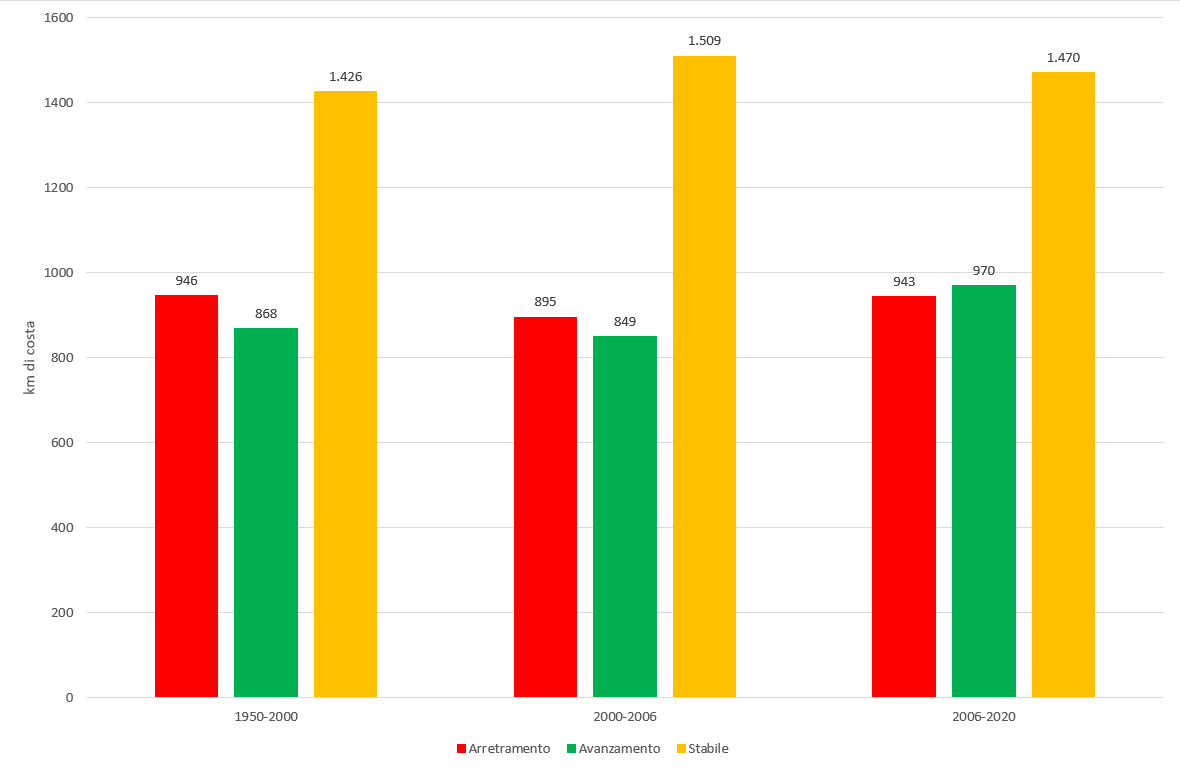
Table 1: Changes in low coast alone in the periods 1950-2000, 2000-2006 and 2006-2020 Fonte
ISPRA |
Titolo
Table 2: Regional coastal data and variations detected in the period 2006-2020 Fonte
ISPRA Legenda
I dati suddivisi per regione rappresentano la costa totale (naturale+artificiale+fittizia), costa natuale (rocciosa+bassa sabbiosa), costa mobile (solo bassa sabbiosa) |
Thumbnail
|
The data reported in Table 1 summarize the studies on coastal characterization and geomorphological changes carried out based on nationally available territorial coverages, referring to the periods 1950–2000, 2000–2006, and 2006–2020.
The length of the coastline is determined by the shoreline identified through photointerpretation of color zenithal images with sub-metric resolution and classified as natural high or low, as artificial—when the shoreline is bordered by a close-built structure—and as fictitious, which refers to linear sections introduced at river mouths, port structures, and all other works that interrupt the natural layout of the coastline.
The difference in coastal extension between 2000 and 2006 is due to natural and anthropogenic changes in the shoreline during that period, the exclusion of artificially filled areas (even if partially natural) that were considered in 2000, and the availability of IT2006 flight orthophotos that revealed the actual morphology of territorial areas previously masked in the IT2000 flight orthophotos.
The greater length of the Italian coastline in 2020 compared to 2006 is mainly due to the resolution of several technical issues still unresolved as of 2006. Foremost among these was the coregistration of IT2006 flight images with Google Maps imagery, which in certain areas (Sicily, Lazio, Puglia, and Marche) showed discrepancies of several tens of meters.
A detailed analysis of the entire coastal strip (around 20,000 control points identified along over 5,000 km of low, non-rocky coastline) allowed for the identification of approximately 300 km of coast defined by uncoregistered images.
A second issue resolved was the uncertainty caused by rough seas or shadowed areas: in many regions, the images were affected by rough sea conditions (about 340 km) or shadow zones (about 30 km), preventing the accurate identification of a reliable shoreline.
The adopted solution, with access to several mosaics of recent imagery, was to use the images most temporally close to the initially referenced ones that displayed calmer seas or areas no longer in shadow.
Excluded from the spatial calculation remain only areas characterized by high variability in coastal dynamics, particularly the southern Po Delta and part of the Friulian coast between the Grado-Marano Lagoon and the Isonzo river mouth.
The modified coastal stretches are slightly more numerous than in the previous survey (2000–2006); coastal stretches in progradation (970 km) outnumber those undergoing erosion and shoreline retreat (943 km).
The percentages in Table 1 refer to the total coastal length, including high coastlines, artificial stretches due to built structures close to the shoreline, and fictitious linear segments introduced at port works and river mouths, but the change analysis was conducted only on low and natural coastlines.
The coastline classified as stable refers only to low natural coastlines, which can undergo significant variation. In fact, beaches are the coastal stretches subject to the most marked and visible geomorphological evolution, excluding rocky coasts, which represent 50% of the entire Italian coastline (Figure 4).
The continuous movement of sediments by the sea (currents, tides, wave motion, storms) exposes these areas to ongoing changes, which manifest as new adjustments of the shoreline and as land surfaces emerging from or submerged by the sea, detectable even over a single season.
The fluvial supply of detrital material at river mouths is naturally reused for the nourishment of gravel or sandy shores, and all interventions—such as hydraulic and maritime works—that act as barriers to the progressive sediment supply to river mouths or obstruct coastal sediment flow become part of coastal dynamics processes, further influencing beach morphology.
Regarding stability values, it should be noted that most stable beach sectors feature protective structures built over the years to contain erosion processes and ensure an acceptable level of stability to safeguard nearby property and infrastructure.
As for the changes observed during the examined periods:
Between 1950 and 2000, about 22% of low coasts underwent changes greater than ±25 meters, with eroding stretches (946 km) exceeding accreting ones (868 km).
Between 2000 and 2006, 22% of coastlines experienced variations over ±5 meters, with eroding stretches (895 km) still greater than those in progradation (849 km).
Between 2006 and 2020, 23% of coastlines experienced variations over ±5 meters, with 943 km in erosion and 970 km in progradation.
Unfortunately, this reversal in trend does not generally correspond to a reduction in the severity of destructive effects caused by erosion. According to the adopted methodology, stretches classified as eroding are those that experienced a retreat of the shoreline towards the hinterland of at least 5 meters compared to the previous survey. Considering that Italian beaches are generally a few kilometers long and a few dozen meters wide, even progressive retreats of a few meters can cause destructive effects, manifesting as a significant reduction in beach width and, in extreme cases, complete inland repositioning of the beach (as shown in Figure 3).
Periodic surveys have shown that shoreline retreat and the loss of marine-coastal surfaces are especially evident and severe at river mouths. Entire beaches have significantly retreated, resulting in the loss of land and its environmental and economic value. In many cases, coastal erosion threatens the safety of homes, roads, and railways, particularly during storm surges.
Figure 5 shows that processes modifying the coastal layout prevail over the stability of sandy low coasts. It also includes the extent of rocky coasts to provide context on their presence across regions. Regions such as Sardinia, Sicily, and Puglia feature a high proportion of rocky coastline.
Regarding the overall balance of unstable coasts and changes detected in 2020 compared to 2006, Figure 6 shows that Veneto, Tuscany, and Abruzzo have progradation rates almost twice those of erosion—and to a lesser extent, Calabria, Marche, and Sicily. Meanwhile, in Sardinia, Puglia, and Lazio, erosion rates significantly exceed those of progradation, highlighting the intensity of dynamic processes at the regional level and the dominant trend—between shoreline advance and retreat.
In general, erosion affects coastlines in all coastal regions. Table 2 provides more detailed information on each region, in relation to coastal type and variation rates as percentages of the total Italian coast. For example, Veneto, Emilia-Romagna, and Molise have no rocky coastline, unlike Sardinia, Tuscany, and Campania, where rocky components exceed 60% of their coastal length.
Therefore, the coastline defined as stable refers only to low sandy shores that show no ±5 m variation. Liguria, Emilia-Romagna, and Molise display a largely dynamic balance.
The most interesting data are shown in Figures 7A and 7B. The first highlights which regions concentrate the highest values of coastal advance: Calabria, Tuscany, and especially Sicily, where the shoreline sections affected by coregistration processes extend for about 140 km.
Figure 7B shows the regions contributing most to increased erosion: Sardinia, Lazio, and Puglia, the latter also affected by coregistration processes (26 km in Lazio and 40 km in Puglia).
It is notable that Calabria, Sicily, and to a lesser extent Tuscany, show a decrease in eroding coasts (Figure 7A) in favor of significant progradation (Figure 7B).
In Sardinia, erosion has increased since 2006, as it has in Puglia, Lazio, and Emilia-Romagna. In areas showing greater stability and corresponding decreases in erosion, this is generally the probable—and hoped-for—result of numerous efforts undertaken in past decades to mitigate degradation and retreat processes, as well as further protection and restoration interventions carried out between 2006 and 2020.