Giorgio Cattani, Mariacarmela Cusano, Alessandro Di Menno di Bucchianico, Raffaela Gaddi, Alessandra Gaeta, Giuseppe Gandolfo, Gianluca Leone
The indicator is based on PM concentration data 10 in the atmosphere measured during 2024 in monitoring stations distributed throughout the national territory, collected and archived in ISPRA in the InfoAria database, in accordance with the provisions of Directive 2008/50/EC (and the legislative decree implementing Legislative Decree 155/2010) and Decision 2011/850/EU. The monitoring stations that measured and reported PM data 10 there are 576., of which those with sufficient time coverage for the verification of the reference values are 545. The annual limit value was exceeded in one station (equal to 0.2% of cases), while exceeding the daily limit value was recorded in 94 stations (equal to 17.2% of cases). Finally, both the annual WHO reference value (90.5% of cases) and the daily one (96.1% of cases) are exceeded in the majority of monitoring stations.
Airborne particulate matter refers to all solid and liquid atmospheric particles suspended in ambient air. The term PM 10 identifies particles with an aerodynamic diameter less than or equal to 10 μm. These are characterized by long residence times in the atmosphere and can, therefore, be transported even at great distances from the point of emission, they have a particularly complex and variable chemical nature, they are able to penetrate the human respiratory tree, with negative effects on health.
PM particulate matter 10 it is partly emitted as such directly from sources in the atmosphere (PM 10 primary) and is partly formed in the atmosphere through chemical reactions between other polluting species (PM 10 secondary). The PM 10 it can have both a natural origin (wind erosion on rocks, volcanic eruptions, spontaneous fires) and anthropic origin (combustions and more). Among the main anthropic sources, an important role is represented by the use of wood in civil heating and vehicular traffic. Many of the gaseous substances that contribute to the formation of PM are also of anthropogenic origin 10 secondary, such as sulfur and nitrogen oxides, VOCs (Volatile Organic Compounds) and ammonia.
The indicator was developed based on PM concentration data 10 in the atmosphere, measured in monitoring stations distributed throughout the national territory, collected and archived in ISPRA in the InfoARIA database in accordance with the provisions of Decision 2011/850/EU. In addition to the parameters for a comparison with the limit values for the protection of human health established by the reference legislation (Legislative Decree 155/2010) and with the reference values established by the WHO for the protection of human health (WHO-AQG, 2021), the average, 5th, 25th, 50th, 75th, 90.4th and 99.2nd percentile and maximum of the daily average values were calculated.
Provide information on the state of air quality through statistical parameters calculated from PM concentration data 10 in ambient air, verification of compliance with the limit values established by the legislation and comparison with the reference values established by the WHO.
Decision 2011/850/EU – Commission Implementing Decision laying down rules for Directive 2004/107/EC and Directive 2088/50/EC of the European Parliament and of the Council as regards the reciprocal exchange of information and reporting on ambient air quality.
The objective of Directive 2008/50/EC is to allow the assessment of air quality on a common basis, to obtain information on the state of air quality in order to combat air pollution, to ensure the public availability of information and to promote cooperation between Member States. Legislative Decree 155/2010, which implements the aforementioned directive at a national level, also has the objective of allowing autonomous regions and provinces to evaluate and manage ambient air quality. The limit values of Legislative Decree 155/2010 represent the ambient air quality objectives to be pursued to avoid, prevent and reduce harmful effects on human health and the environment as a whole. The World Health Organization (WHO) reference values represent a guide to follow in reducing the impact of air pollution on human health. The limit values of PM10 particulate matter in ambient air established by Legislative Decree 155/2010 are as follows:
- for the 24-hour averaging period the limit value is 50 µg/m³ not to be exceeded more than 35 times per calendar year;
- for the averaging period of one calendar year the limit value is 40 µg/m³.
While, the WHO reference values for PM10 particulate matter in ambient air indicated in WHO global air quality guidelines 2021 are the following:
- for the 24-hour averaging period the WHO reference value is 45 µg/m³ to be recorded at the 99th percentile of the daily averages of a calendar year;
- for the averaging period of one calendar year the WHO reference value is 15 µg/m³.
ISPRA. (various editions). Environmental data yearbook.
SNPA. (2024). Air quality in Italy. 2023 edition. SNPA system report 40/2024.
World Health Organization. (2021). Global air quality guidelines: Particulate matter (PM2.5 and PM10), ozone, nitrogen dioxide, sulfur dioxide and carbon monoxide . Geneva: WHO.
https://www. snpambiente. it/notizie/snpa/qualita-dellaria-nel-2024/
Autonomous Provinces, Regions, SNPA (National System for Environmental Protection)
Databases InfoAria-ISPRA
National
Regional: (20/20)
Provincial: (104/110)
Municipal: (386/8047)
2015-2024
The indicator is based on PM concentration data 10 in the atmosphere, measured in monitoring stations distributed throughout the national territory, collected and archived in ISPRA, in the InfoAria database as required by Decision 2011/850/EU. The parameters were calculated for a comparison with the limit values for the protection of human health established by the reference legislation (Legislative Decree 155/2010) and with the reference values established by the WHO for the protection of human health. All parameters were calculated following European rules and were subjected to verification by the Regions/PPAA/ARPA/APPA. For the comparison with the daily and annual limit values of Legislative Decree 155/2010 and with the WHO reference values (both shown in Figures 2 and 3), data series with a minimum time coverage of 90% were used (net of data losses due to periodic calibration or ordinary maintenance).
The statistical analysis of the trend (2015-2024) was conducted with the Mann-Kendall method corrected for seasonality. Implementing a deseasonalization method allows us to minimize the effect of interannual oscillations due to the differences found in the various years compared to the average seasonal cycle, to highlight the existence of an underlying trend, to quantify its statistical significance and to estimate the variation in average annual concentration in the observation period.
In 2024 the annual limit value was exceeded in one station (equal to 0.2% of cases). The daily limit value was exceeded in 94 stations (equal to 17.2% of cases) largely located in the Po basin and in some urban areas of the Centre-South. Finally, in the majority of monitoring stations, both the annual WHO reference value (90.5% of cases) and the daily one (96.1% of cases) are exceeded (Table 1, Figures 2 and 3).
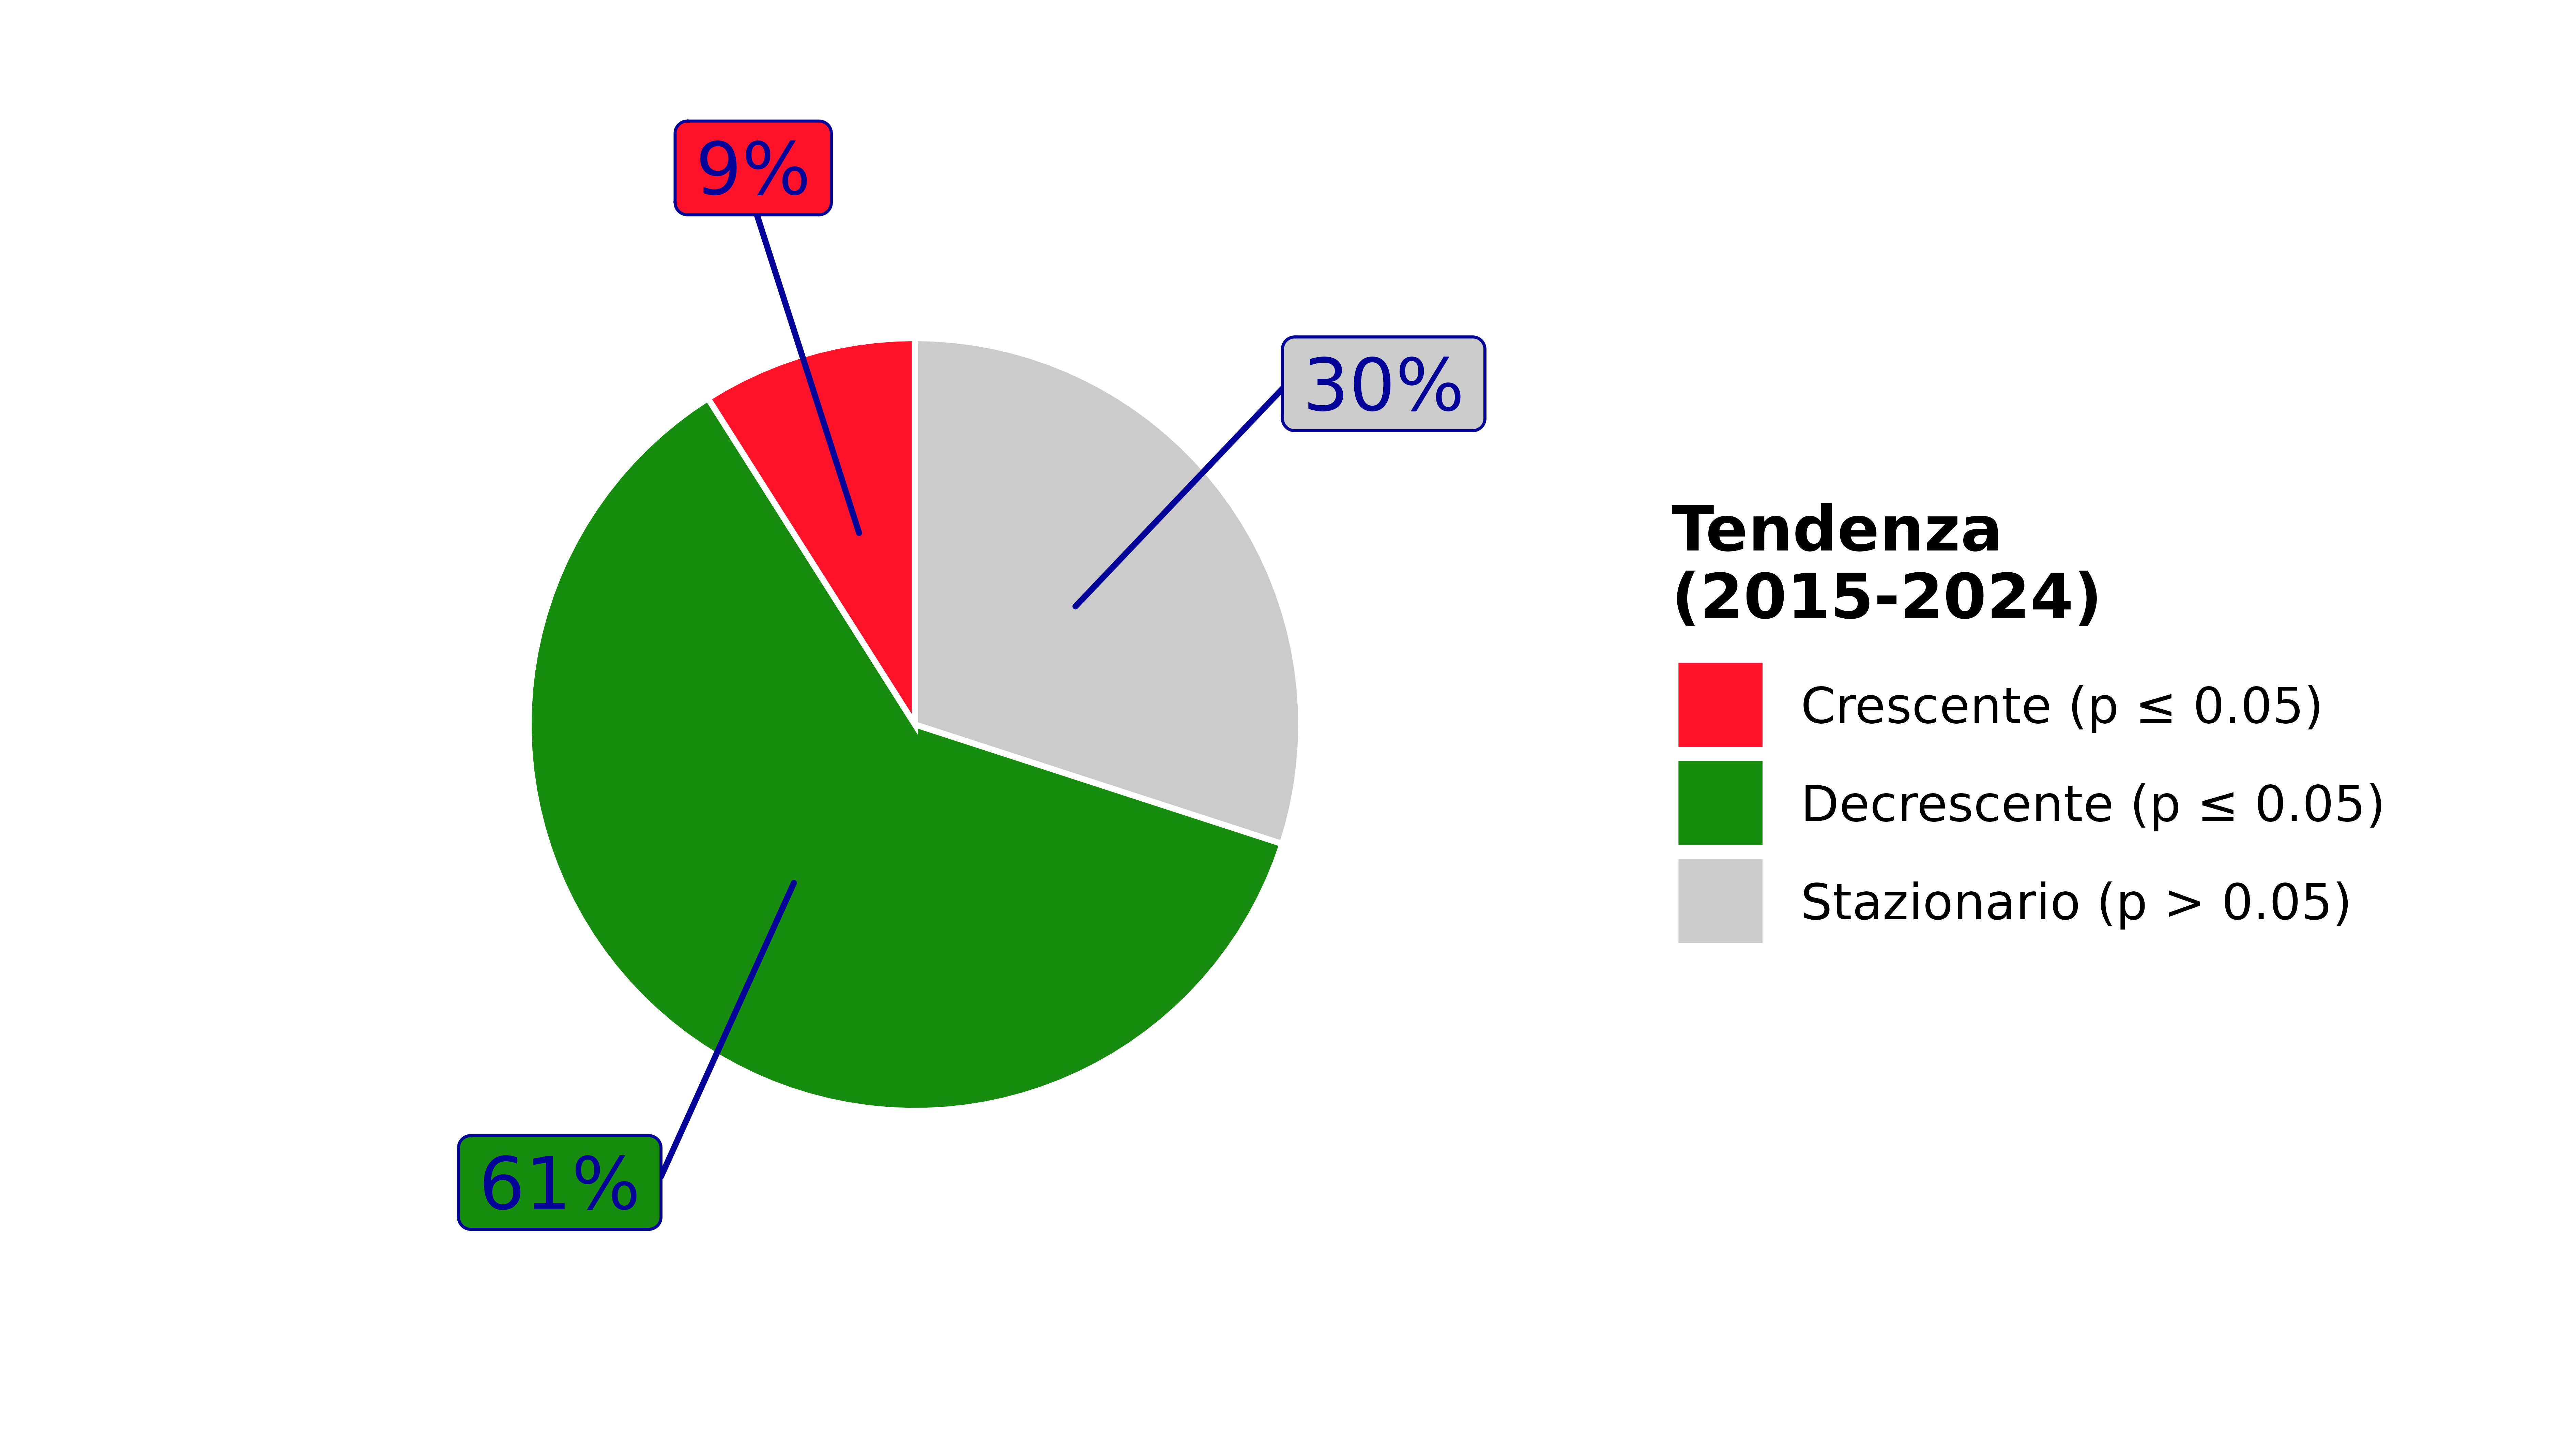
For the PM 10 a statistically significant decreasing trend is observed in 61% of cases (288 monitoring stations out of 474), with an estimated average annual variation: -0.7 µg/m³y [-3.5 µg/m³y ÷ -0.1 µg/m³y].
On the portion of the sample considered for which a statistically significant decreasing trend was identified, an average annual variation of -2.5% (-15.6% ÷ -0.6%) is observed. In 30% of cases (144 monitoring stations out of 474) it is not possible to identify a statistically significant trend for PM 10 (Table 4, Figures 4 and 5).
| Data |
|---|
Thumbnail
Headline
Figure 1: PM₁₀ – Classification of sampling sites according to macroscale siting criteria (Annex III, Legislative Decree 155/2010) (2024) Data source
Processing by ISPRA based on SNPA data |
Thumbnail
Headline
Figure 2: PM₁₀ – Monitoring stations and exceedances of the daily limit value for the protection of human health (2024) Data source
Figure 1: PM₁₀ – Classification of sampling sites according to macroscale siting criteria (Annex III, Legislative Decree 155/2010) (2024) Data legend
AQG – WHO Air Quality Guideline level: 45 µg/m³, 99th percentile; IT4 – WHO Interim Target 4: 50 µg/m³, 99th percentile; LV – Limit value for the protection of human health (Legislative Decree 155/2010): 50 µg/m³, not to be exceeded more than 35 times per calendar year |
Thumbnail
Headline
Figure 3: PM10 – Monitoring stations and exceedances of the annual limit value for the protection of human health (2024) Data source
Processing by ISPRA based on SNPA data |
Thumbnail
Headline
Figure 4: PM10 – Estimated average annual percentage change in concentration at the 474 monitoring stations analysed Data source
Processing by ISPRA based on SNPA data Note
Results of the trend analysis (2015–2024) using the seasonality-adjusted Kendall test on a sample of 474 monitoring stations. |
Thumbnail
Headline
Figure 5: PM10 – Percentage distribution of monitoring stations according to the observed trend over the period 2015–2024. Data source
Processing by ISPRA based on SNPA data |
Headline
Table 1: PM10 – Monitoring stations: data and statistical parameters for air quality assessment (2024) Data source
Processing by ISPRA based on SNPA data Data legend
“1” Zone type: U = URBAN; S = SUBURBAN; R = RURAL “2” Station type: T = TRAFFIC; B = BACKGROUND; I = INDUSTRIAL “3” Values shown in bold are reported on the map. Values are highlighted in bold only for data series with at least 90% valid data, net of losses due to periodic calibration or routine maintenance (in accordance with the quality criteria defined by current legislation, Legislative Decree 155/2010). “–” Value not calculated due to lack of data. |
Headline
Table 2 – PM10: Classification of zones with respect to assessment thresholds and verification of exceedances of the daily limit value in accordance with Legislative Decree 155/2010 (2024) Data source
Processing by ISPRA based on SNPA data Data legend
zona: parte del territorio nazionale delimitata, ai sensi del D.Lgs 155/2010, ai fini della valutazione e della gestione della qualità dell'aria ambiente; agglomerato: zona costituita da un'area urbana o da un insieme di aree urbane che distano tra loro non più di qualche chilometro oppure da un'area urbana principale e dall'insieme delle aree urbane minori che dipendono da quella principale sul piano demografico, dei servizi e dei flussi di persone e merci, avente: 1) una popolazione superiore a 250.000 abitanti oppure; 2) una popolazione inferiore a 250.000 abitanti e una densità di popolazione per km 2 superiore a 3.000 abitanti;" Superamento VL giornaliero: Si intende superato qualora sia stato determinato il superamento in almeno una stazione di monitoraggio collocata nel territorio della zona. Classificazione: aboveUAT: superiore alla soglia di valutazione superiore (70% del valore limite, 35 μg/m³ da non superare più di 35 volte per anno civile); LAT-UAT : compresa tra la soglia di valutazione inferiore e la soglia di valutazione superiore; belowLAT : inferiore alla soglia di valutazione inferiore (50% del valore limite, 25 μg/m³ da non superare più di 35 volte per anno civile) Note
Exceedance of the upper and lower assessment thresholds shall be determined on the basis of ambient air pollutant concentrations over the five preceding calendar years. An exceedance is deemed to occur if the assessment threshold has been exceeded in at least three of the five preceding calendar years. |
Headline
Table 3 – PM10: Classification of zones with respect to assessment thresholds and verification of exceedances of the annual limit value in accordance with Legislative Decree 155/2010 (2024) Data source
Processing by ISPRA based on SNPA data Data legend
Zone: a delimited portion of the national territory, as defined by Legislative Decree 155/2010, for the purposes of ambient air quality assessment and management; Agglomeration: a zone consisting of an urban area or a group of urban areas located no more than a few kilometres apart, or of a main urban area together with a set of smaller urban areas that depend on the main one in terms of population, services, and flows of people and goods, having:
Daily limit value (LV) exceedance: an exceedance is considered to have occurred when it is detected at least at one monitoring station located within the territory of the zone. Classification:
(a) Exceedance assessment obtained through modelling. Note
Exceedance of the upper and lower assessment thresholds shall be determined on the basis of ambient air pollutant concentrations over the five preceding calendar years. An exceedance is considered to occur if the assessment threshold has been exceeded in at least three of the five preceding calendar years. |
Headline
Table 4 – PM10: Trend analysis by monitoring station (2015–2024) Data source
Processing by ISPRA based on SNPA data Data legend
p ≤ 0.05: the observed trend is statistically significant p > 0.05: the null hypothesis (no trend) cannot be rejected Δy: estimated average annual change based on the results of the seasonality-adjusted Kendall test |
The monitoring stations that measured and reported PM data 10 there are 576. Of these, 545 (94.6% of the total) have a minimum time coverage of 90% (net of data losses due to periodic calibration or ordinary maintenance). All regions are represented (Table 1). The classification of PM monitoring stations 10 according to the macroscale location criteria envisaged by the legislation, it is represented in Figure 1.
Exceeding the daily limit value affected 23 out of 82 zones distributed across 10 regions, while no area recorded exceeding the annual limit value (Table 2 and Table 3).
the statistical analysis of PM concentration trends is also reported 10 determined from 2015 to 2024 in 474 monitoring stations across the country. The sample is homogeneous, i. e. All these stations produced data continuously over the period, with an annual coverage of at least 75% (Table 4).