Panel 1
Angelo Santini, Fabio Tatti
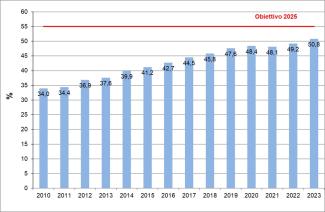
In 2023, the preparation for re-use and recycling rate—calculated using Methodology 4 and excluding construction and demolition (C&D) waste from household sources—stood at 50.8%, thus exceeding the 50% target set for 2020.
The indicator measures the ratio between the quantity of municipal waste prepared for reuse or recycled in a given year and the total waste produced in the same year, according to Calculation Methodology 4 established by Decision 2011/753/EU.
To assess compliance with the municipal waste preparation for reuse and recycling targets established by regulations.
Directive 2008/98/EC (transposed by Legislative Decree No. 205/2010, which introduced recycling targets in Article 181 of Legislative Decree No. 152/2006) initially set a 50% weight-based target for municipal waste preparation for reuse and recycling to be achieved by 2020. According to Article 11, paragraph 2 of the directive, this target applies at least to "paper, metals, plastic, and glass waste from households, and possibly from other sources, where such waste streams are similar to household waste."
The issuance of Directive 2018/851/EU introduced additional preparation for reuse and recycling targets:
- 55% by 2025
- 60% by 2030
- 65% by 2035
These new targets apply to the entire volume of municipal waste rather than specific waste fractions. Consequently, only Methodology 4 must be used for calculation. The rules for assessing compliance with these targets are outlined in Article 11 bis of Directive 2008/98/EC, as amended by Directive 2018/851/EU. To ensure uniform calculation conditions, Implementing Decision 2019/1004/EU was adopted.
For monitoring the 50% target for 2020 (Article 11, paragraph 2, letter a of Directive 2008/98/EC), previous methodologies remain valid. The new targets and calculation rules have been transposed into national legislation through Legislative Decree No. 116/2020, which introduced these objectives into Article 181 of Legislative Decree No. 152/2006, where the 2020 target was already stated, and defined the rules in Article 205-bis.
Panel 2
ISPRA - Rapporto Rifiuti urbani (various editions)
Deepen the understanding of waste treatment processes in order to assess the impact of the waste generated by those processes. If significant, such waste must be excluded from the calculation of the preparation for reuse and recycling rate. Establish a reliable database on the average composition of municipal waste generated in different territorial contexts.
Data quality assessment
ISPRA
I dati derivano da elaborazioni e stime condotte a partire dalle informazioni sulla produzione, raccolta e gestione dei rifiuti urbani. Queste ultime sono liberamente consultabili e scaricabili dal sito www.catasto-rifiuti.isprambiente.it.
National
2010-2023
Indicator assessment
The indicator measures the ratio between the quantity of municipal waste prepared for reuse or recycled in a given year and the total waste produced in the same year, following Calculation Methodology 4 established by Decision 2011/753/EU.
The data related to different components of the calculation formula are processed through the following procedures:
• For fractions from multi-material collection, ISPRA already separates rejects to quantify the amounts of individual fractions. According to the updated criteria for municipal waste production and collection established by the Decree of May 26, 2016, multi-material collection is accounted for as a whole, including rejects. Regardless of the calculation methods applied for quantifying separate waste collection, rejects must be excluded for recycling target calculations. Thus, multi-material waste must be considered net of this component. Additionally, some fractions included in separate waste collection under the new criteria (e.g., construction and demolition waste) do not contribute to achieving municipal waste recycling targets under EU law but rather to specific targets for C&D waste.
• For single-material collection, percentage distributions by quality category, assigned by CONAI and sector consortia with corresponding rejects, are applied. Each quality category has a defined range for foreign material (rejects), with a maximum limit for the highest category and a minimum limit for the lowest category.
• For organic waste, calculations are based on inputs to composting and anaerobic digestion plants, net of treatment process rejects, rather than separate collection data.
• For WEEE (Waste Electrical and Electronic Equipment), the reject percentage (non-WEEE) is determined for each group and refers to the proportion indicated by the Coordination Center.
• Additionally, quantities from mechanical-biological treatment processes of unsorted municipal waste destined for material recovery operations are considered as recycled.
In 2023, the preparation for re-use and recycling rate reached 50.8%, exceeding the 2020 target of 50% when calculated using Methodology 4 and excluding construction and demolition (C&D) waste from household sources. However, this percentage remains below the 2025 target of 55%.
The trend of the indicator is positive, showing a steady increase in the national recycling rate over the years. Specifically, between 2010 and 2023, an increase of 16.8 percentage points was recorded using Calculation Methodology 4 (Figure 1).
Data
Table 1: Average composition of municipal waste estimated by ISPRA (average for the period 2009–2022*)
ISPRA


The indicator is explicitly established by specific European Union regulatory provisions and is intended to assess the effectiveness of measures implemented by Member States to ensure compliance with the EU waste hierarchy and to monitor progress toward the transition to a circular economy.
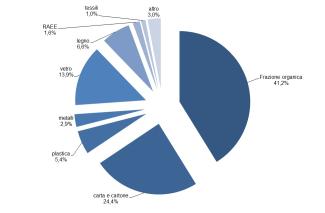
An analysis of the composition of waste sent for recycling by material stream in 2023 reveals that 41.2% (up from 41% in 2022) consisted of organic waste. Paper and cardboard accounted for 24.4% (down from 24.9% in 2022), while glass represented 13.9%, wood 6.6%, and plastic 5.4% of the total recycled waste (Figure 2).
According to ISPRA estimates based on the period 2009–2022 (the latest year for which waste composition data are available), at the national level, nearly 35% of the total municipal waste produced annually consists of organic waste—mainly biodegradable materials from kitchens, canteens, and garden and park maintenance. Paper and cardboard account for just under 22%, while plastics make up slightly less than 13% (Table 1).