Gabriella Aragona, Lucia Muto
The indicator measures the quantities of Waste from Economic Activities that are intended abroad for the purposes of recovery and disposal. In 2023, the total amount of special waste exported is 5.5 million tons, of which 3.7 million tons are non-hazardous waste (67% of the total) and 1.8 million tons are dangerous waste (33% of the total). The major quantities of waste are intended for Germany and Austria, respectively about 1.2 million tons and over 700 thousand tons.
The indicator measures the quantities of Waste from Economic Activities that are intended abroad for the purposes of recovery and disposal, specifying the countries of destination and the type of refusal.
Analyze which types of waste are destined abroad for the purposes of recovery and disposal.
• Basel Convention of 22/03/1989 on the control of cross-border movements of hazardous waste and their disposal and subsequent amendments;
• OCSE C decision (2001) 107 on the control of cross-border movements of waste intended for recovery;
• Regulation 1013/2006/EC and S. M. I. Governing the shipment of waste between community member states, also through third countries;
• Regulation 1418/2007/EC and S. M. I. Relating to the export of some waste intended for the recovery, to some countries to which the OECD decision does not apply.
There are no specific targets set by the regulations.
ISPRA - Rapporto rifiuti speciali 2025
ISPRA
ISPRA, MUD database, not accessible to the public
National, regional
2010-2023
The quantities are analyzed for single EER code (European waste list), by region of origin and by country of destination.
The total amount of Waste from Economic Activities exported in 2023 was 5.5 million tonnes, of which 67% consisted of non-hazardous waste and the remaining 33% of hazardous waste; this represents an increase of 13.4% compared to 2022 (Table 1).
When analyzing the exported quantity in relation to the total generated (164.5 million tonnes), the share appears marginal, accounting for only 3.3%. However, when considering the exported quantity of hazardous Waste from Economic Activities in relation to the total hazardous waste produced (10.2 million tonnes), the value rises to 17.8%.
In the period 2010–2023, the total quantity of exported Waste from Economic Activities increased by 44.3% (Table 1), while production rose by 20%. Analyzing exported waste in relation to that produced, a value of 2.8% was recorded in 2010 compared to 3.3% in 2023. The slight variation observed over the period allows the trend to be considered stable.
| Data |
|---|
Headline
Table 1: Waste from Economic Activities Exported from Italy Data source
ISPRA |
Headline
Table 2: Waste from Economic Activities exported by country of destination Data source
ISPRA |
Headline
Table 3: Waste from Economic Activities exported by region of origin, 2023 Data source
ISPRA |
Thumbnail
Headline
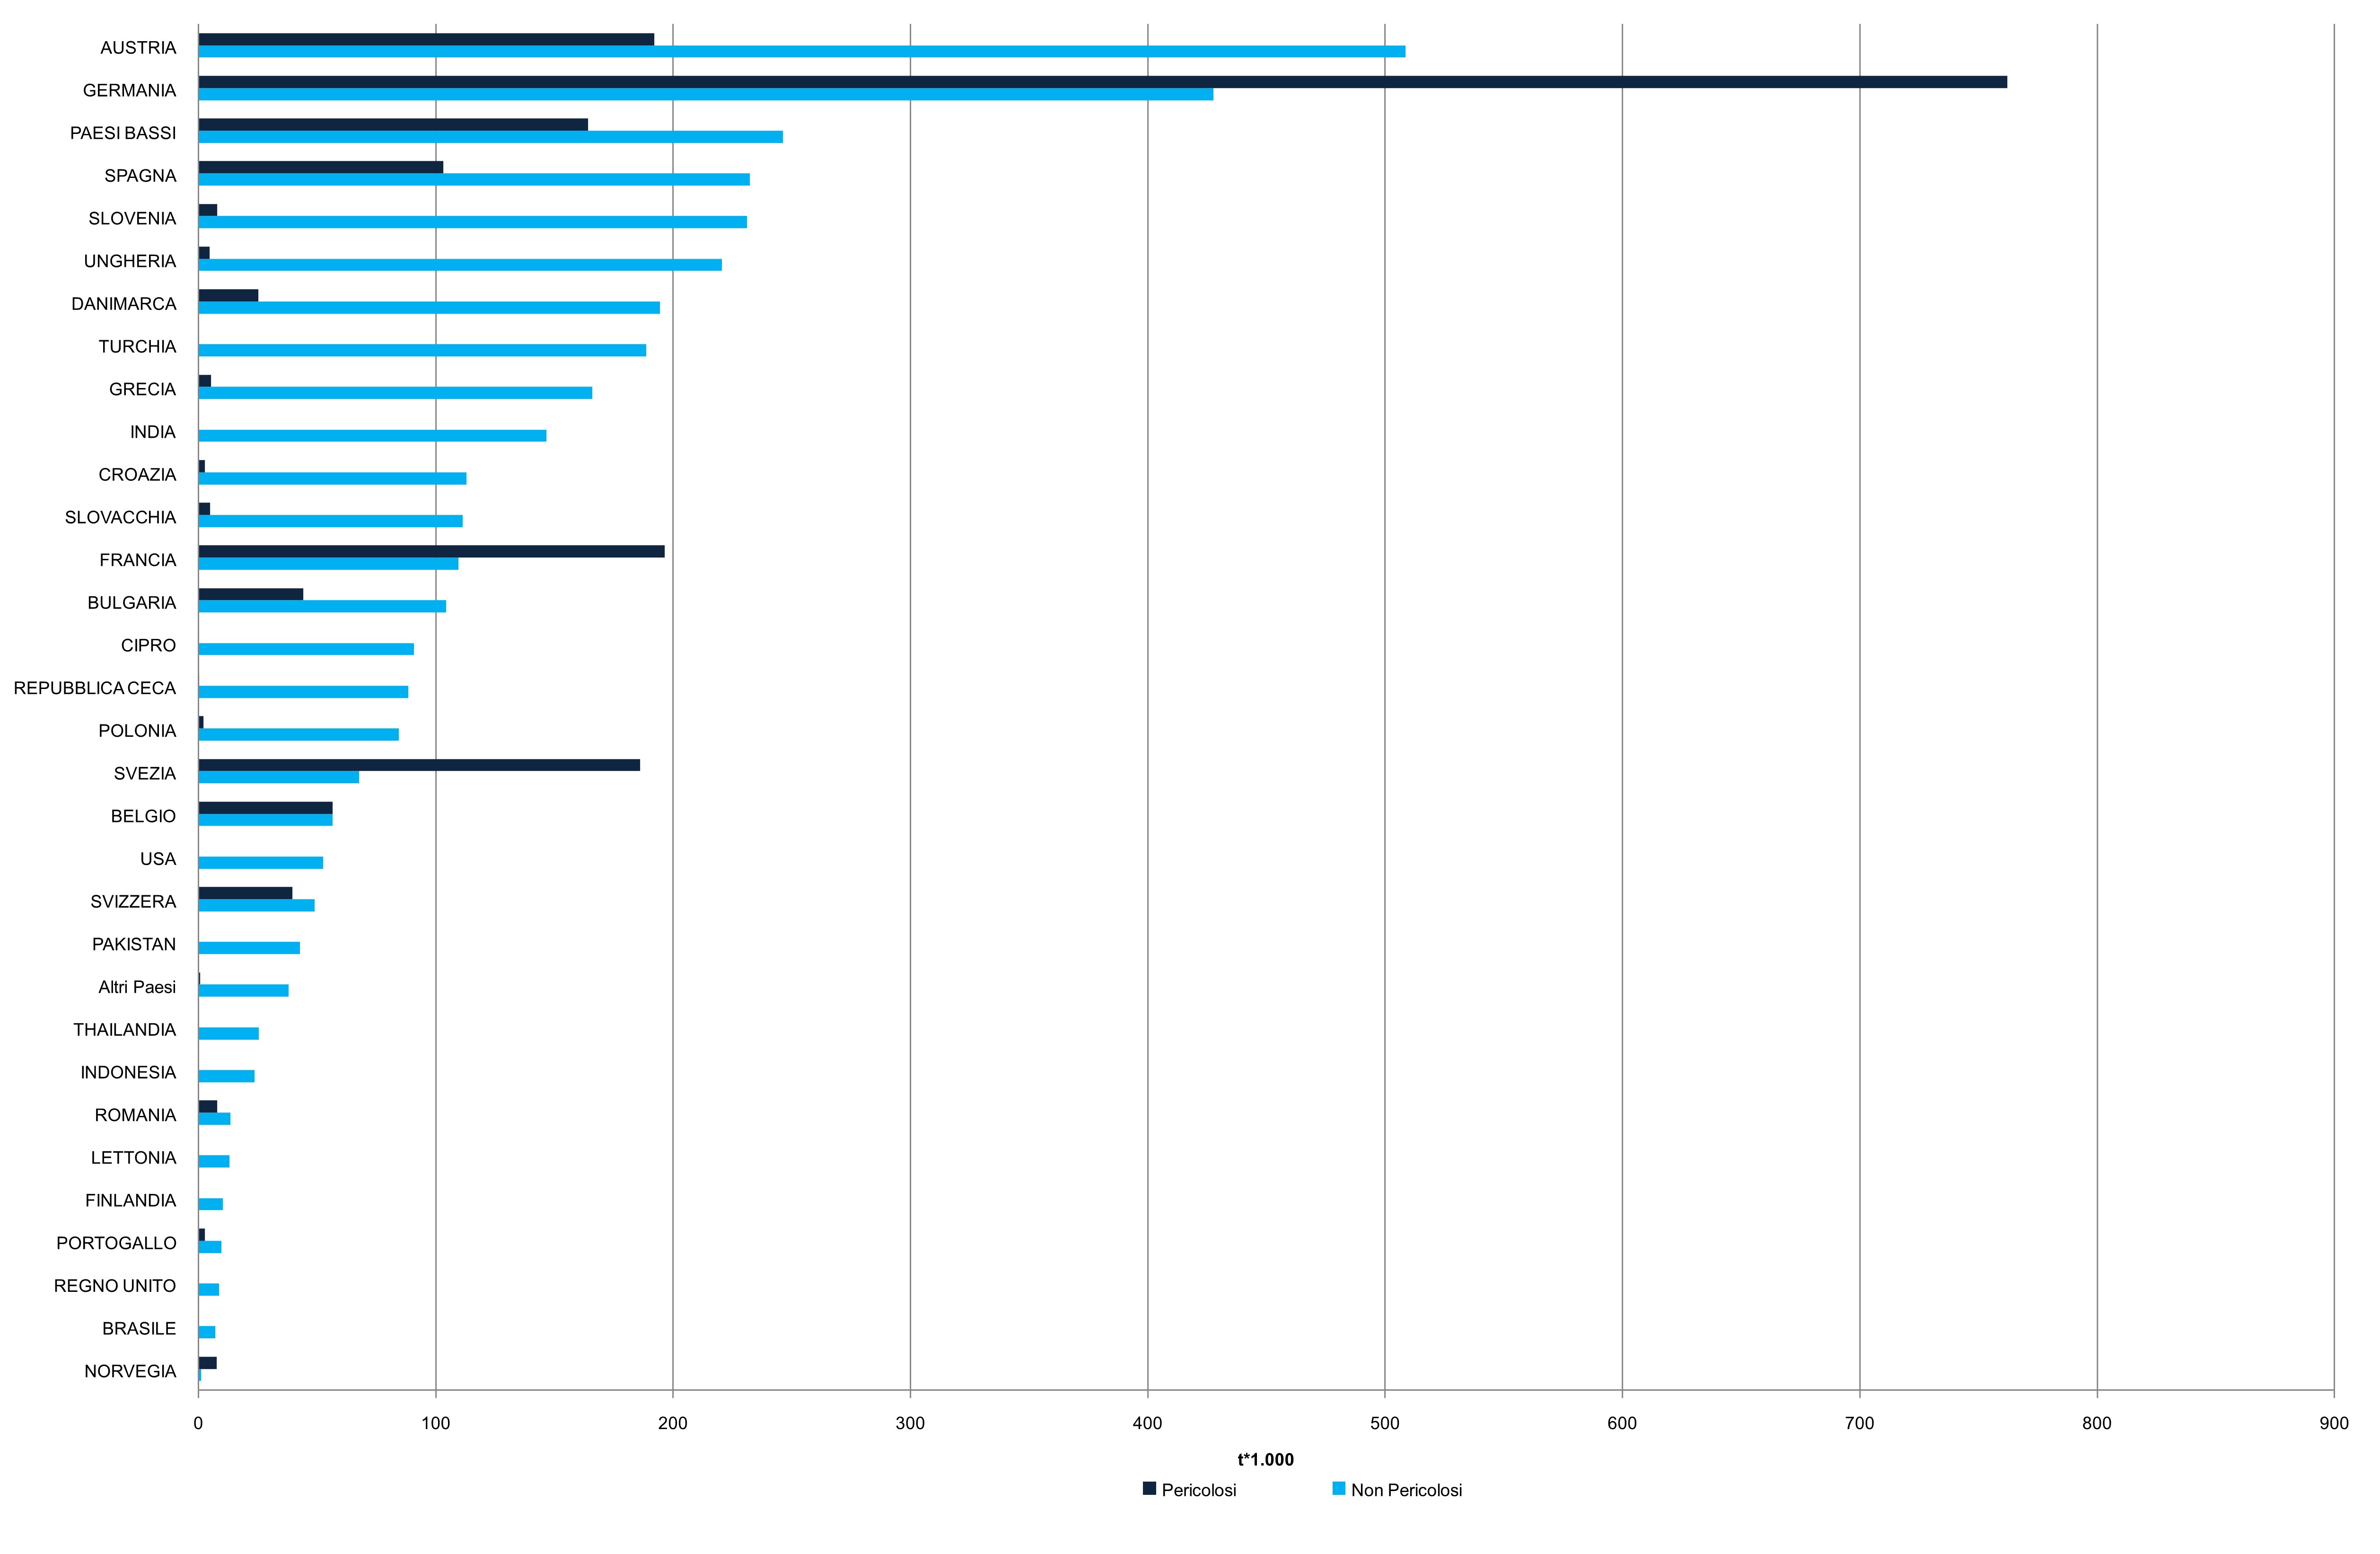
Figure 1: Waste from Economic Activities exported by country of destination, 2023 Data source
ISPRA |
Thumbnail
Headline
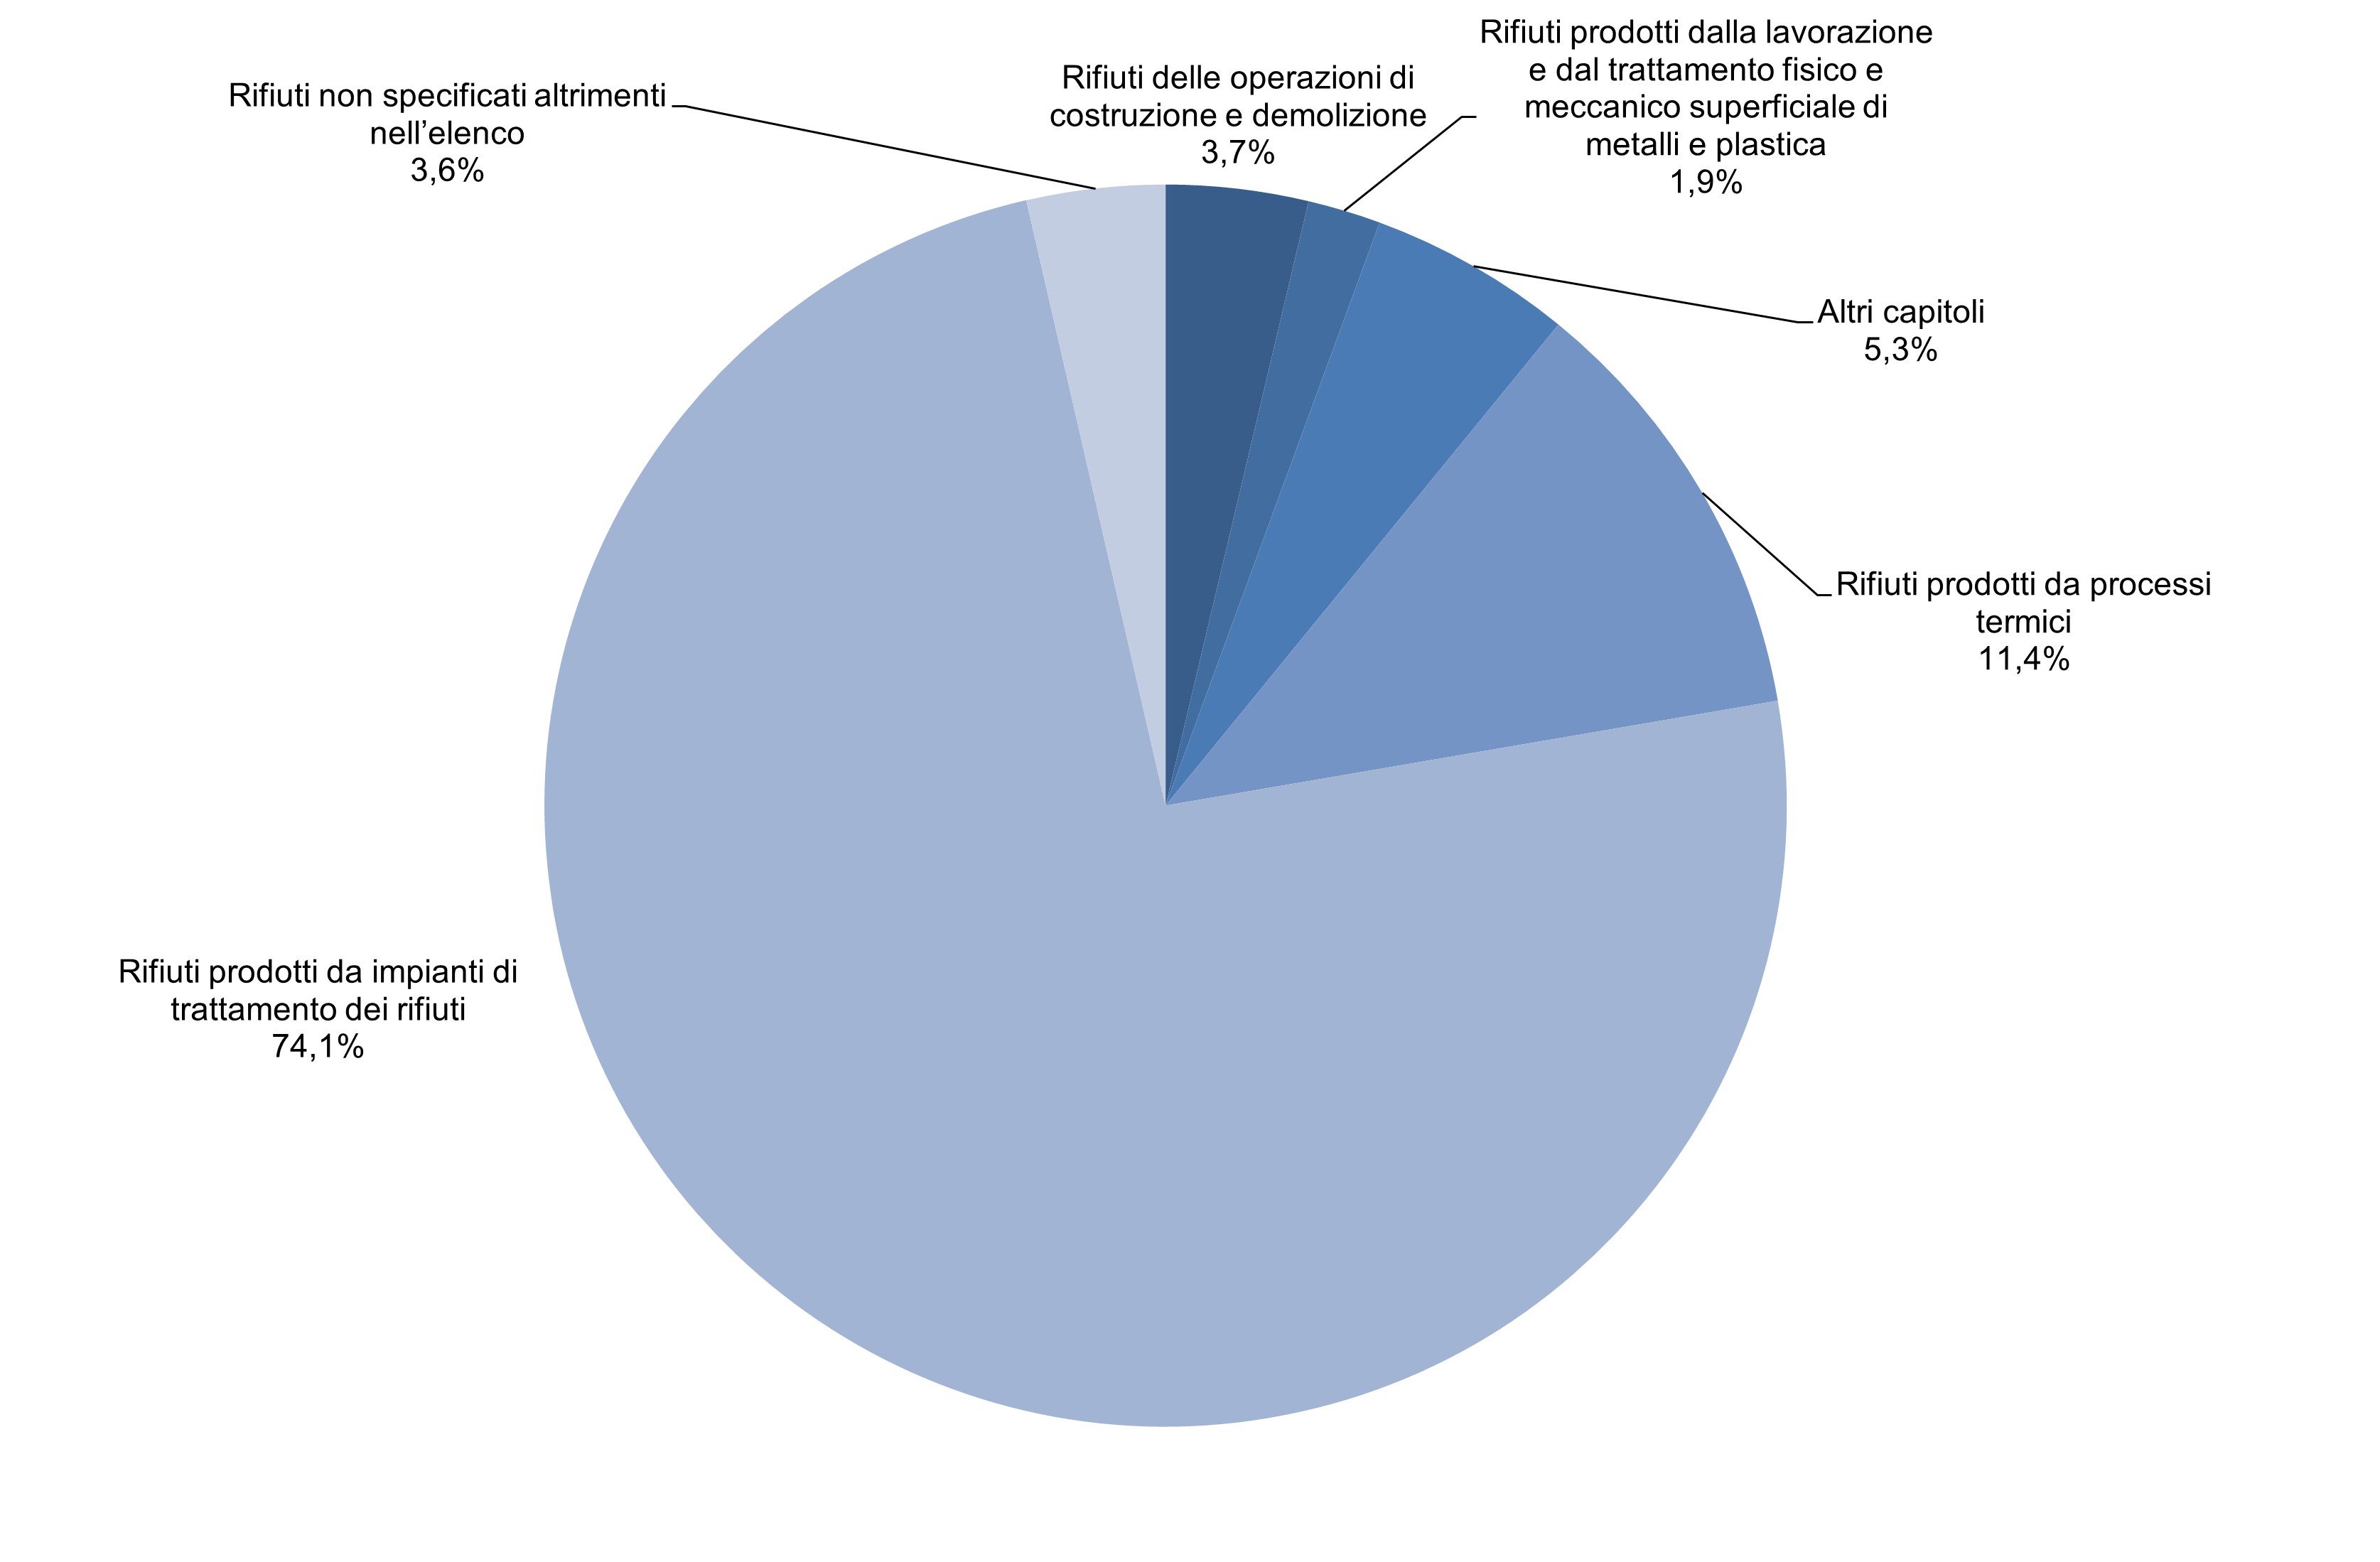
Figure 2: Non-hazardous Waste from Economic Activities exported by European Waste Catalogue chapter (2023) Data source
ISPRA |
Thumbnail
Headline
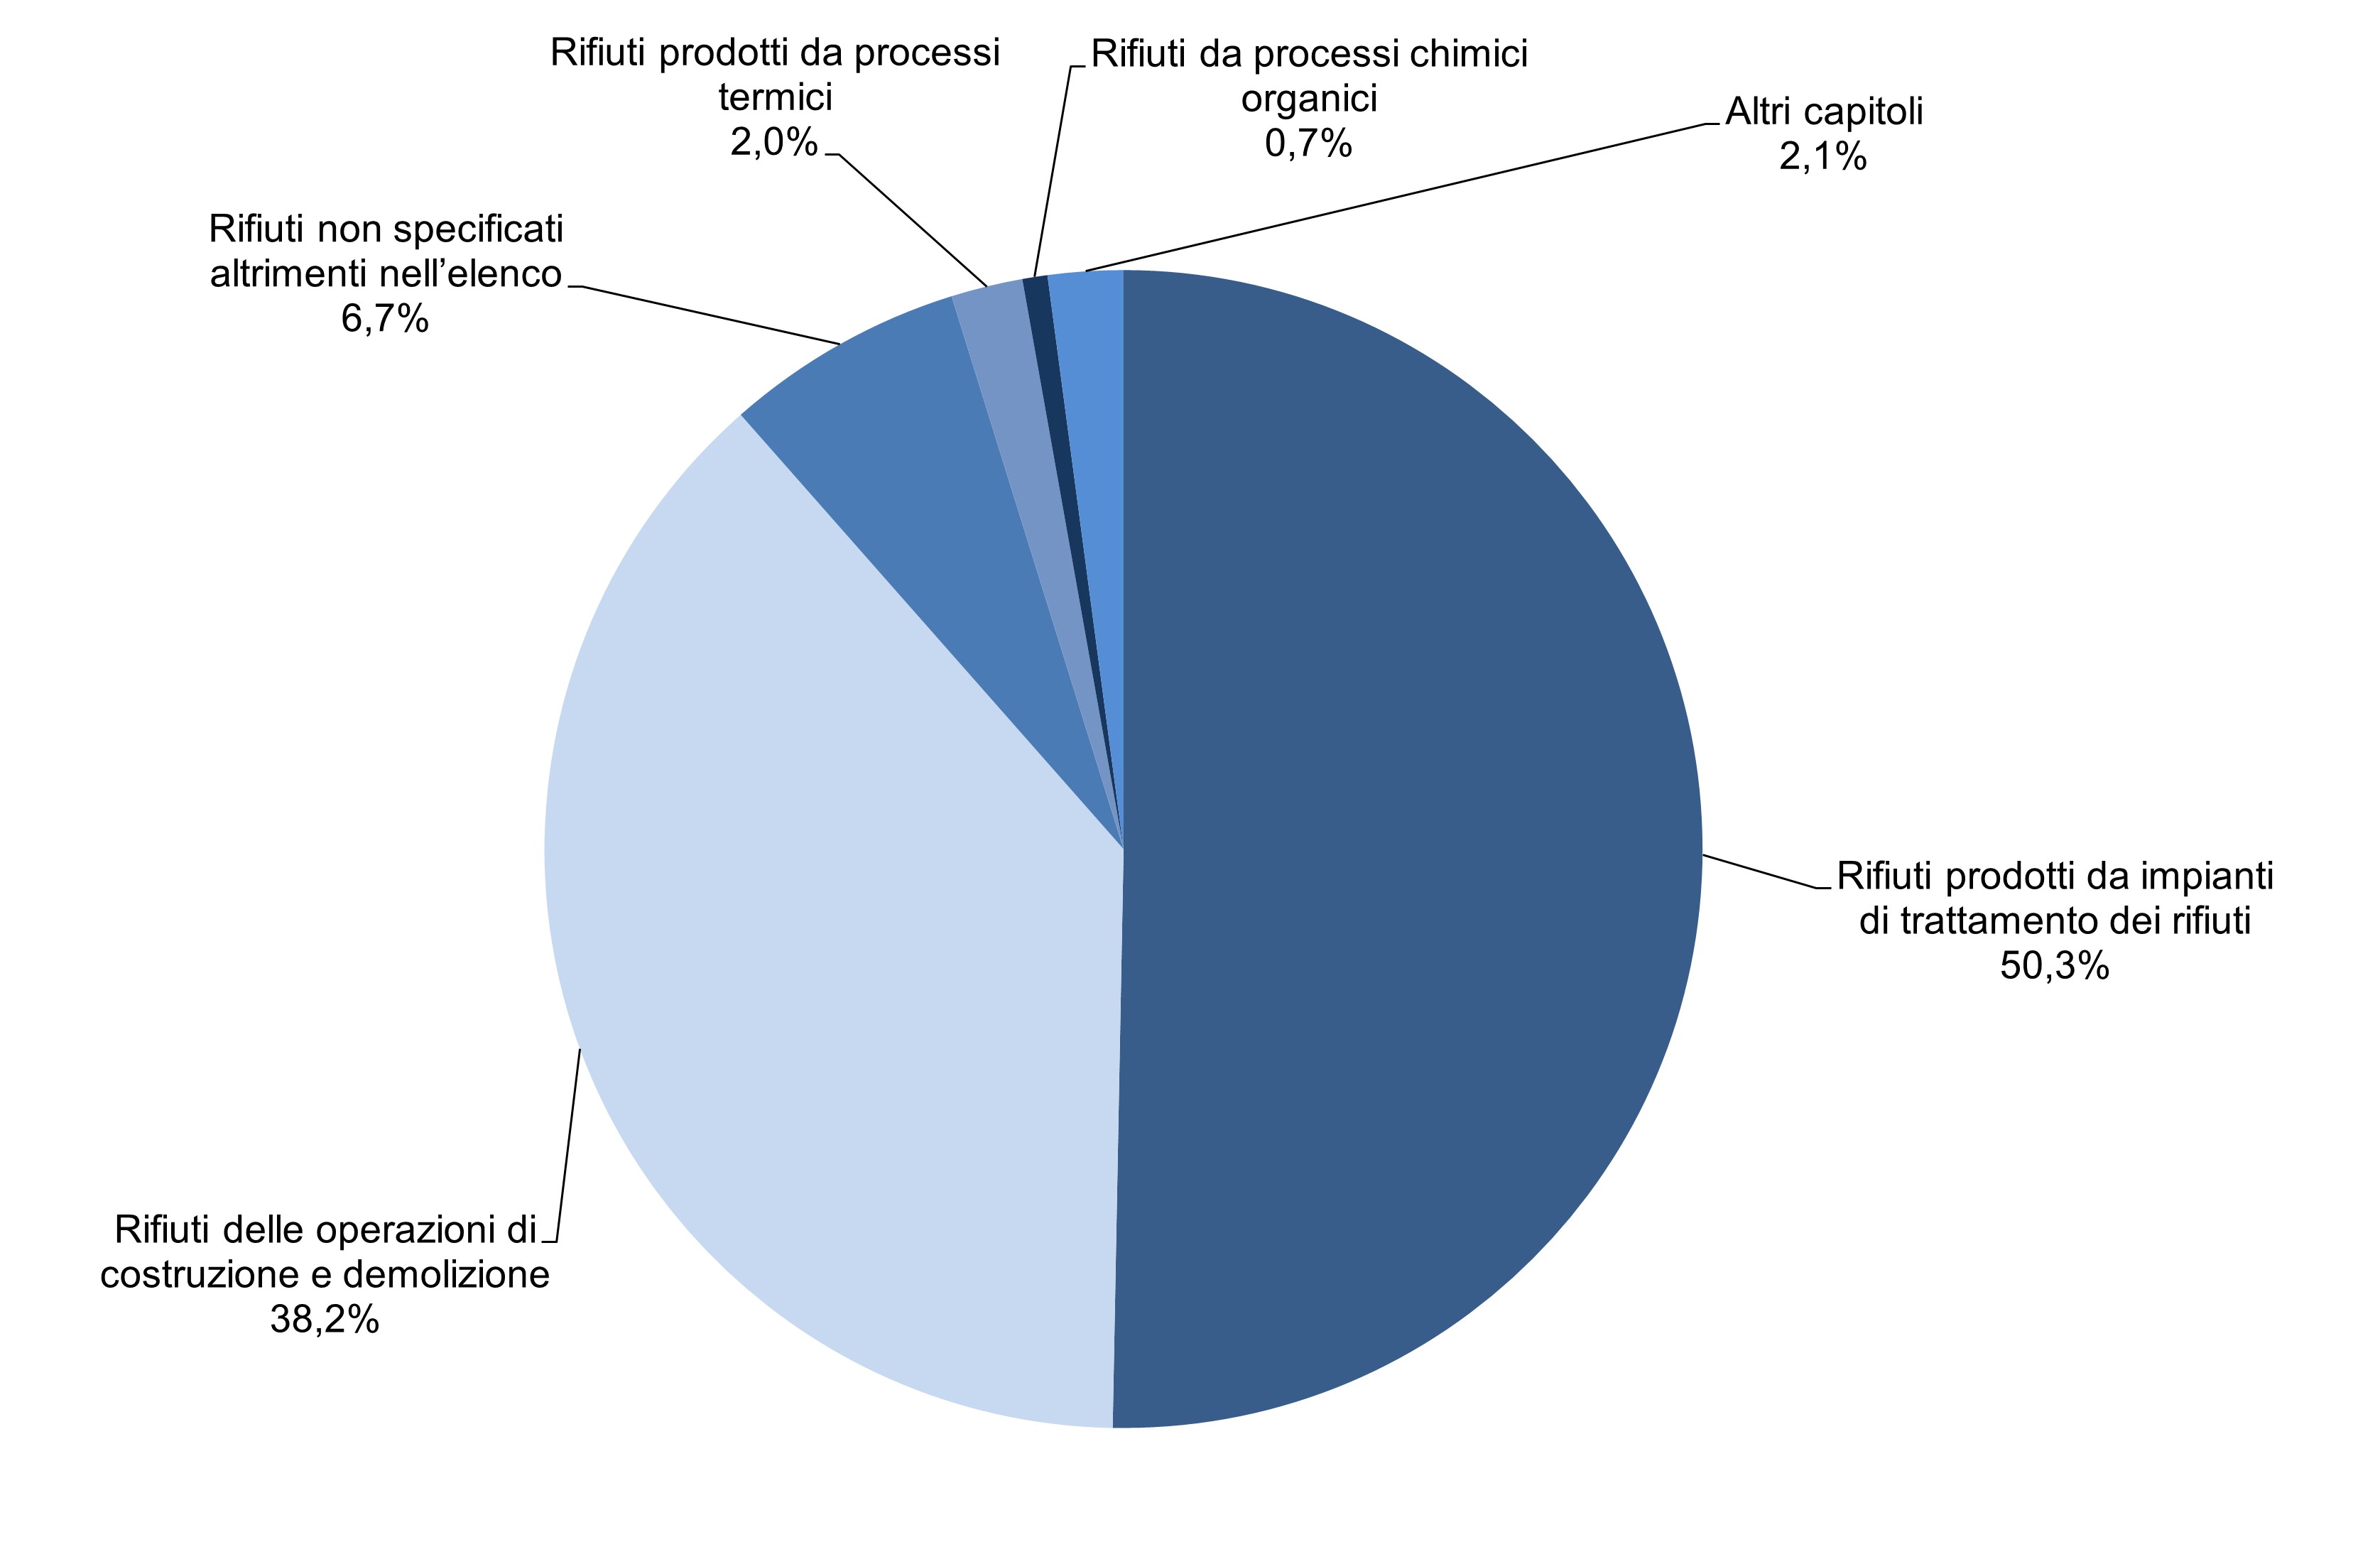
Figure 3: Hazardous Waste from Economic Activities exported by European Waste Catalogue chapter (2023) Data source
ISPRA |
The total amount of Waste from Economic Activities exported in 2023 was 5.5 million tonnes (Table 1). As shown in Table 2 and Figure 1, the largest quantities of waste were destined for Germany and Austria. Approximately 1.2 million tonnes of special waste (21.6% of total exports) were exported to Germany, consisting mainly of hazardous waste (762 thousand tonnes). More than 700 thousand tonnes of waste were exported to Austria, of which about 192 thousand tonnes were hazardous.
Lombardy exported the largest share of Waste from Economic Activities, about 1.8 million tonnes, 53.9% of which was hazardous; it was followed by Veneto, with 691 thousand tonnes, 78.2% of which was non-hazardous (Table 3).
As represented in Figure 2, the largest exported share, equal to 74.1% of total non-hazardous waste, consisted of “waste produced by waste treatment plants,” followed by “waste produced by thermal processes” (11.4%) and “waste not otherwise specified in the list” (5.3%). “Waste from construction and demolition activities” accounted for 3.7% of total exported non-hazardous waste and was almost entirely composed of metal waste. With regard to exported hazardous waste: 50.3% was “waste produced by waste treatment plants,” 38.2% was “waste from construction and demolition activities,” and 6.7% was “waste not otherwise specified in the list” (Figure 3).