Barbara Dessì, Francesco Menniti, Irene Rischia
Monitoring of landslide and flood-risk mitigation measures funded since 1999 by the various State Administrations across the national territory is carried out by ISPRA through the ReNDiS platform (National Registry of Interventions for Soil Protection). As of 31 December 2024, the platform records a total of 25,921 interventions, corresponding to a total allocation of €20.559 billion. Of these, the interventions under the remit of the Ministry of the Environment and Energy Security (MASE) account for 26.9% (6,983) of the total, with related funding amounting to about 43% (€8.850 billion) of all public resources allocated by other Administrations (extra-MASE). These include the Ministry of the Interior, the Civil Protection Department, the Casa Italia Department of the Presidency of the Council of Ministers, the Ministry of Agriculture, Food Sovereignty and Forests (MASAF), and the Regions of Calabria and Lombardy. Extra-MASE interventions represent roughly 73% (18,938) of the total number of projects, corresponding to nearly 57% (€11.708 billion) of total funding.
As regards implementation status, 9,350 interventions — around 36% — have been completed; 11% (2,937) are under construction; 19% (4,833) are in the design phase; and nearly 33% (8,509) have not yet started or lack reported data. The indicator also details how expenditure is distributed by type of hazard. Finally, the dataset includes information on funding requests submitted by Regions/Autonomous Provinces to MASE and the Casa Italia Department for new mitigation measures, consisting of 555 requests deemed eligible for funding under the DPCM of 27 September 2021, for a total project cost of approximately €1.678 billion
The indicator provides the total number, aggregated cost and implementation status of hydro-geological risk mitigation interventions funded from 1999 to 31 December 2024 by national and local Public Administrations and recorded in the ReNDiS platform (National Registry of Interventions for Soil Protection), developed and managed by ISPRA.
It also reports the number and financial amount of funding requests submitted by Regions/Autonomous Provinces through ReNDiS to the Ministry of the Environment and Energy Security (MASE) and to the Casa Italia Department of the Presidency of the Council of Ministers (PCM) for the implementation of new soil-protection projects.
Within ReNDiS’s Monitoring Area (http://www.rendis.isprambiente.it/rendisweb), data on interventions funded by MASE (“MASE interventions”) have been collected since 1999, and, from 2022 onwards, data on interventions funded by other State Administrations (“extra-MASE interventions”) have also been integrated. These include interventions under the responsibility of the Department for Internal and Territorial Affairs (DAIT) of the Ministry of the Interior, the Civil Protection Department, the Casa Italia Department, MASAF, and the Regions of Calabria and Lombardy, financed through resources allocated for new soil-protection measures (ex DPCM 27/09/2021 and Casa Italia funds).
The indicator therefore supports improved coordination among the various Administrations responsible, in different ways, for hydro-geological risk mitigation in Italy, enhancing the overall optimisation of national soil-protection expenditure.
The primary goal of the indicator is to create a unified overview of works and resources dedicated to hydrogeological risk mitigation measures, shared among all administrations involved in planning and implementing mitigation projects. The indicator enables an assessment of the distribution of allocated economic resources across the national territory, the types of projects completed, their timelines, and the financial needs for new measures based on the type of hydrogeological instability.
Thus, the indicator contributes to improving coordination among the various administrations involved in hydrogeological risk mitigation in Italy, leading to better optimization of national spending on hydrogeological risk mitigation works.
DL 180/98 and subsequent amendments,
Program Agreements 2010-2011 and subsequent supplementary programs,
PN 2015-2020,
Prime Ministerial Decree of 09/15/2015,
DL 30/2013, DD of 11/27/2017 relating to planning funds,
Prime Ministerial Decree of 02/20/2019,
Prime Ministerial Decree of 02/12/2019,
Prime Ministerial Decree of 09/27/2021,
DPCM Casa Italia 2023,
Decrees and financing programs approved until 31 October 2024 (MASE and extra-MASE)
DAIT Interministerial Decrees,
D. L. 153/24, converted into Law 191 of 12/13/2024
ISPRA, Ambiente in Italia: uno sguardo di insieme, Annuario dei dati ambientali 2022.
ISPRA, “Annuario in cifre” 2020 ed. Edizione 2019: Interventi urgenti per la riduzione del rischio idrogeologico”.
ISPRA (2020), Rapporto ReNDiS 2020: la difesa del suolo in vent'anni di monitoraggio ISPRA sugli interventi per la mitigazione del rischio idrogeologico. Rapporti Tecnici 328/2020.
ISPRA (2025), Dissesto idrogeologico in Italia: pericolosità e indicatori di rischio. Edizione 2024. Rapporti 415/2025
The indicator takes into consideration, in addition to the interventions under the responsibility of the MASE from 1999 to 31 December 2024, also the interventions financed by other public administrations (extra-MASE interventions), whose monitoring is relative to those financed starting from 2017. For the extra-MASE interventions acquired in ReNDiS there is an almost total lack of technical data relating to the projects (type of works and disruptions, geographical location), unlike what happens for those of MASE competence, since the data in this case are derived exclusively from the Public Administration Database (BDAP) which contains exclusively administrative and economic-financial data.
The recently enacted Decree-Law 153/2024, Article 8, designates ReNDiS as the national platform for the census and monitoring of technical aspects of all interventions financed for hydro-geological risk mitigation, regardless of funding source. The decree also requires project owners to provide technical information for all interventions already recorded in the system, including geographical coordinates, hazard and intervention typology, and project documentation.
ISPRA
www. rendis. isprambiente. it
National, Regional
1999-2024
ReNDiS is an integrated platform whose services and tools cover all phases of planning, programming and implementing interventions — from project review to monitoring their execution. Through its web interface, it also provides the main public access point to data and information on actions undertaken by Public Administrations to mitigate hydro-geological risk, promoting better coordination in planning and greater transparency, participation and oversight during implementation, including by citizens.
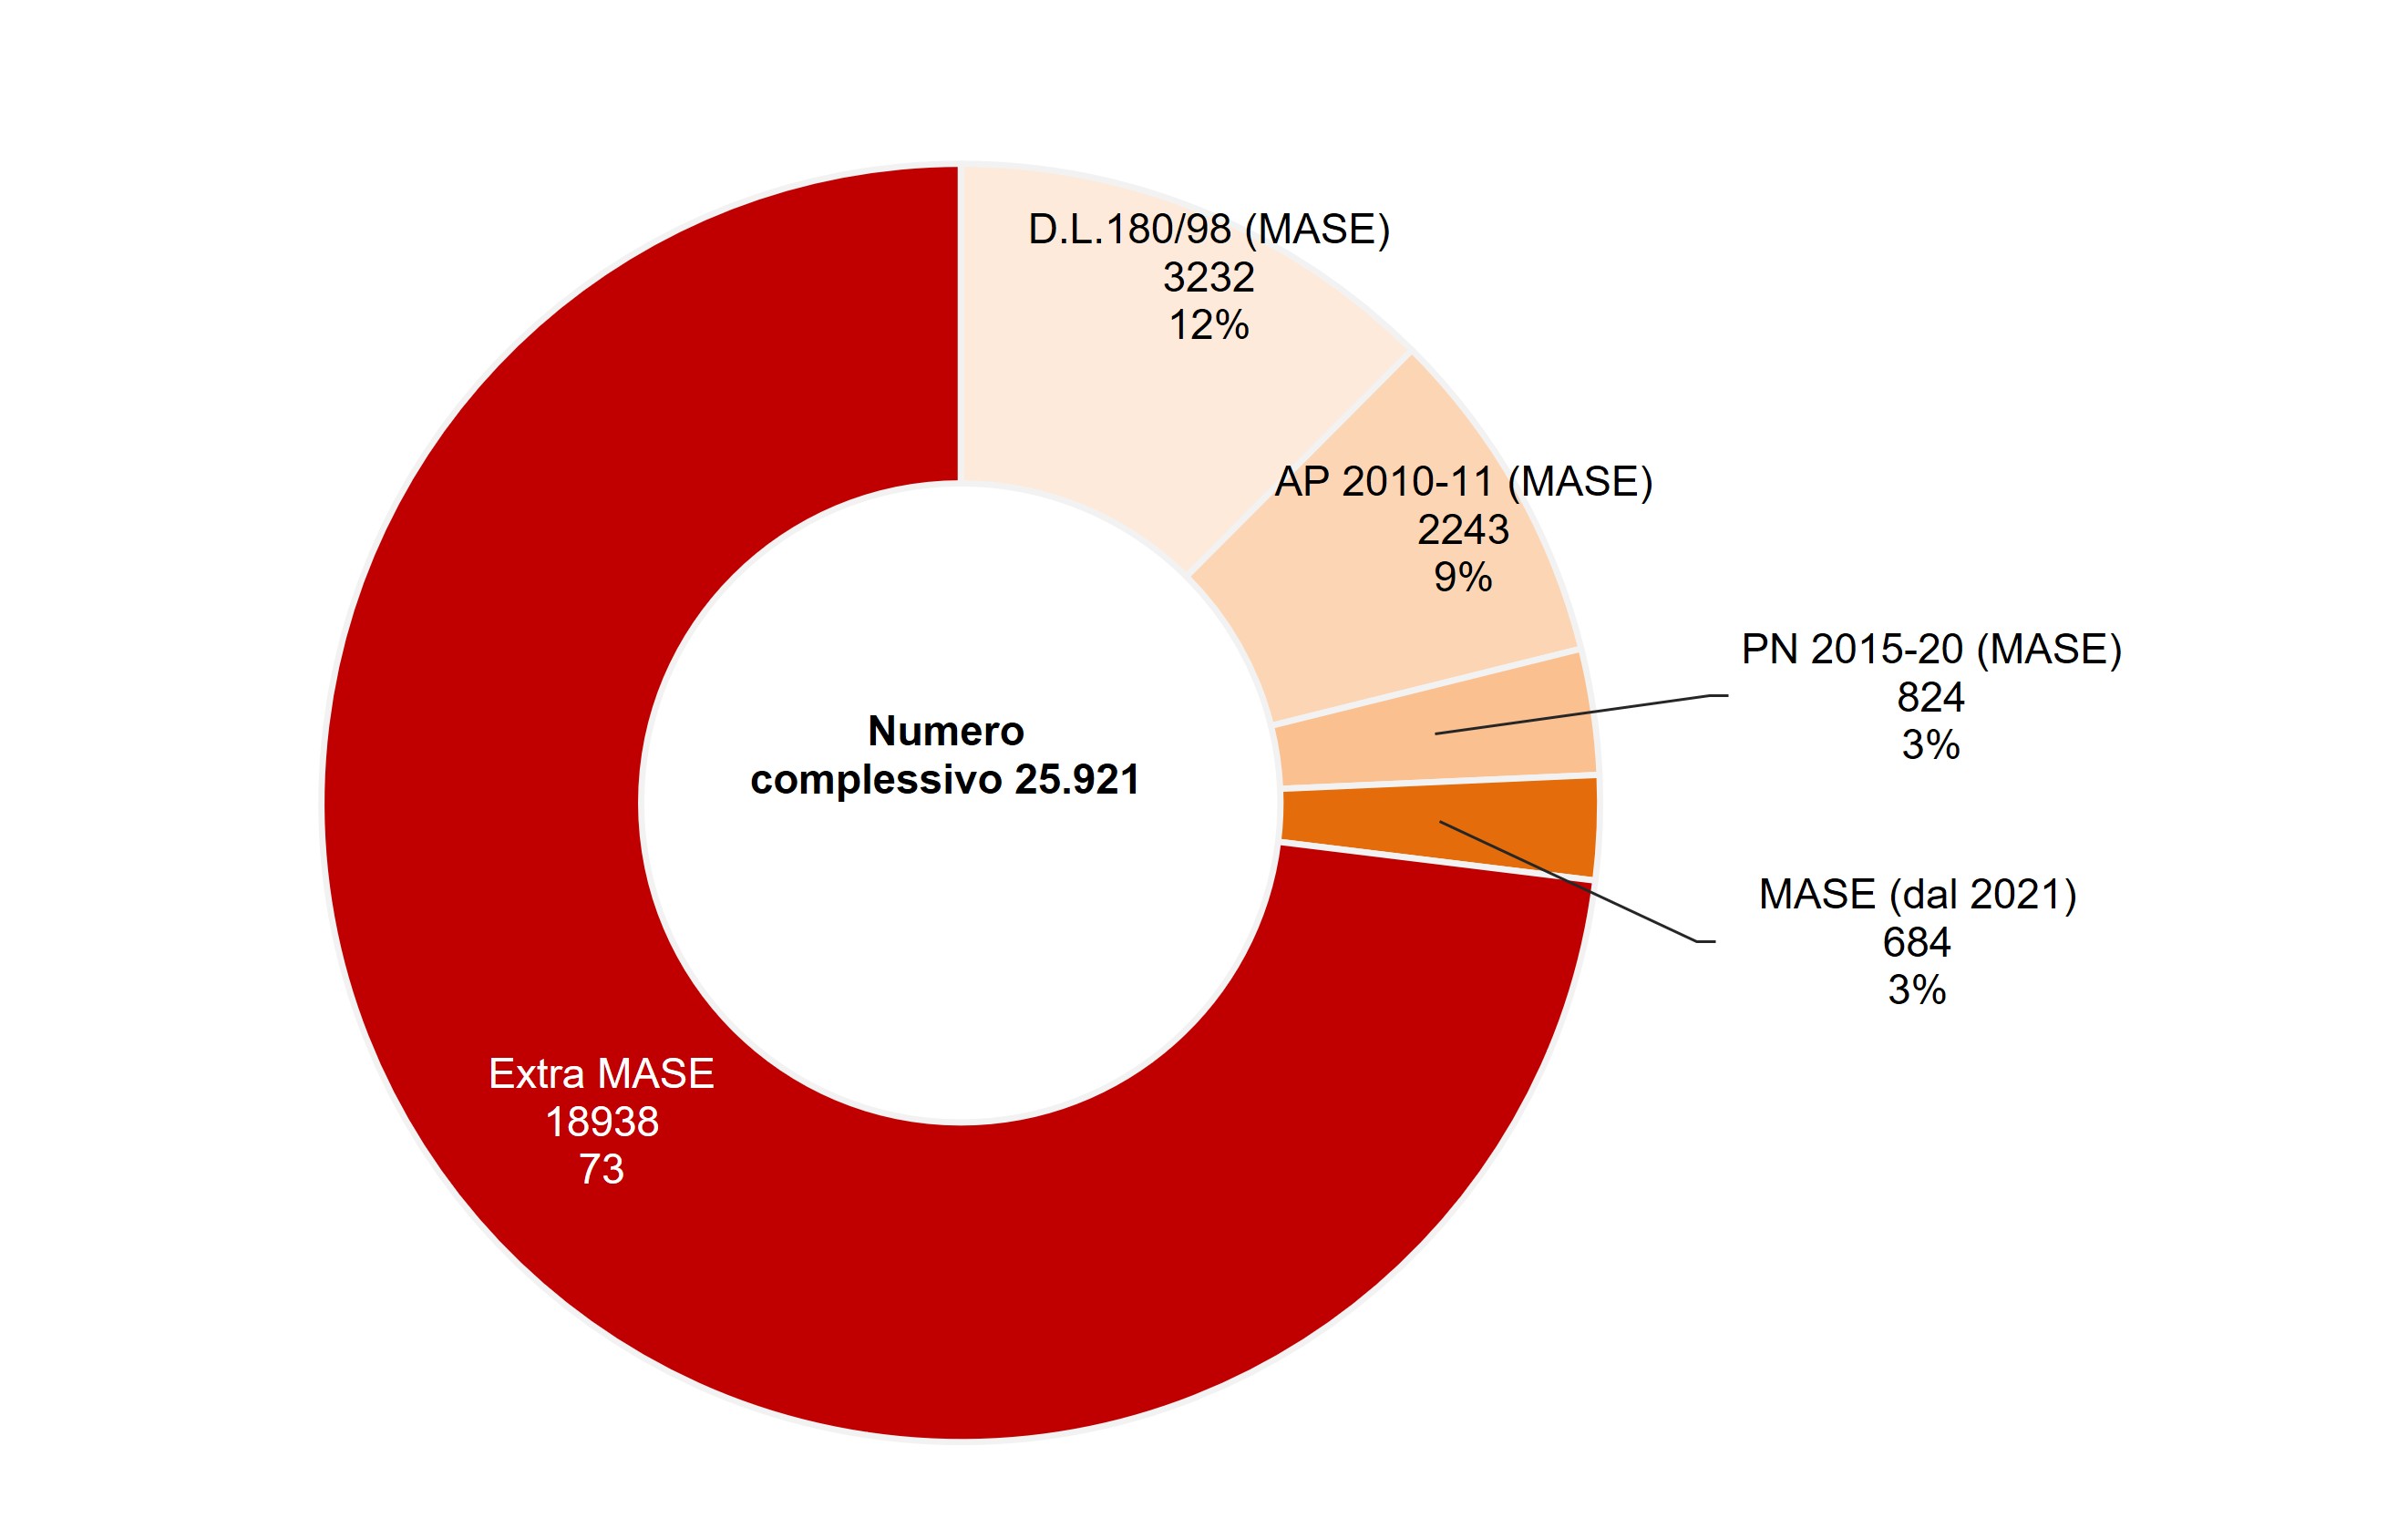
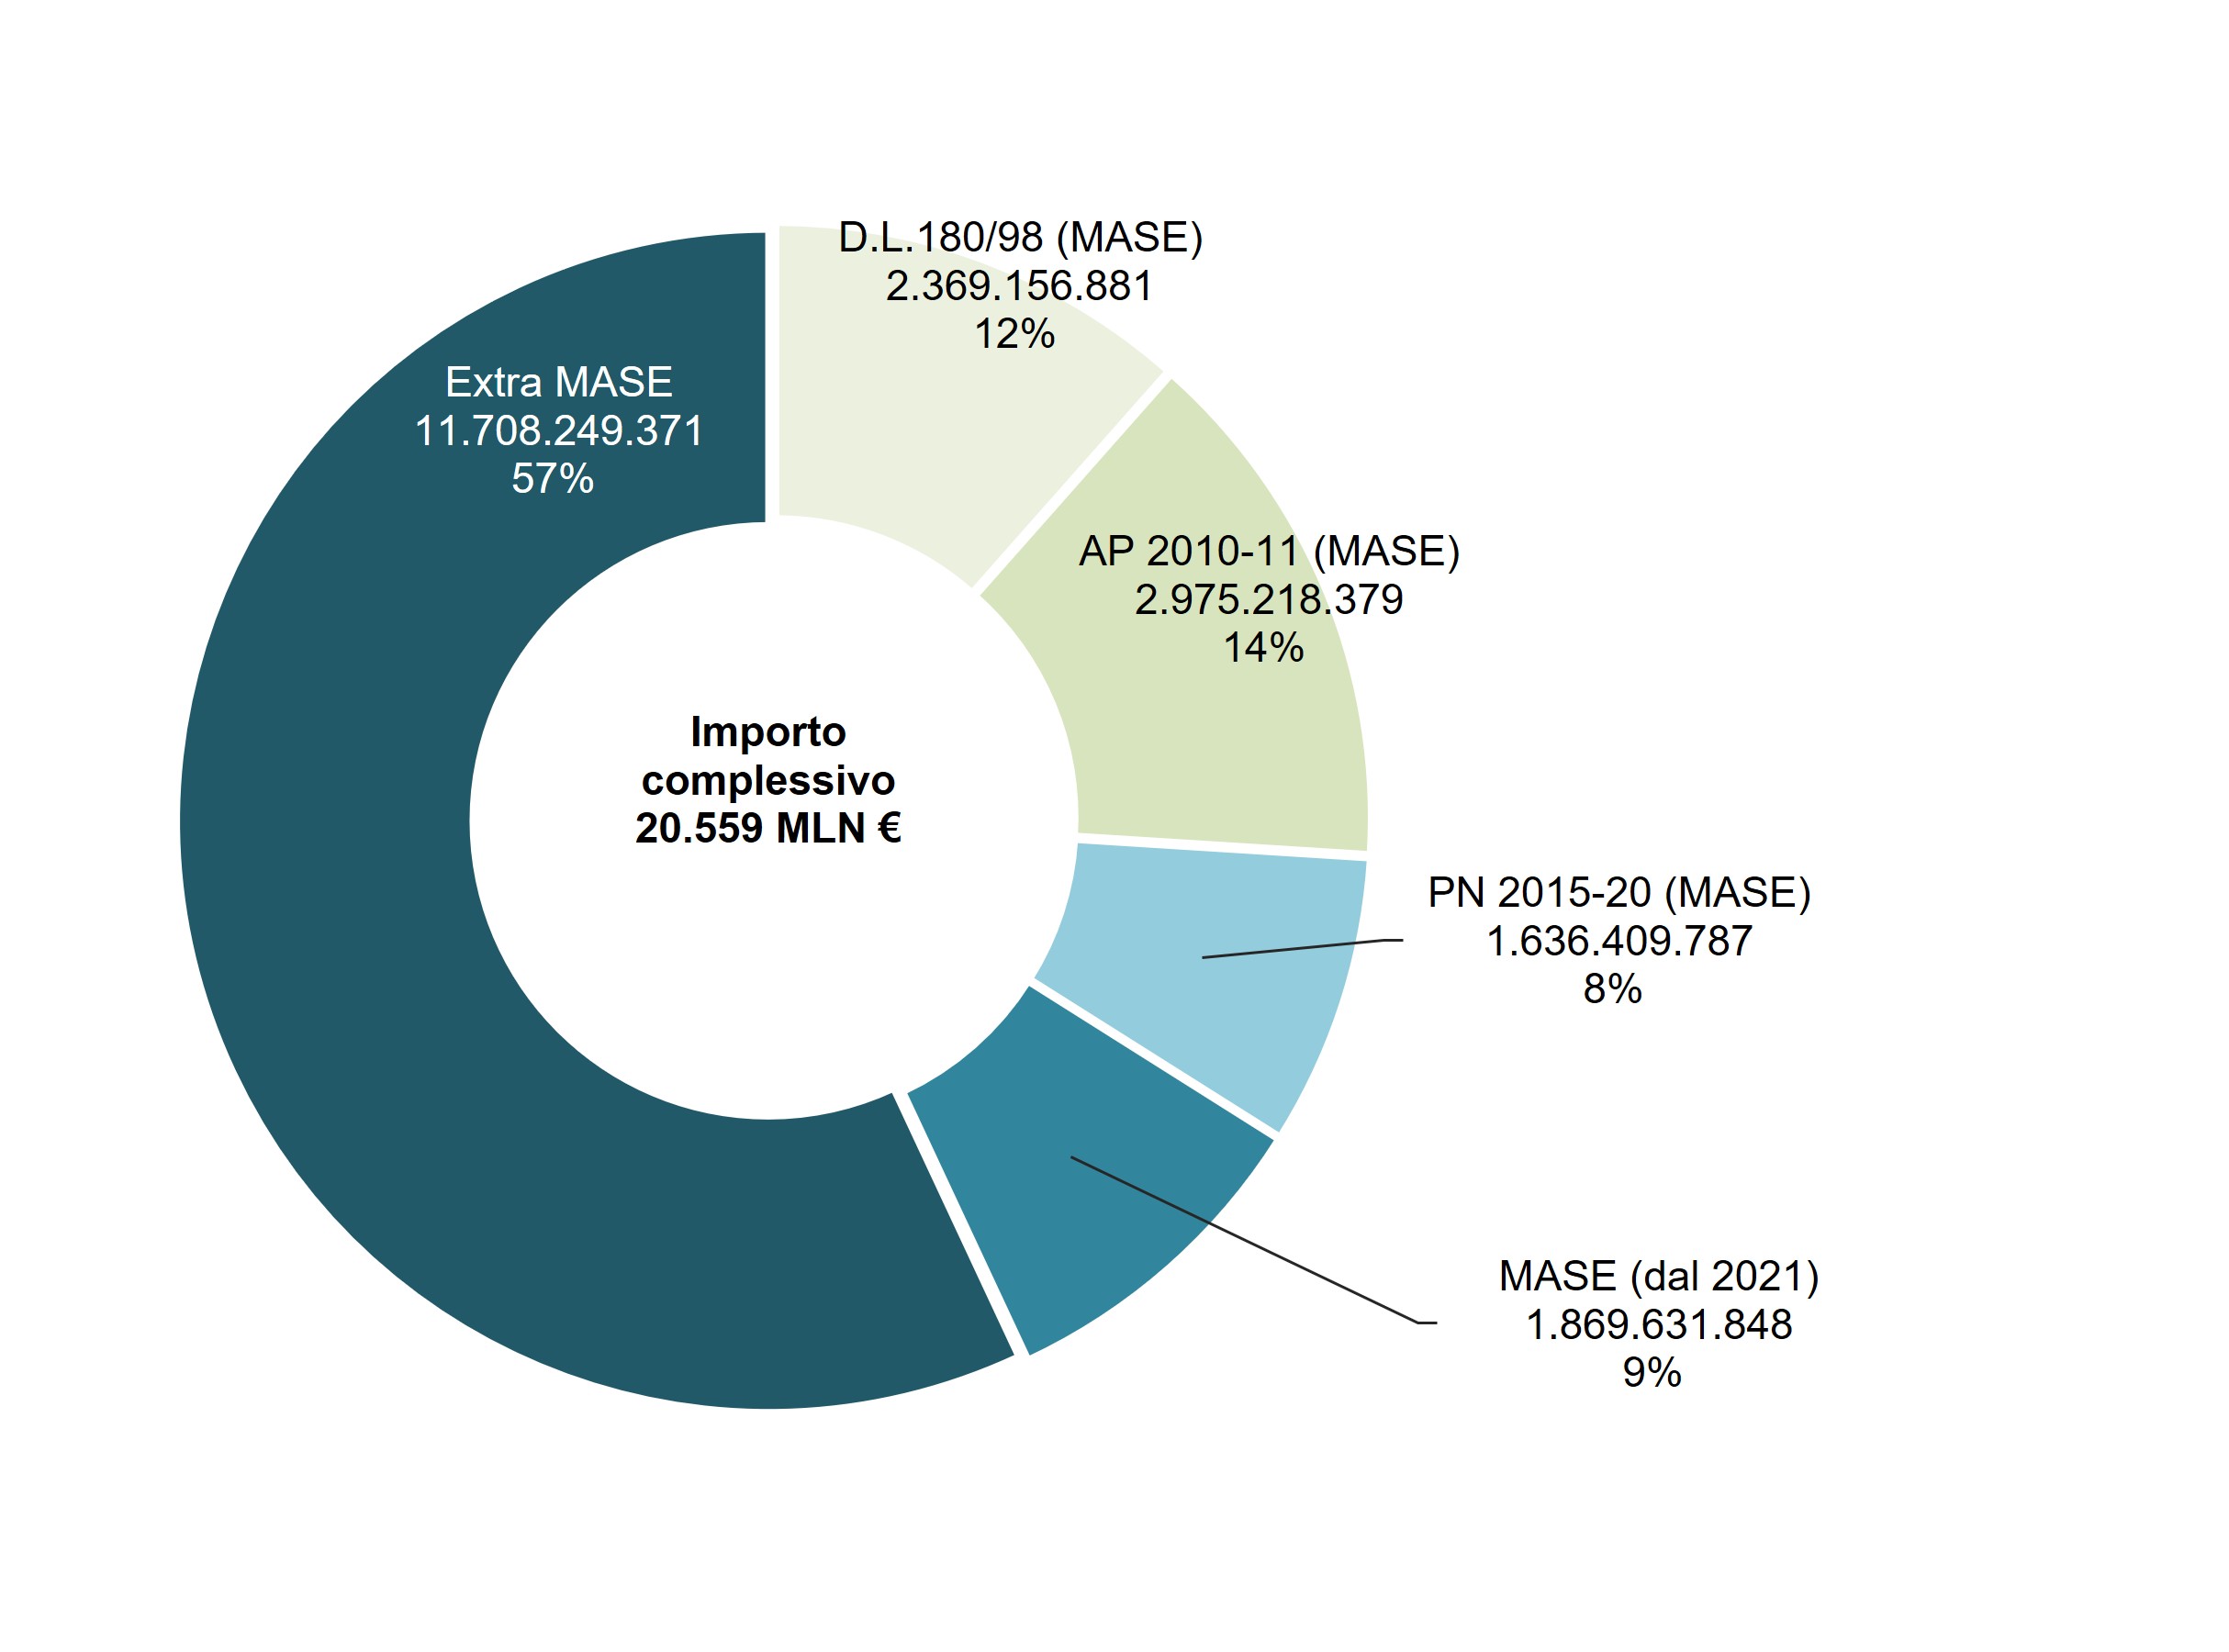
The data on hydro-geological mitigation measures recorded in ReNDiS show that, as of 31 December 2024, a total of 25,921 interventions had been funded (Figure 1a), for a cumulative budget of €20.559 billion (Figure 1b).
MASE interventions account for almost 30% (6,983) of the total, corresponding to about 43% (€8.850 billion) of all resources allocated by the various funding Administrations.
Considering only MASE interventions, the comparison between the number of interventions and their allocated budgets across funding groups shows that projects implemented under post-2010 programming cycles (Figures 1a and 1b) have noticeably higher average unit costs than those from earlier cycles. This reflects a shift towards more strategic projects planned at a broader territorial scale.
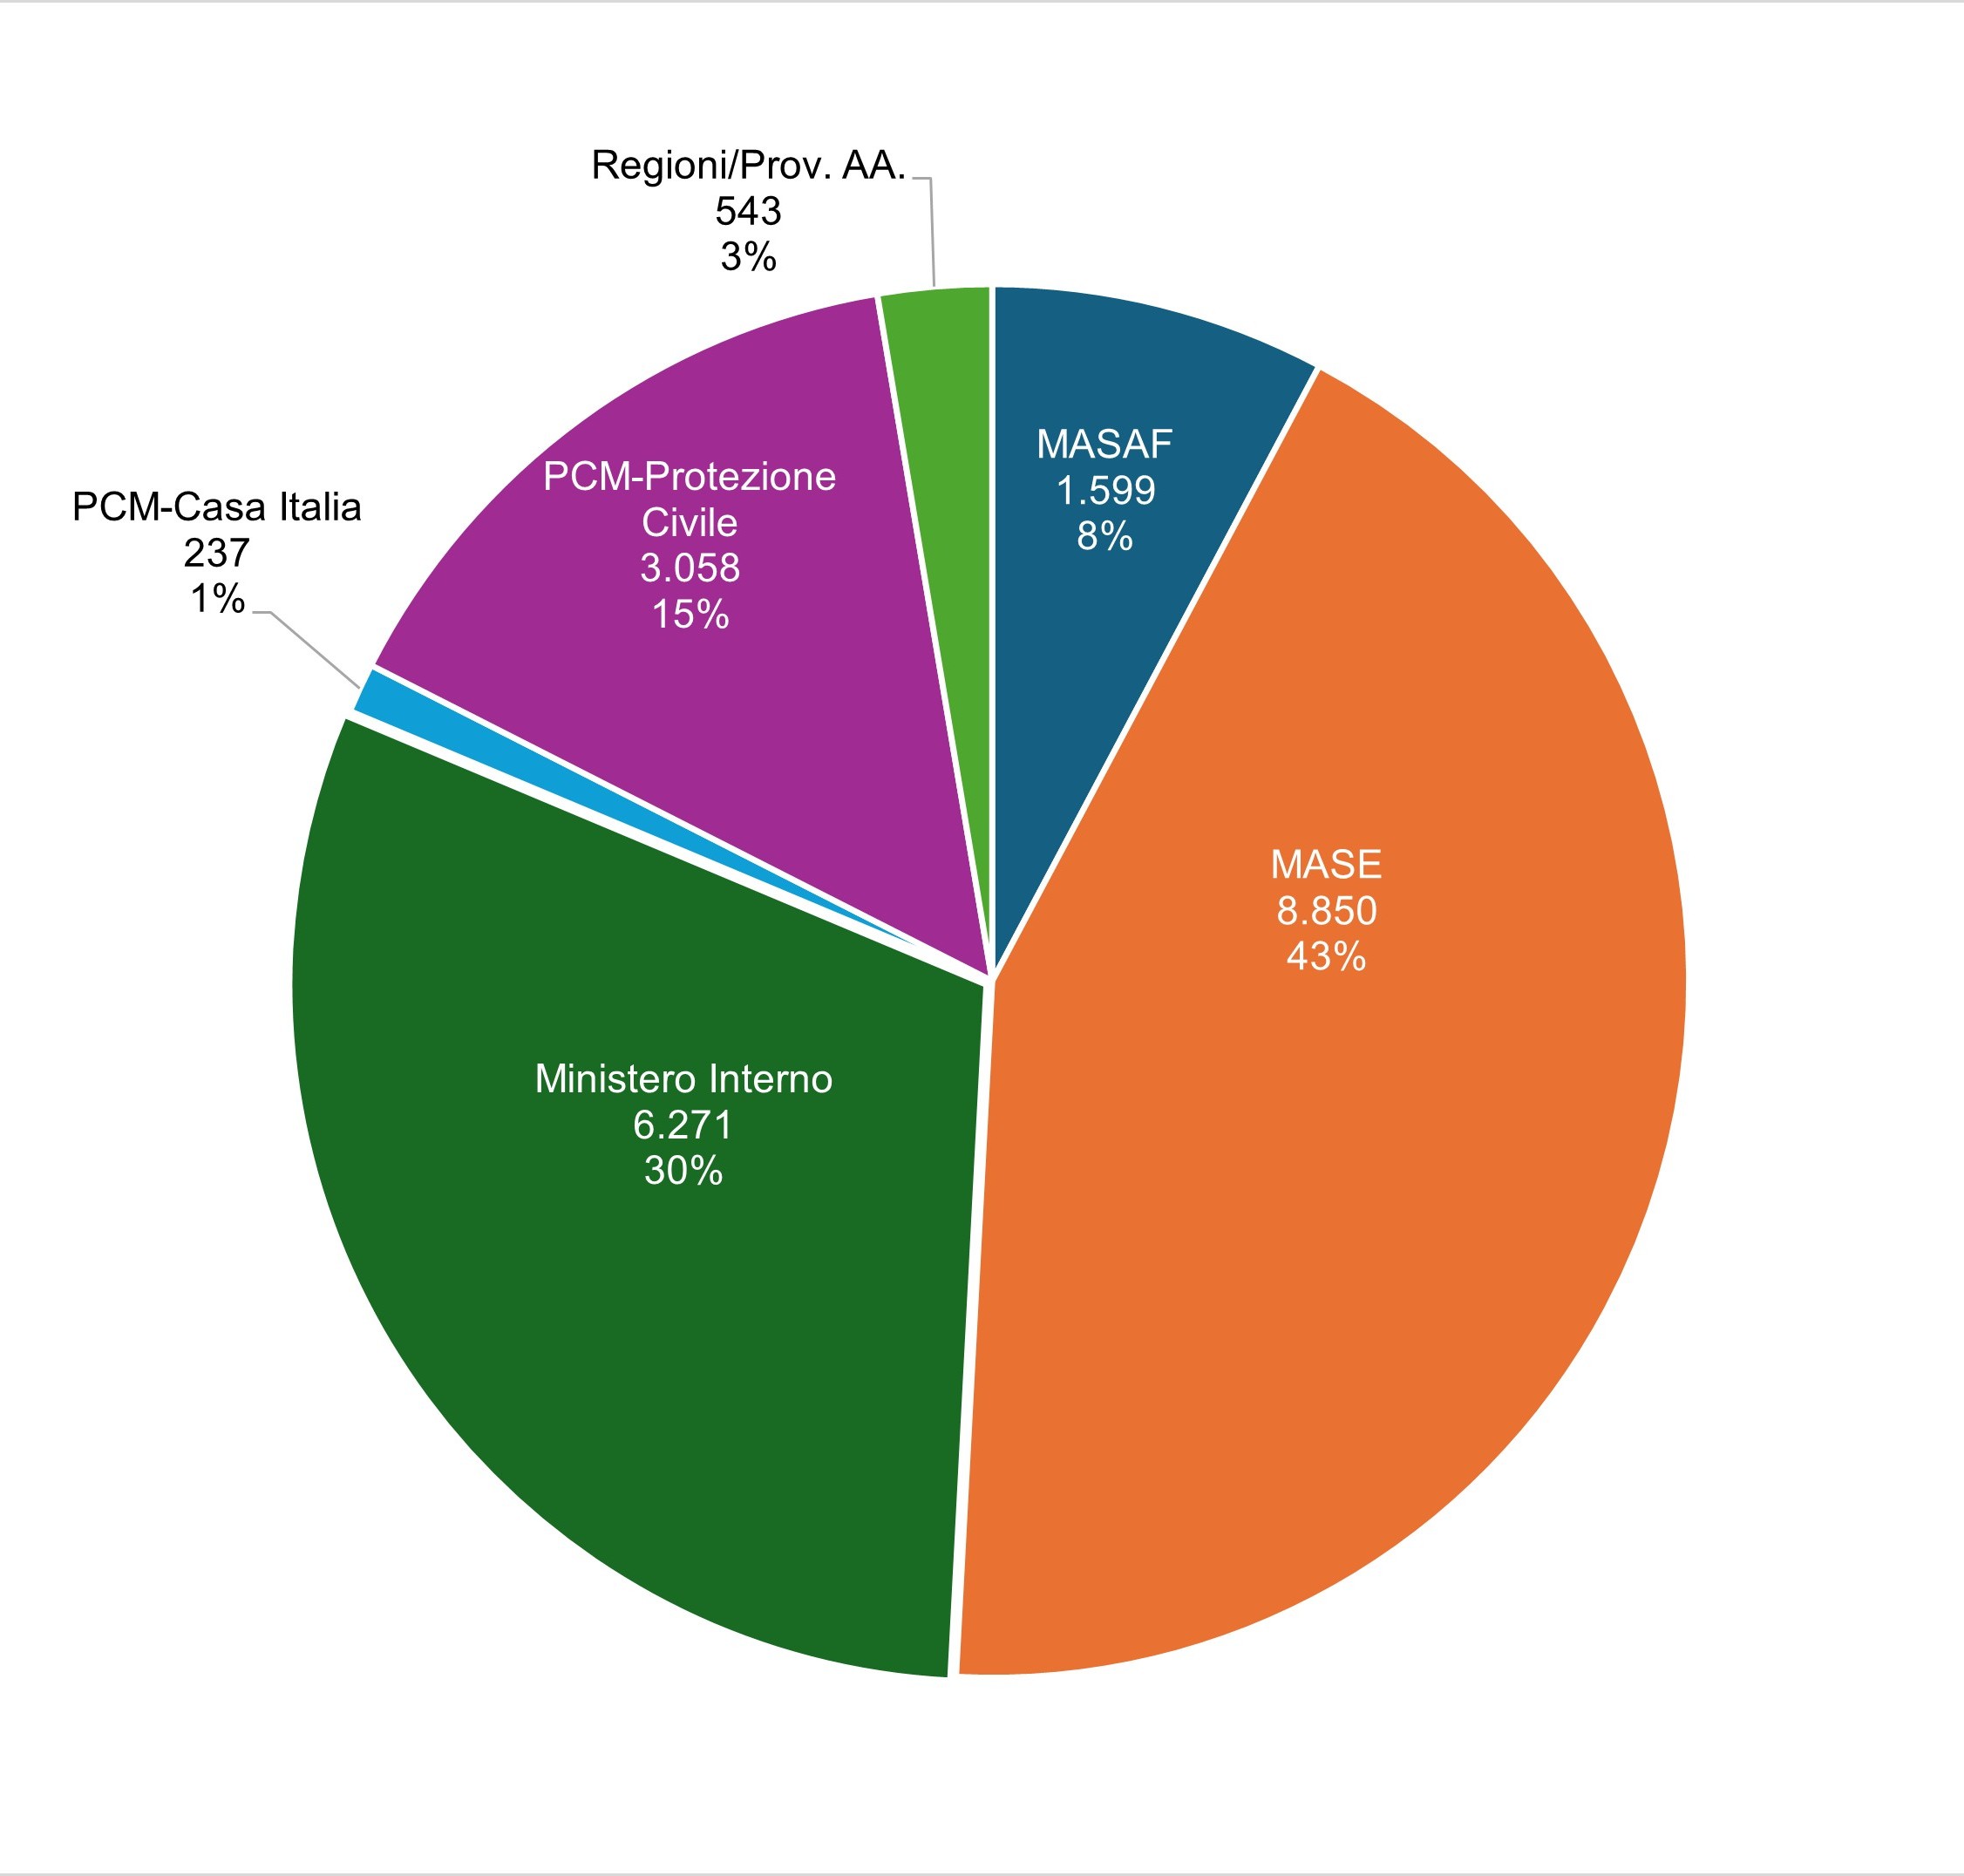
Extra-MASE interventions funded by the Ministry of the Interior, Civil Protection Department, Casa Italia, MASAF, and the Regions of Calabria and Lombardy represent more than 73% (18,938) of the total number of interventions, corresponding to nearly 57% (€11.708 billion) of total funding.
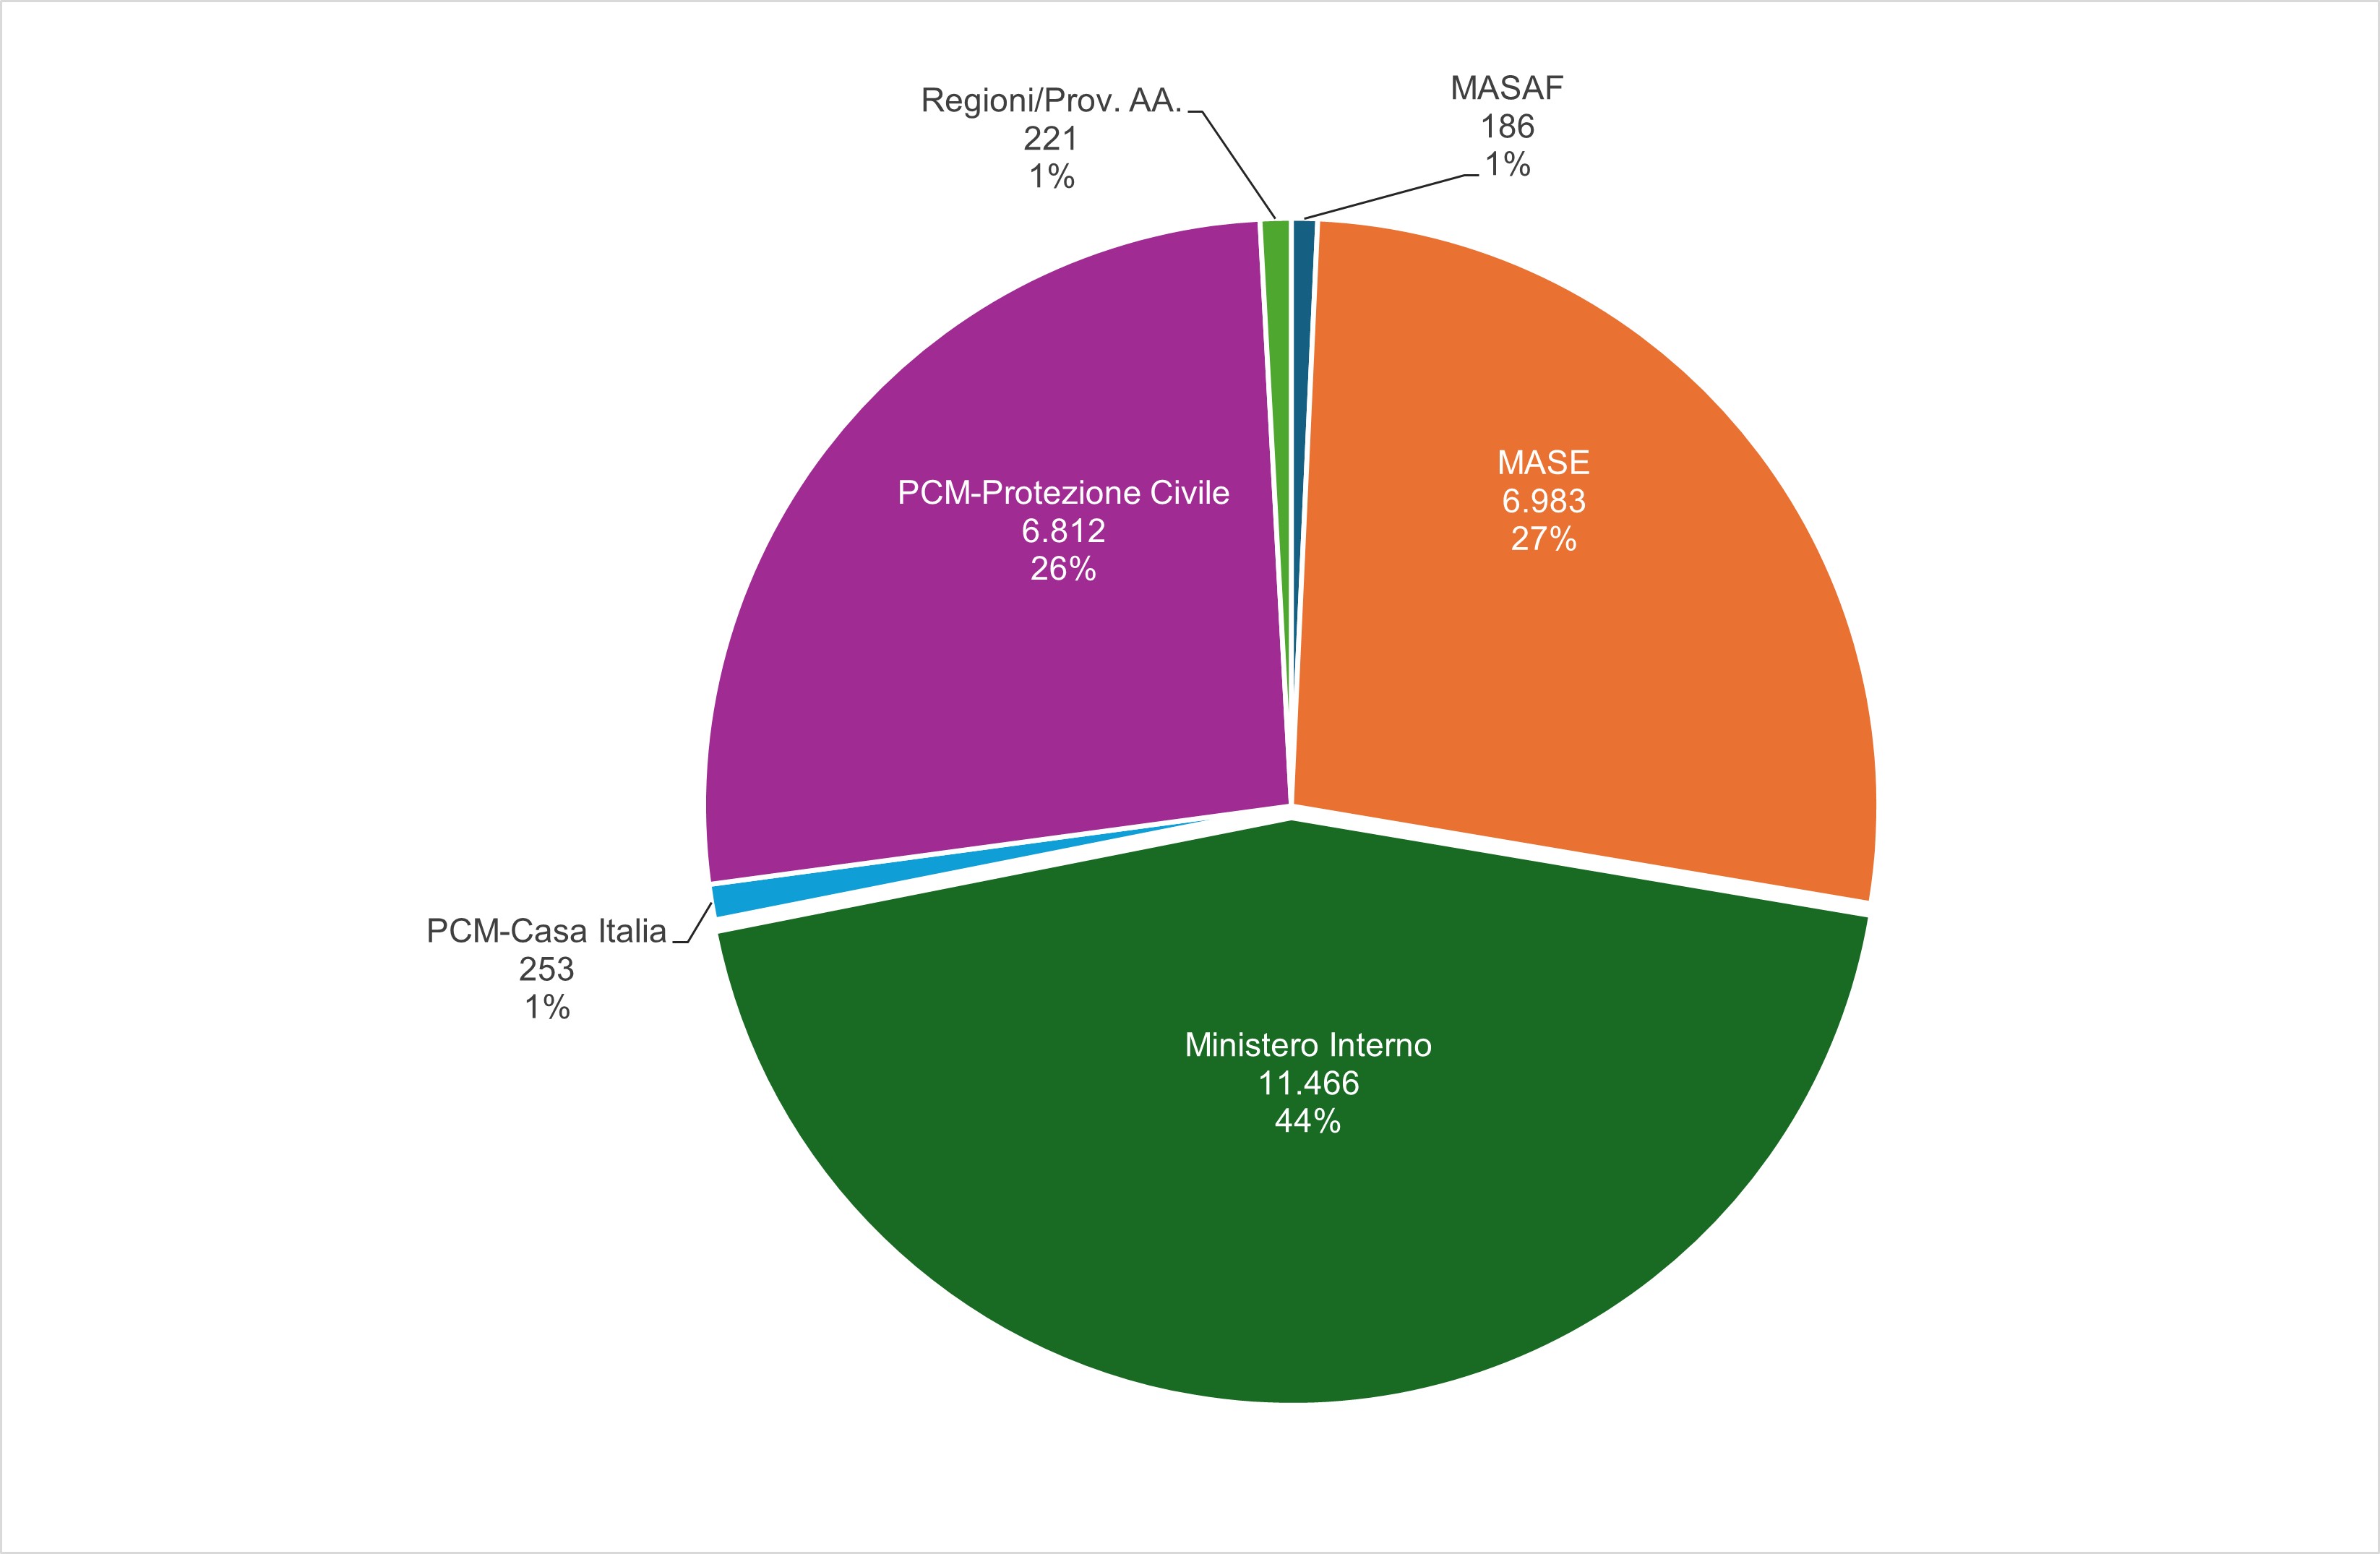
Analysis of the distribution of interventions by funding Administration (Figures 2a and 2b) shows that although DAIT interventions (11,466) are by far the most numerous, their total funding is significantly lower than that of MASE interventions (€6.3 billion for DAIT versus €8.9 billion for MASE). Similarly, the relative weight of Civil Protection interventions drops sharply when shifting from number of projects to financial allocations.
These differences in average project cost largely reflect broader distinctions in mandates and programming objectives. Civil Protection and DAIT interventions tend to follow localised criteria and selection logics, whereas MASE and Casa Italia programs align with district-basin planning and therefore include more strategic, larger-scale or more complex interventions, with higher typical unit costs.
Between 1999 and 2019, the indicator shows a steady increase in the number of funded mitigation interventions, paralleled by a similar rise in available resources. Significant surges in project numbers and funding coincide with major funding decrees issued after severe natural disasters (e.g., the 2000 Soverato flood, the 2001 Liguria flood, the Genoa and Sicily floods of 2011, the 2018 Sicily flood).
From 2022 onwards, with the inclusion in ReNDiS of extra-MASE interventions funded since 2017, there is a sharp increase in both the number of recorded interventions and the associated funding, as these projects represent roughly 73% of the total. A substantial increase in allocated resources is also observed, though with a lower growth rate, since extra-MASE interventions — while numerous — have significantly lower average unit costs. MASE projects, by contrast, are often more complex and cover larger areas, as they are developed under district-basin planning, resulting in higher average costs.
| Data |
|---|
Thumbnail
Headline
Figure 1a: Overall distribution of the number of interventions broken down by funding group in ReNDiS (see Table 1) funded by MASE and other sources of public funding (non-MASE) (from 1999 to December 31, 2024) Data source
ISPRA analysis of monitoring data on interventions for hydrogeological risk reduction reported in ReNDiS. |
Thumbnail
Headline
Figure 1b. Overall distribution of amounts broken down by funding group in ReNDiS (see Table 1) funded by MASE and other public funding sources (non-MASE) (from 1999 to December 31, 2024). Data source
ISPRA analysis of monitoring data on interventions for hydrogeological risk reduction reported in ReNDiS. |
Thumbnail
Headline
Figure 2a: Overall distribution of the number of funded interventions, broken down by Competence (see Table 1) of the various Administrations that provide the resources for the implementation of the interventions recorded in ReNDiS (from 1999 to December 31, 2024) Data source
ISPRA analysis of monitoring data on interventions for hydrogeological risk reduction reported in ReNDiS |
Thumbnail
Headline
Figure 2b: Distribution of the total amounts of funded interventions, broken down by jurisdiction (see Table 1) of the various administrations that provide resources for the implementation of the interventions recorded in ReNDiS (from 1999 to December 31, 2024) Data source
ISPRA analysis of monitoring data on interventions for hydrogeological risk reduction reported in ReNDiS |
Thumbnail
Headline
Figure 3a: Distribution of the number of interventions financed according to the type of instability classified in ReNDiS Data source
ISPRA analysis of monitoring data on interventions for hydrogeological risk reduction reported in ReNDiS |
Thumbnail
Headline
Figure 3b: Distribution of total amounts of funded interventions according to the type of instability classified in ReNDiS Data source
ISPRA analysis of monitoring data on interventions for hydrogeological risk reduction reported in ReNDiS |
Thumbnail
Headline
Figure 4a: Distribution of the number of interventions according to the implementation phase Data source
ISPRA analysis based on data monitoring interventions for hydrogeological risk reduction reported in ReNDiS |
Thumbnail
Headline
Figure 4b: Distribution of funded amounts according to implementation phase Data source
ISPRA analysis based on monitoring data for hydrogeological risk reduction measures reported in ReNDiS |
Thumbnail
Headline
Figura 5a. Distribuzione del numero di Schede istruttorie inserite nell’Area Istruttorie dalle Regioni e non ancora finanziate in funzione della categoria di dissesto classificato in ReNDiS. Data source
Elaborazione ISPRA su dati di monitoraggio interventi per la riduzione del rischio idrogeologico riportati in ReNDiS. |
Thumbnail
Headline
Figura 5b. Distribuzione degli importi inseriti nell’Area Istruttorie dalle Regioni e non ancora finanziate in funzione della categoria di dissesto classificato in ReNDiS. Data source
Elaborazione ISPRA su dati di monitoraggio interventi per la riduzione del rischio idrogeologico riportati in ReNDiS. |
Thumbnail
Headline
Abstract |
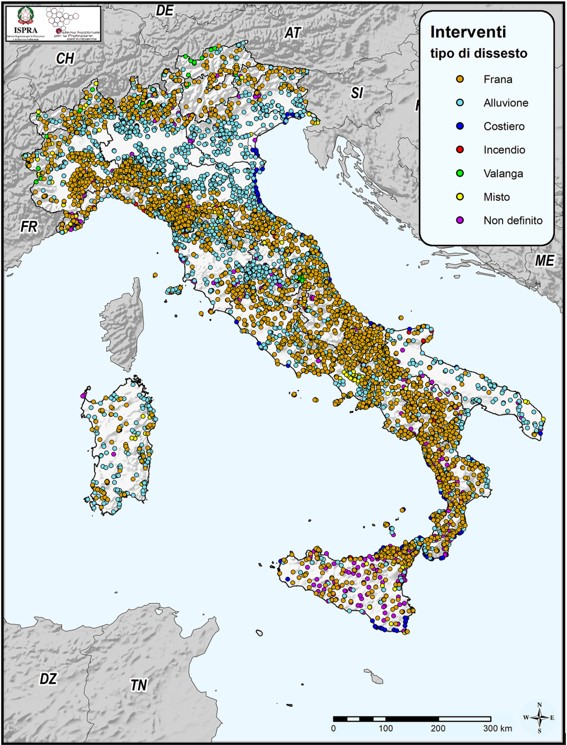
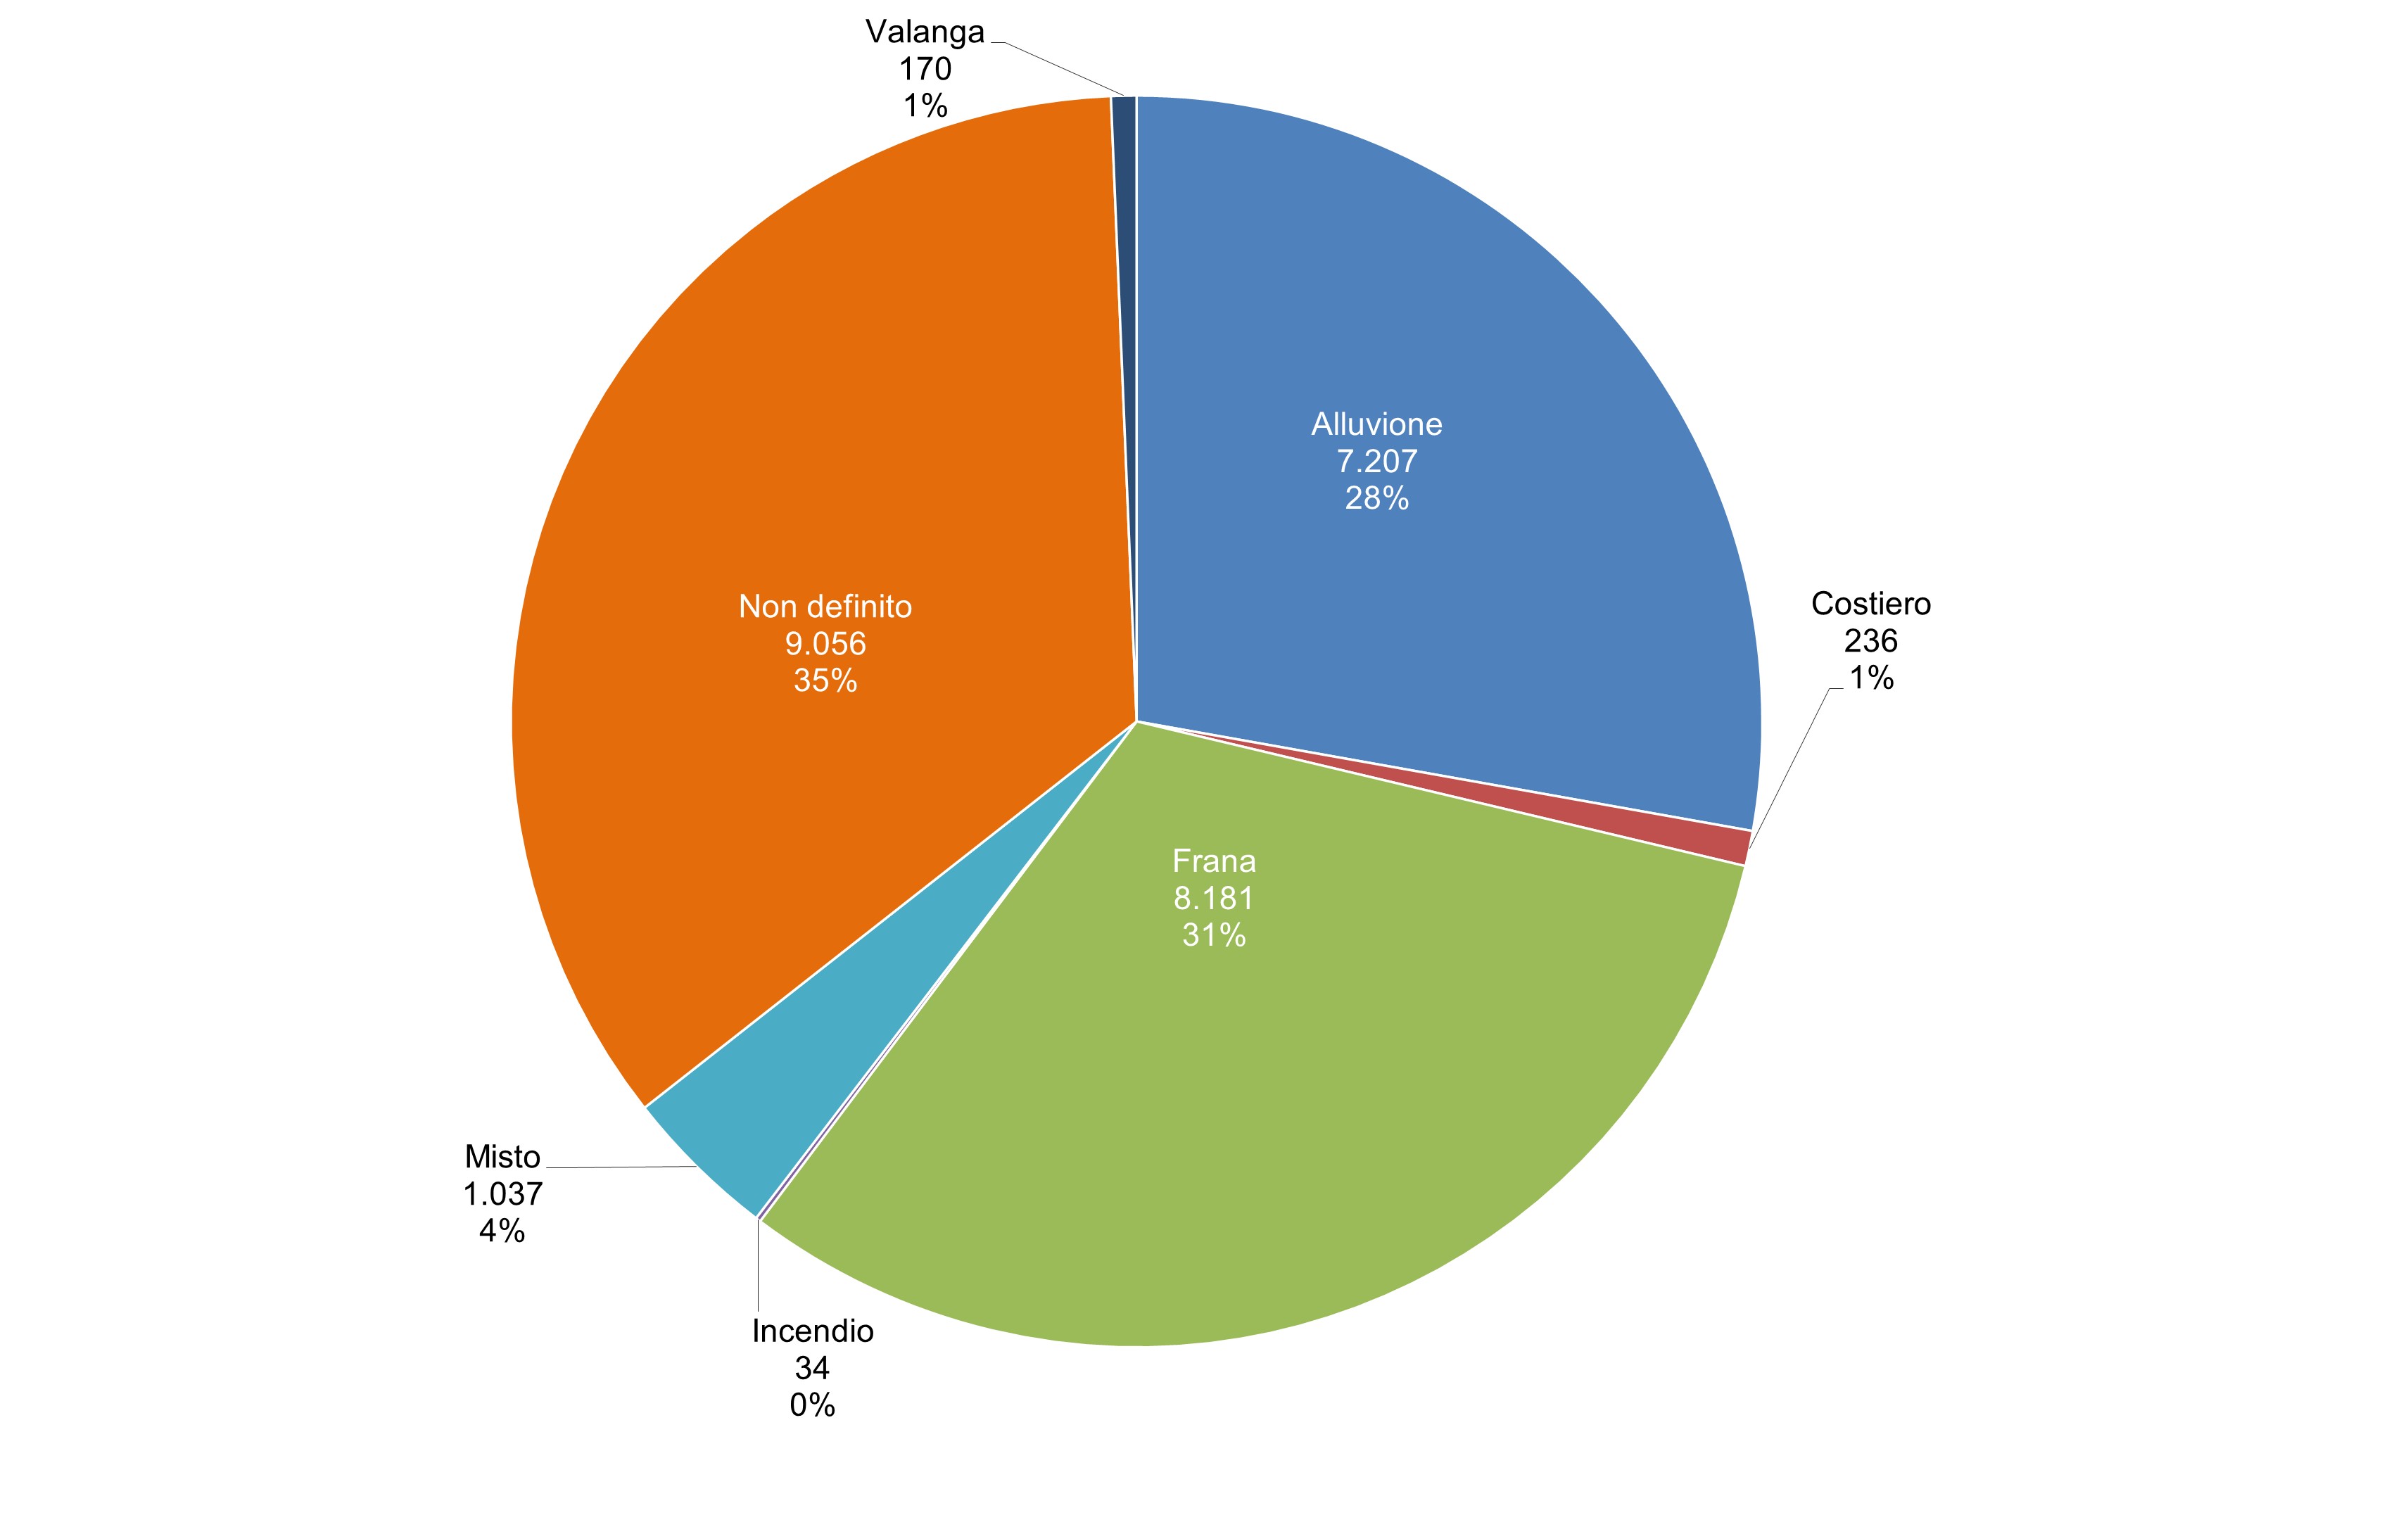
Analysis of intervention types by hazard category — considering all resources allocated by MASE and extra-MASE Administrations (Figures 3a and 3b) — provides insight into how geological, hydro-geological and environmental issues are addressed nationwide. Their distribution is a useful indicator of which hazard types attract the most investment for risk reduction.
Figure 3a shows that interventions addressing landslides (8,181; 32%) and hydraulic instability (7,207; 28%) are the most common, together representing 60% of all funded projects. Interventions for mixed instability (1,037), coastal erosion (236) and avalanches (170) account collectively for only 6%.
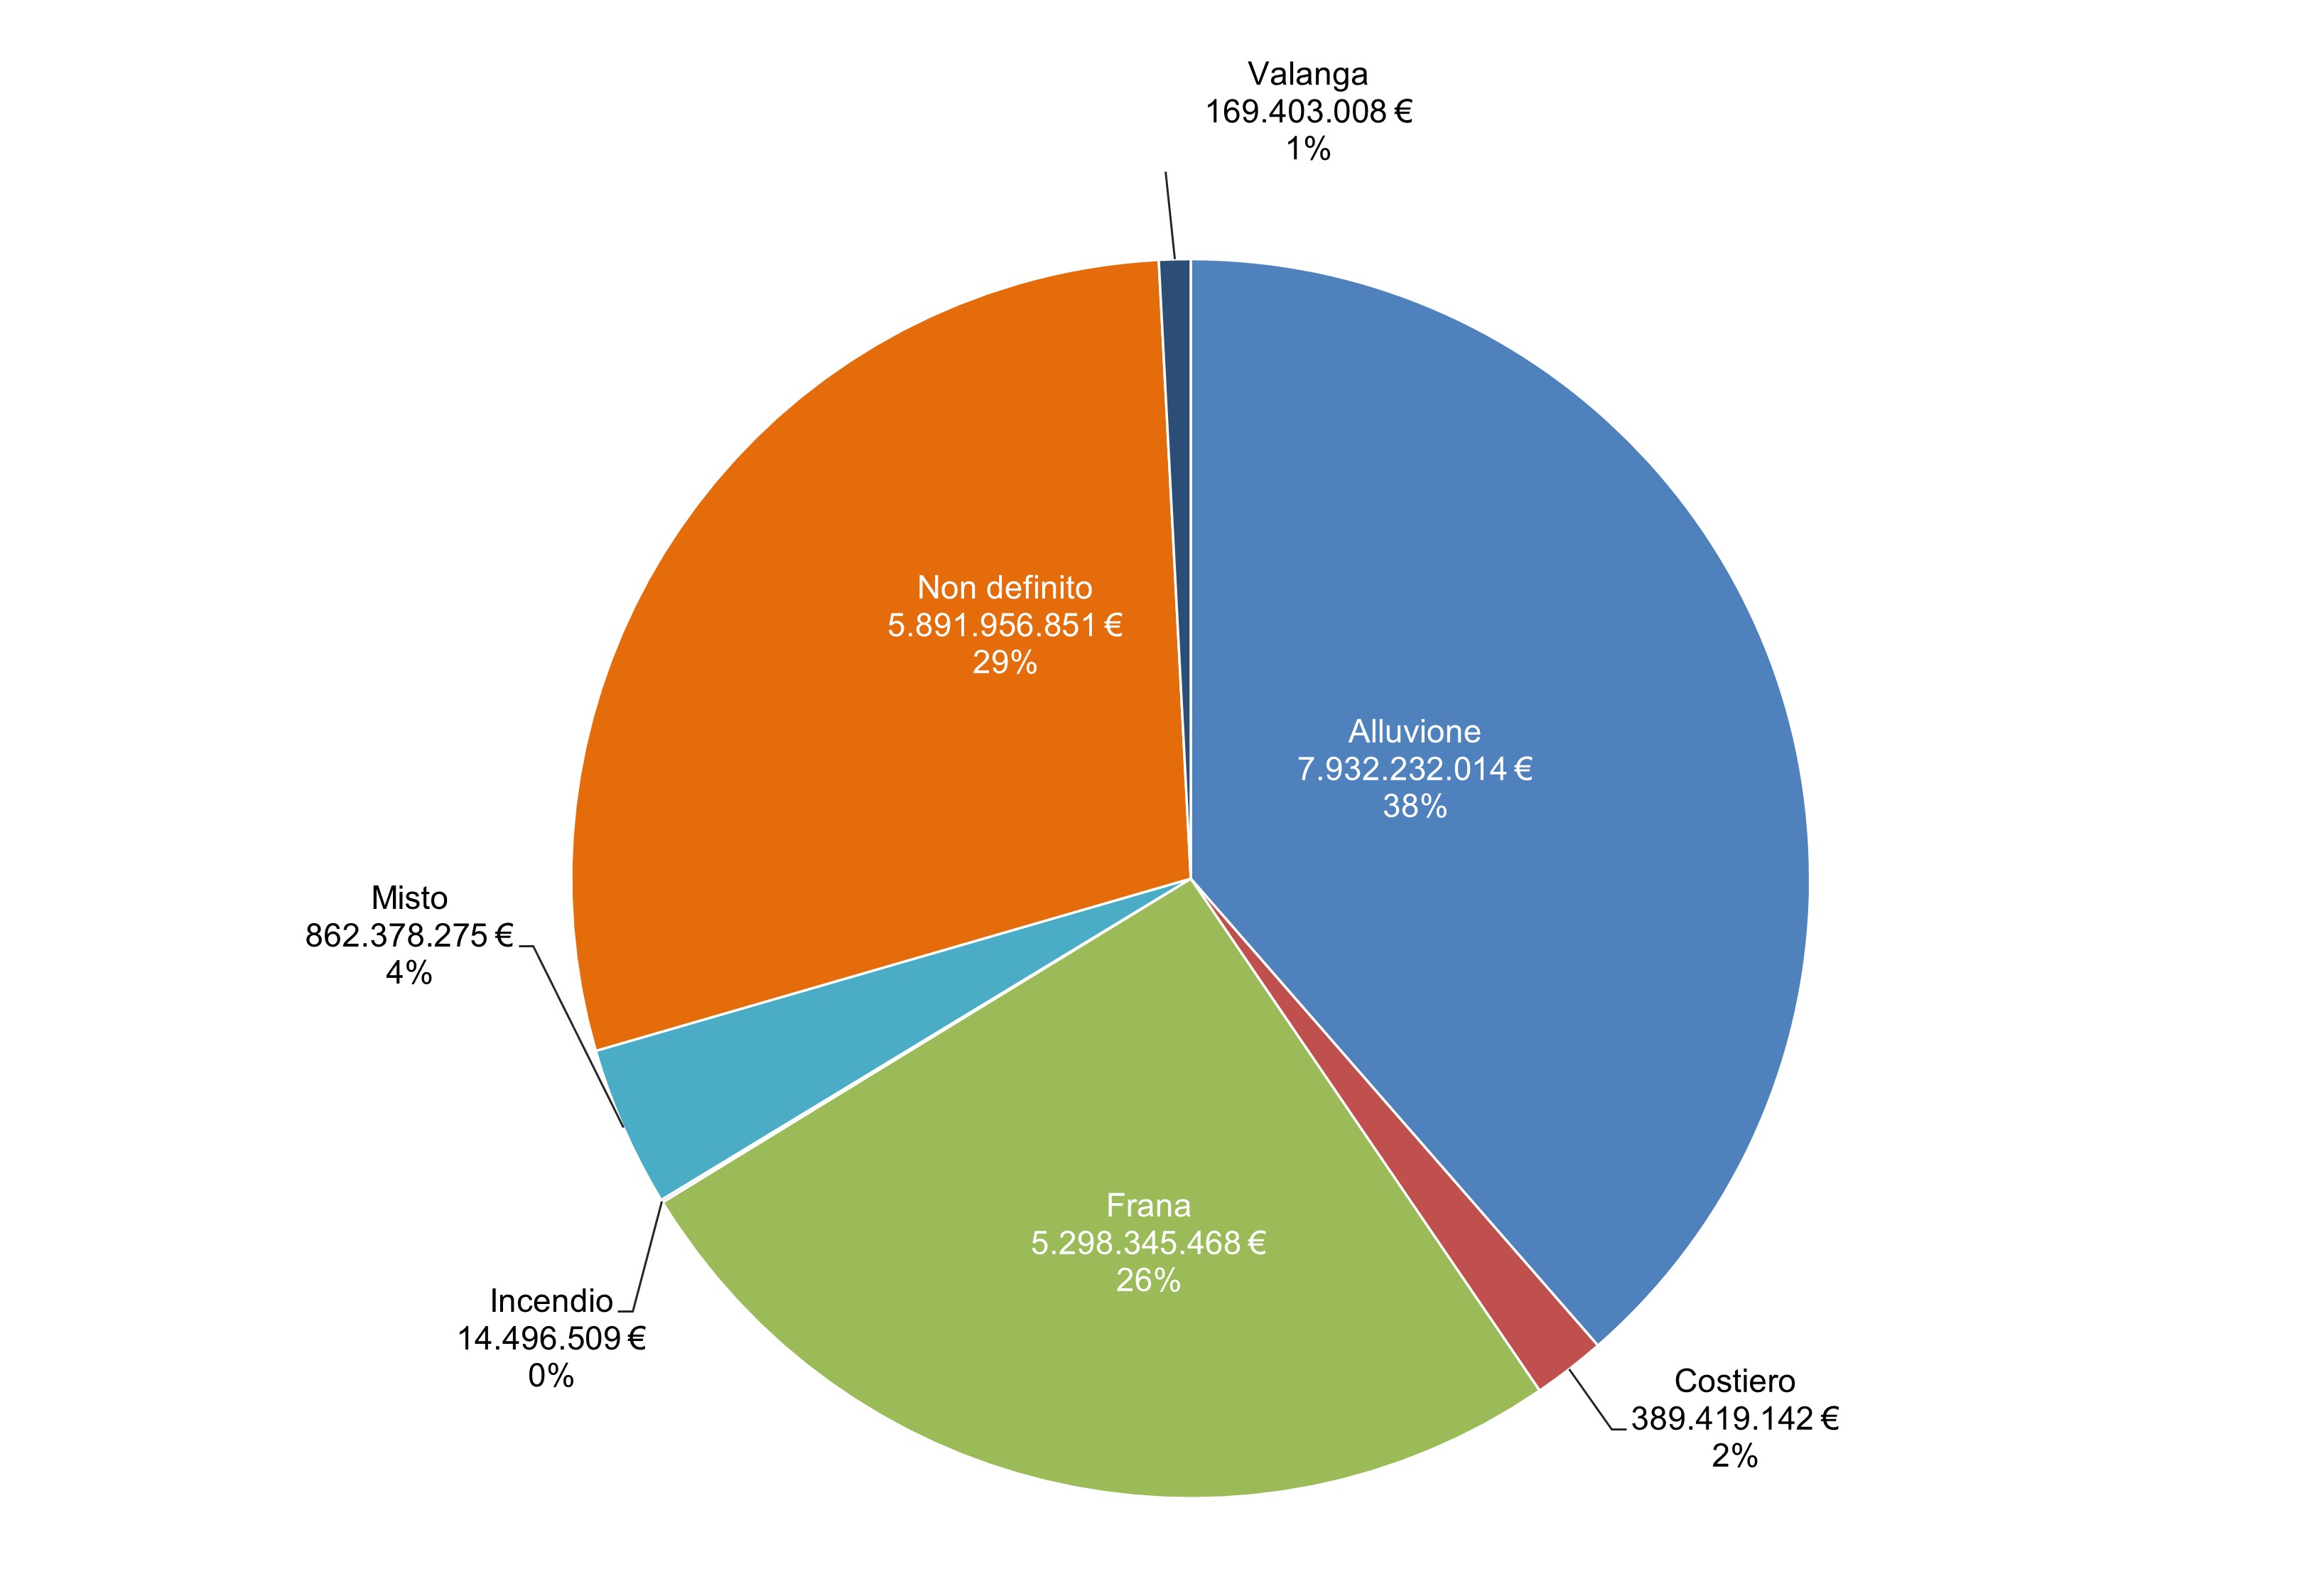
When these frequencies are compared with total allocated funding by hazard category (Figure 3b), it emerges that although landslide-related interventions are more numerous, hydraulic-risk interventions receive substantially higher funding (€7.932 billion versus nearly €5.3 billion). This reflects the much higher unit cost of hydraulic works, which typically affect larger areas and require more extensive planning, land acquisition and construction materials. This also aligns with their far broader territorial and environmental impact (e.g., flood-storage areas, diversion channels) compared with smaller-scale landslide-mitigation works.
A critical issue highlighted in Figures 3a and 3b is the large number of interventions (9,056, i.e. around 35% of the total) for which no hazard category has been specified. These account for 29% of total funding — nearly €5.892 billion. This gap stems from differences in available data: extra-MASE interventions lack technical detail because their records come exclusively from BDAP.
The implementation of Decree-Law 153/2024, which mandates the updating of all technical data in ReNDiS for all soil-protection interventions, should progressively reduce these information gaps.
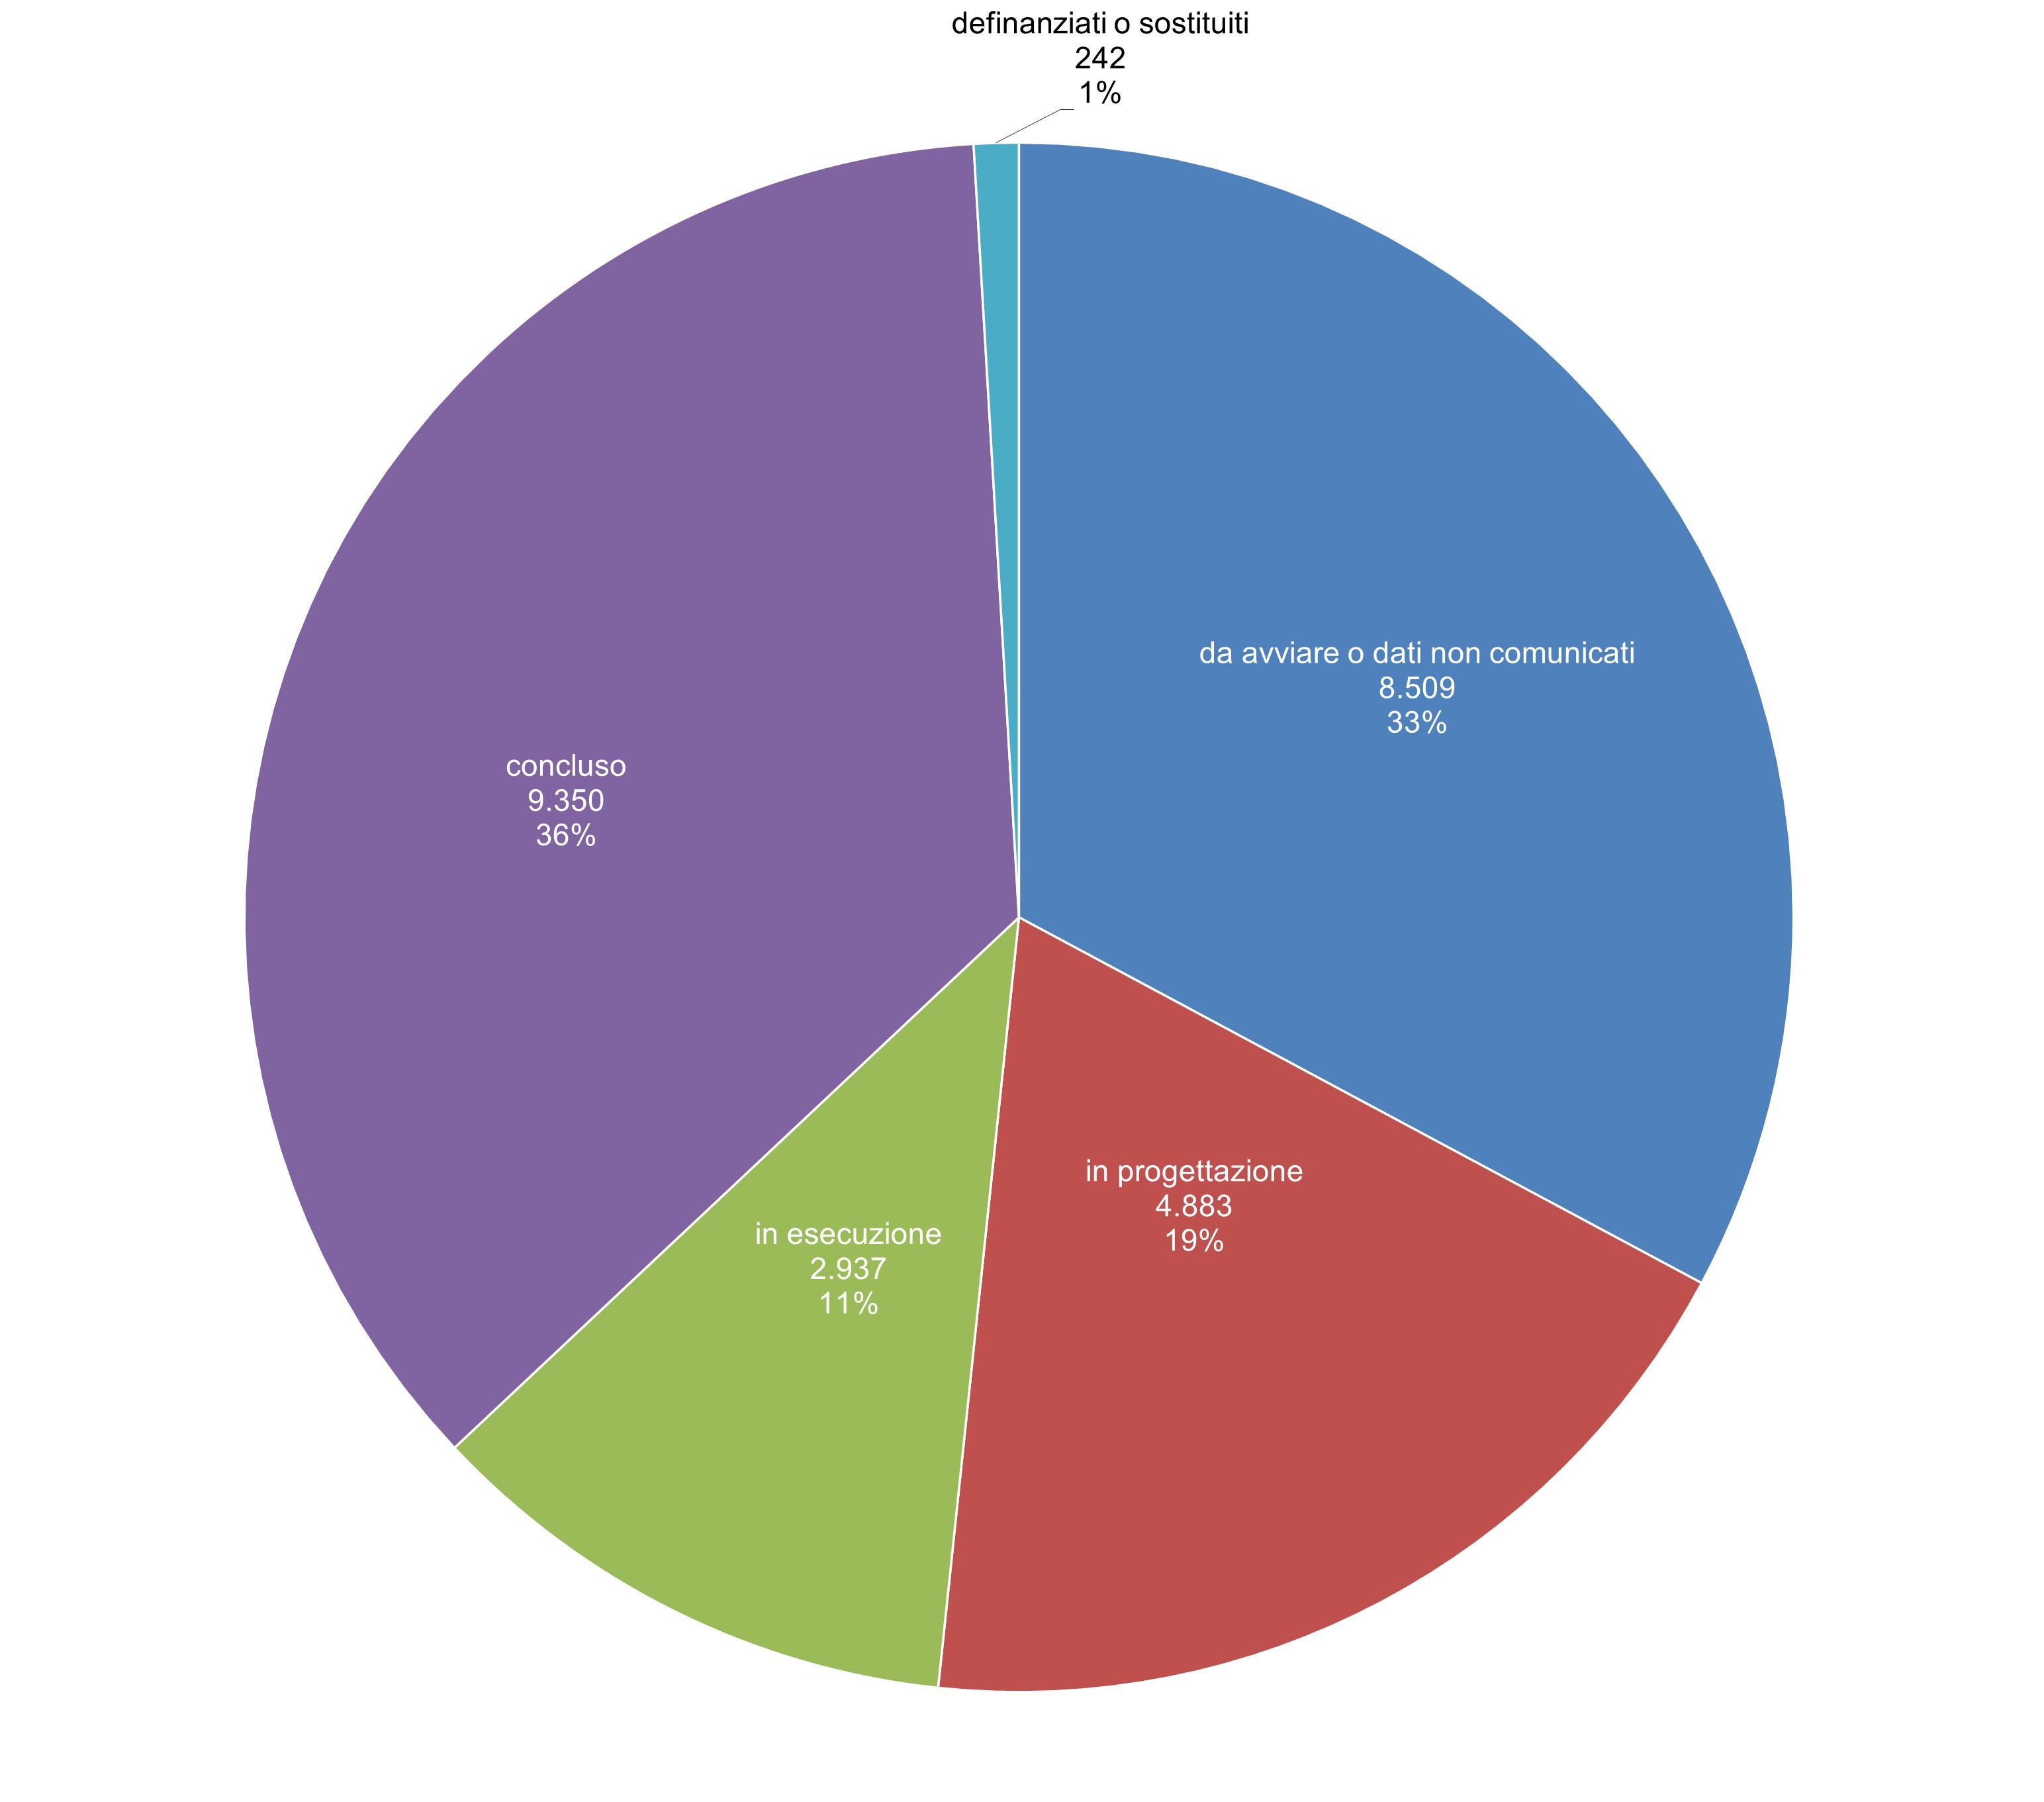
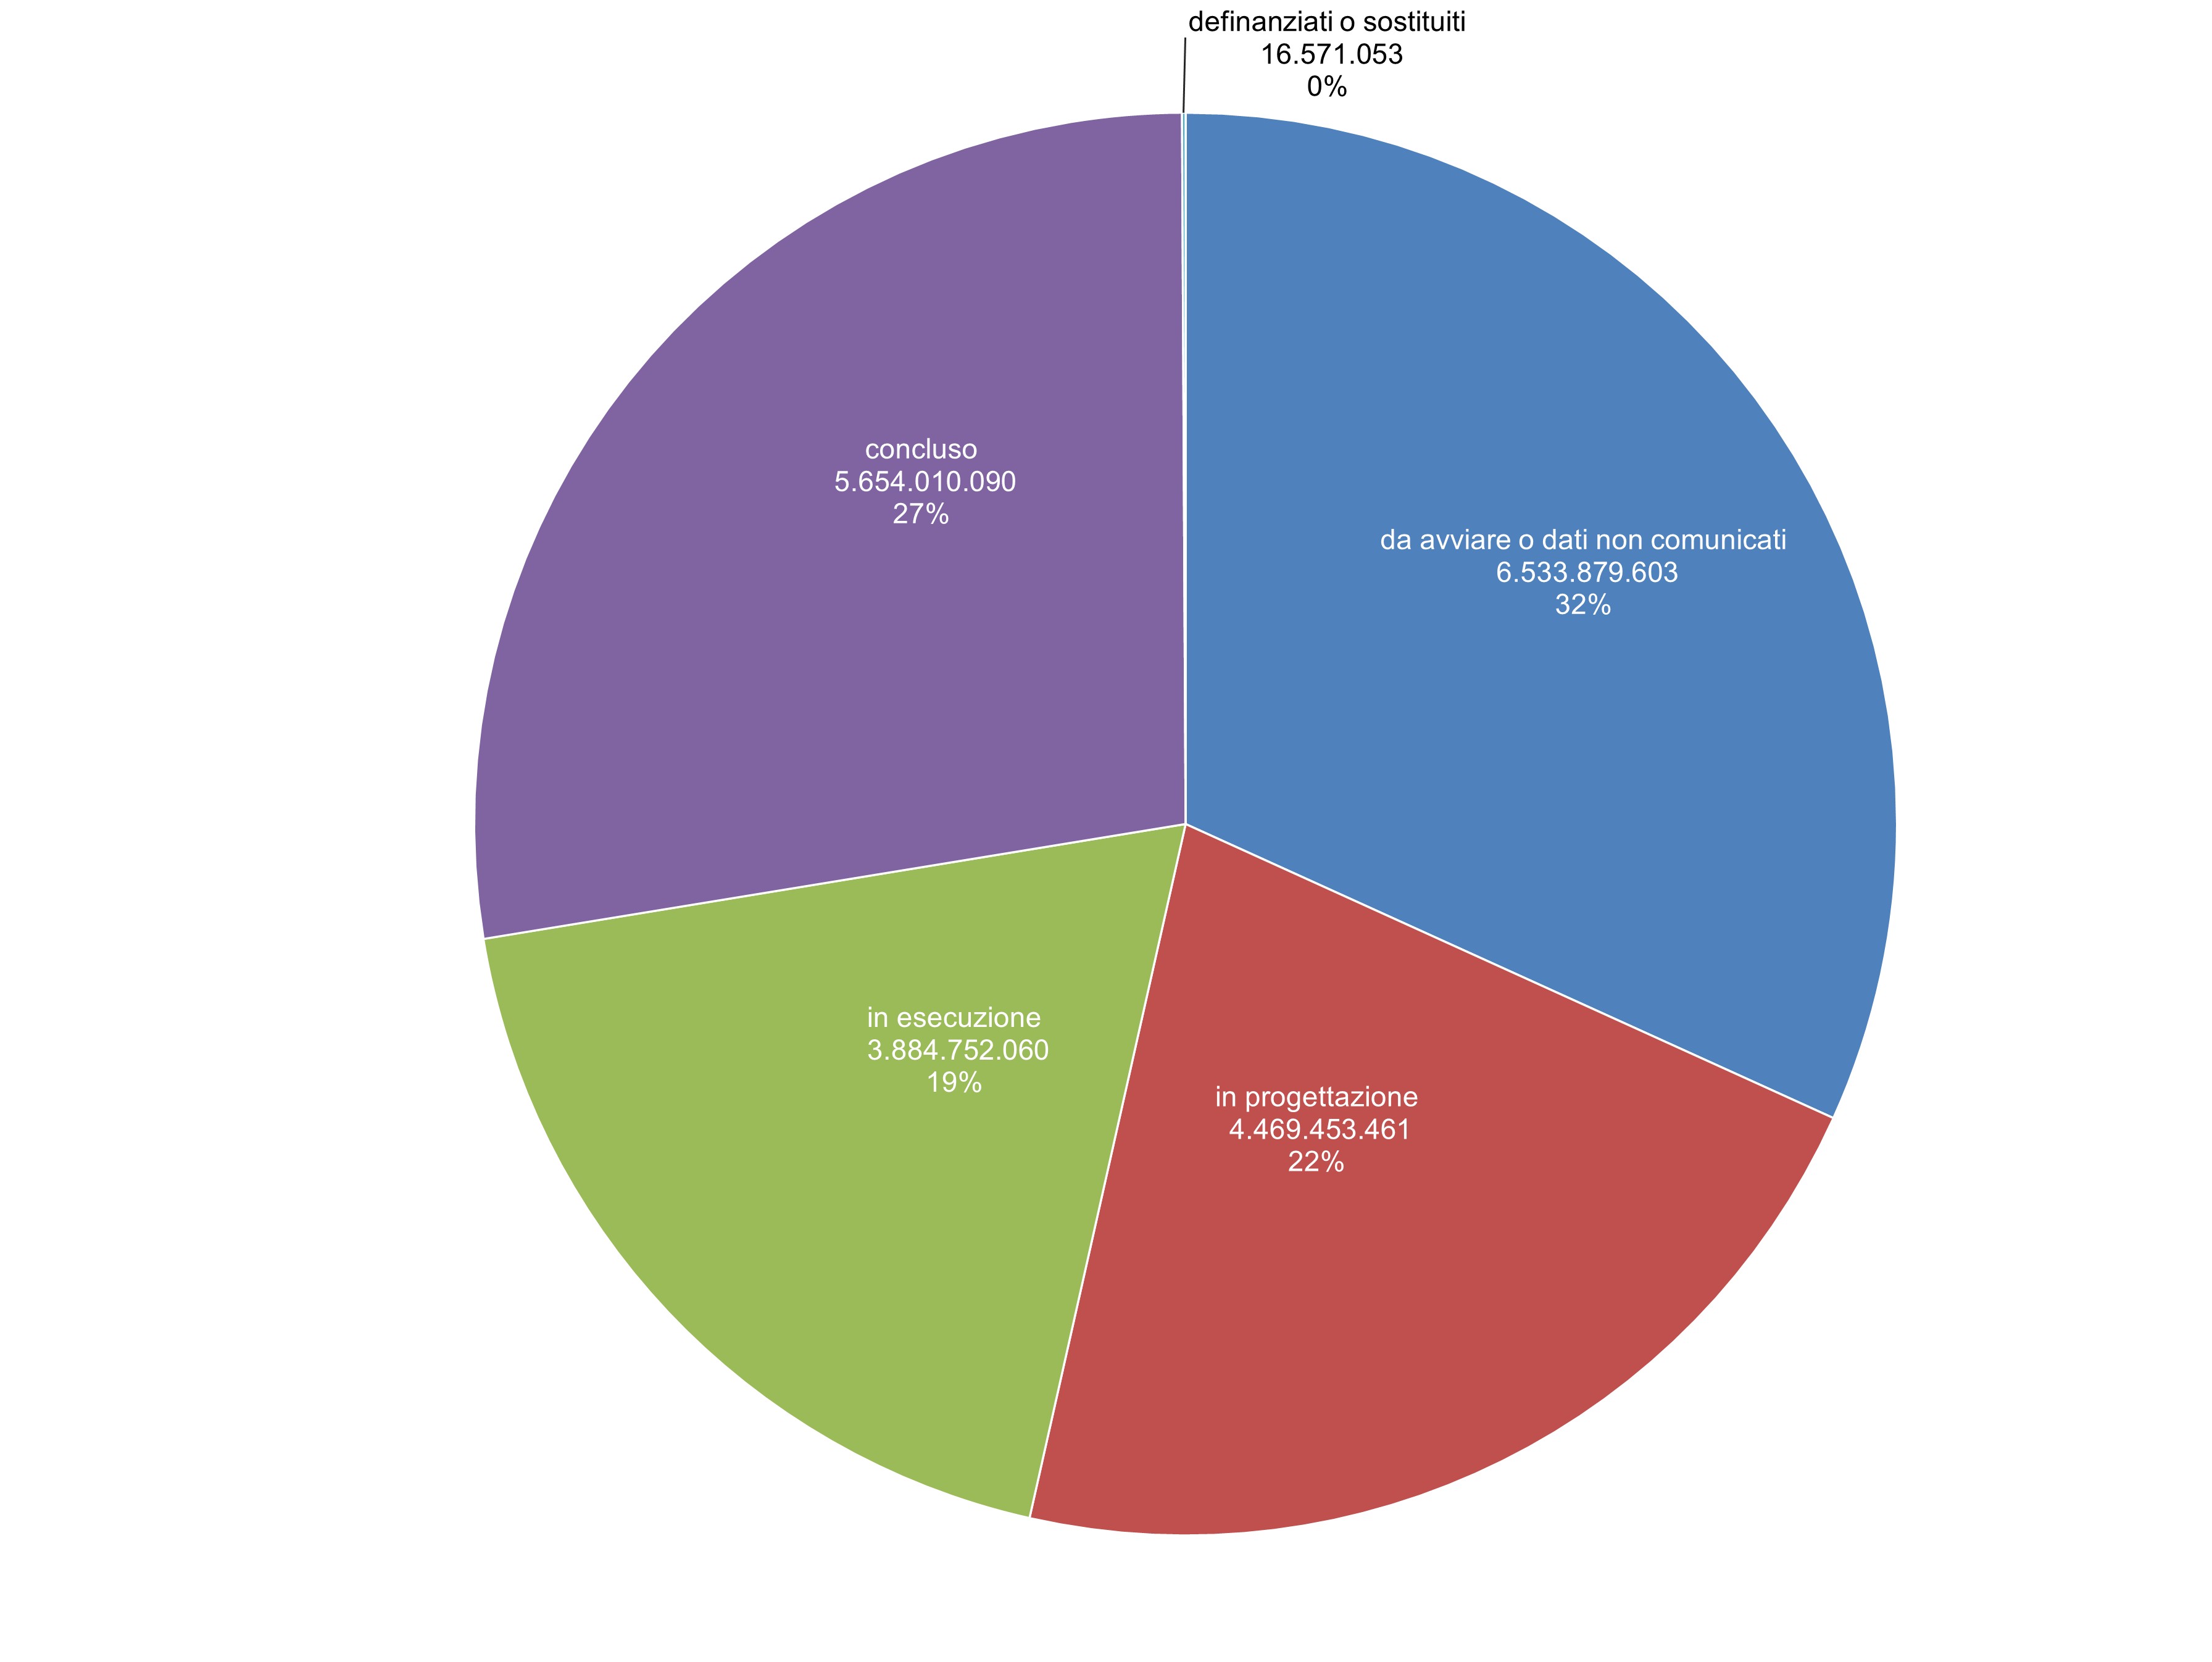
Analysis of intervention implementation status (Figures 4a and 4b) shows that out of 25,921 funded interventions, 36% (9,350) have been completed, 11% (2,937) are under construction, 19% (4,833) are in the design phase, and about 33% (8,509) have not yet started or lack reported data.
From a financial perspective, only 27% of total allocated resources (€5.564 billion) correspond to completed interventions; 19% (€3.885 billion) to projects under construction; 22% (€4.469 billion) to works in the design phase; and 32% (€6.534 billion) to interventions not yet started or with missing data.
The high share of interventions not yet initiated or lacking data is likely due to insufficient monitoring updates by the responsible authorities, both for MASE and extra-MASE projects.
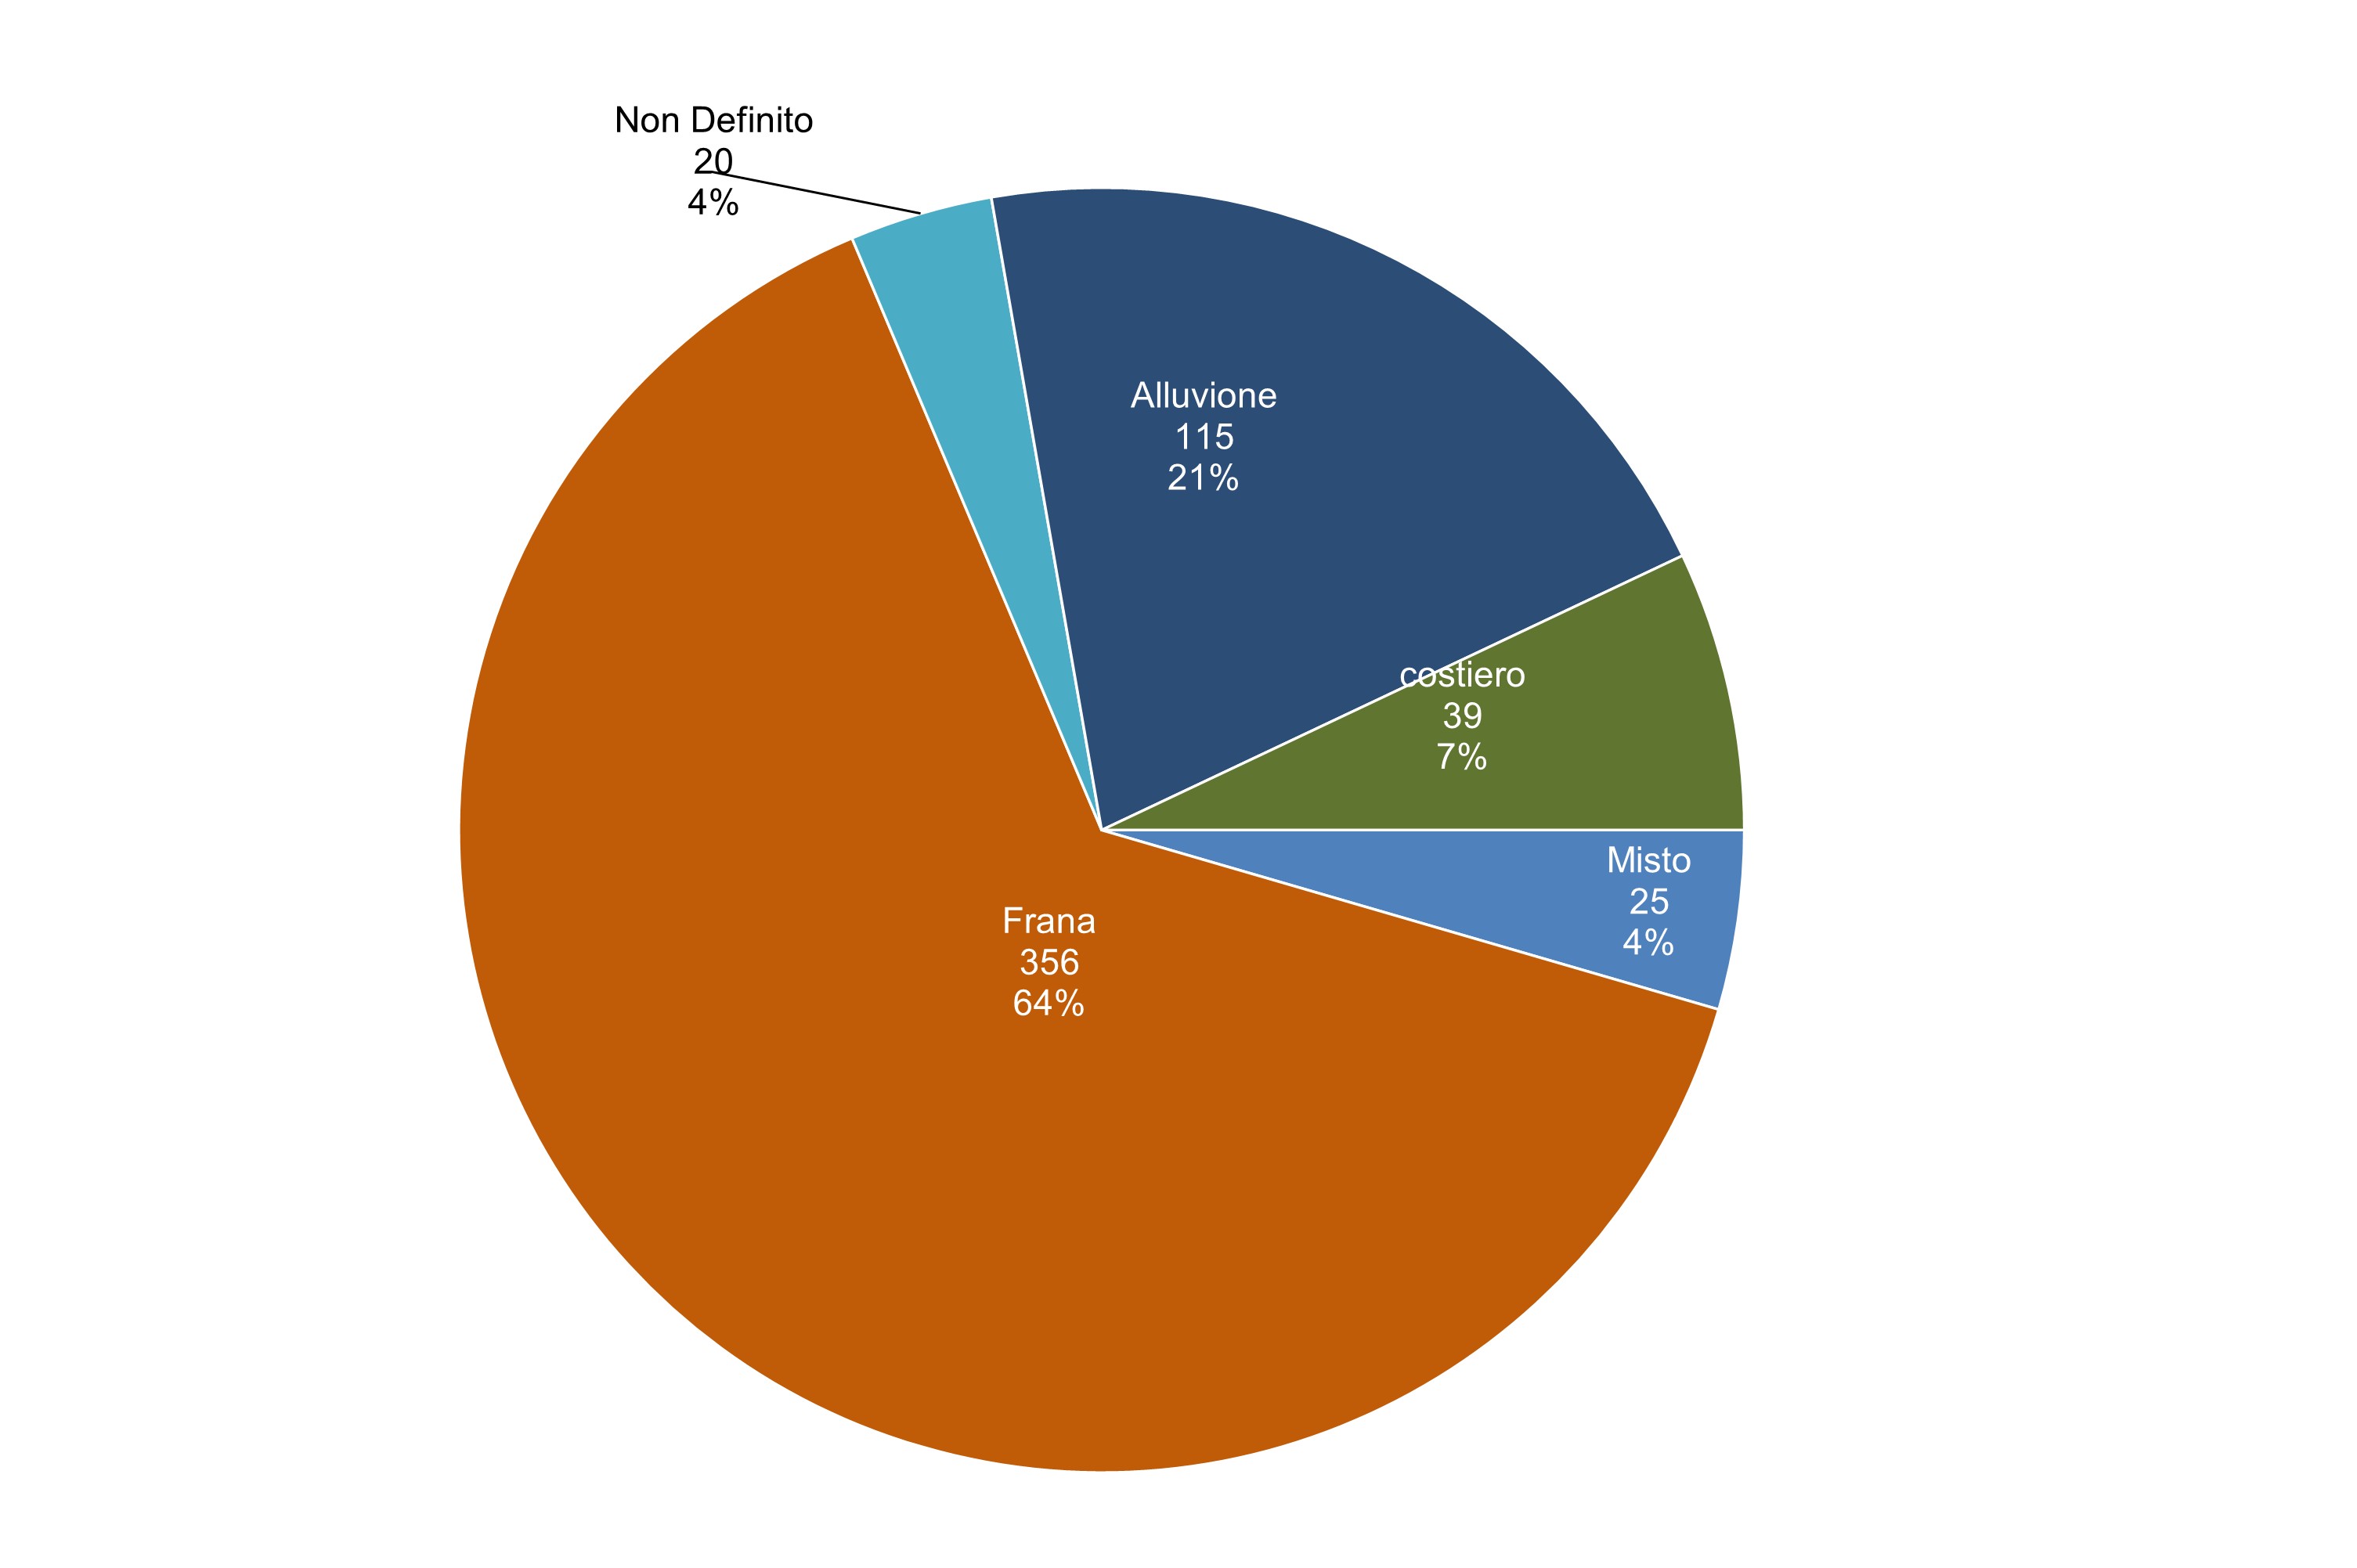
As regards funding requests for new mitigation measures submitted by Regions/Autonomous Provinces to MASE and Casa Italia as of 31 December 2024 (Figures 5a and 5b), 555 applications were deemed eligible for funding under the DPCM of 27 July 2021, for a total project cost of about €1.578 billion. Requests under the remit of Casa Italia represent a marginal share.
Analysis by hazard type (Figure 5a) shows that landslides account for the majority of requests, 54% (356 applications), while requests for hydraulic-risk interventions represent 21% (115). Coastal (39) and mixed (25) hazards together exceed 11%. Noteworthy is the relatively high number of applications (20; 4%) lacking hazard classification.
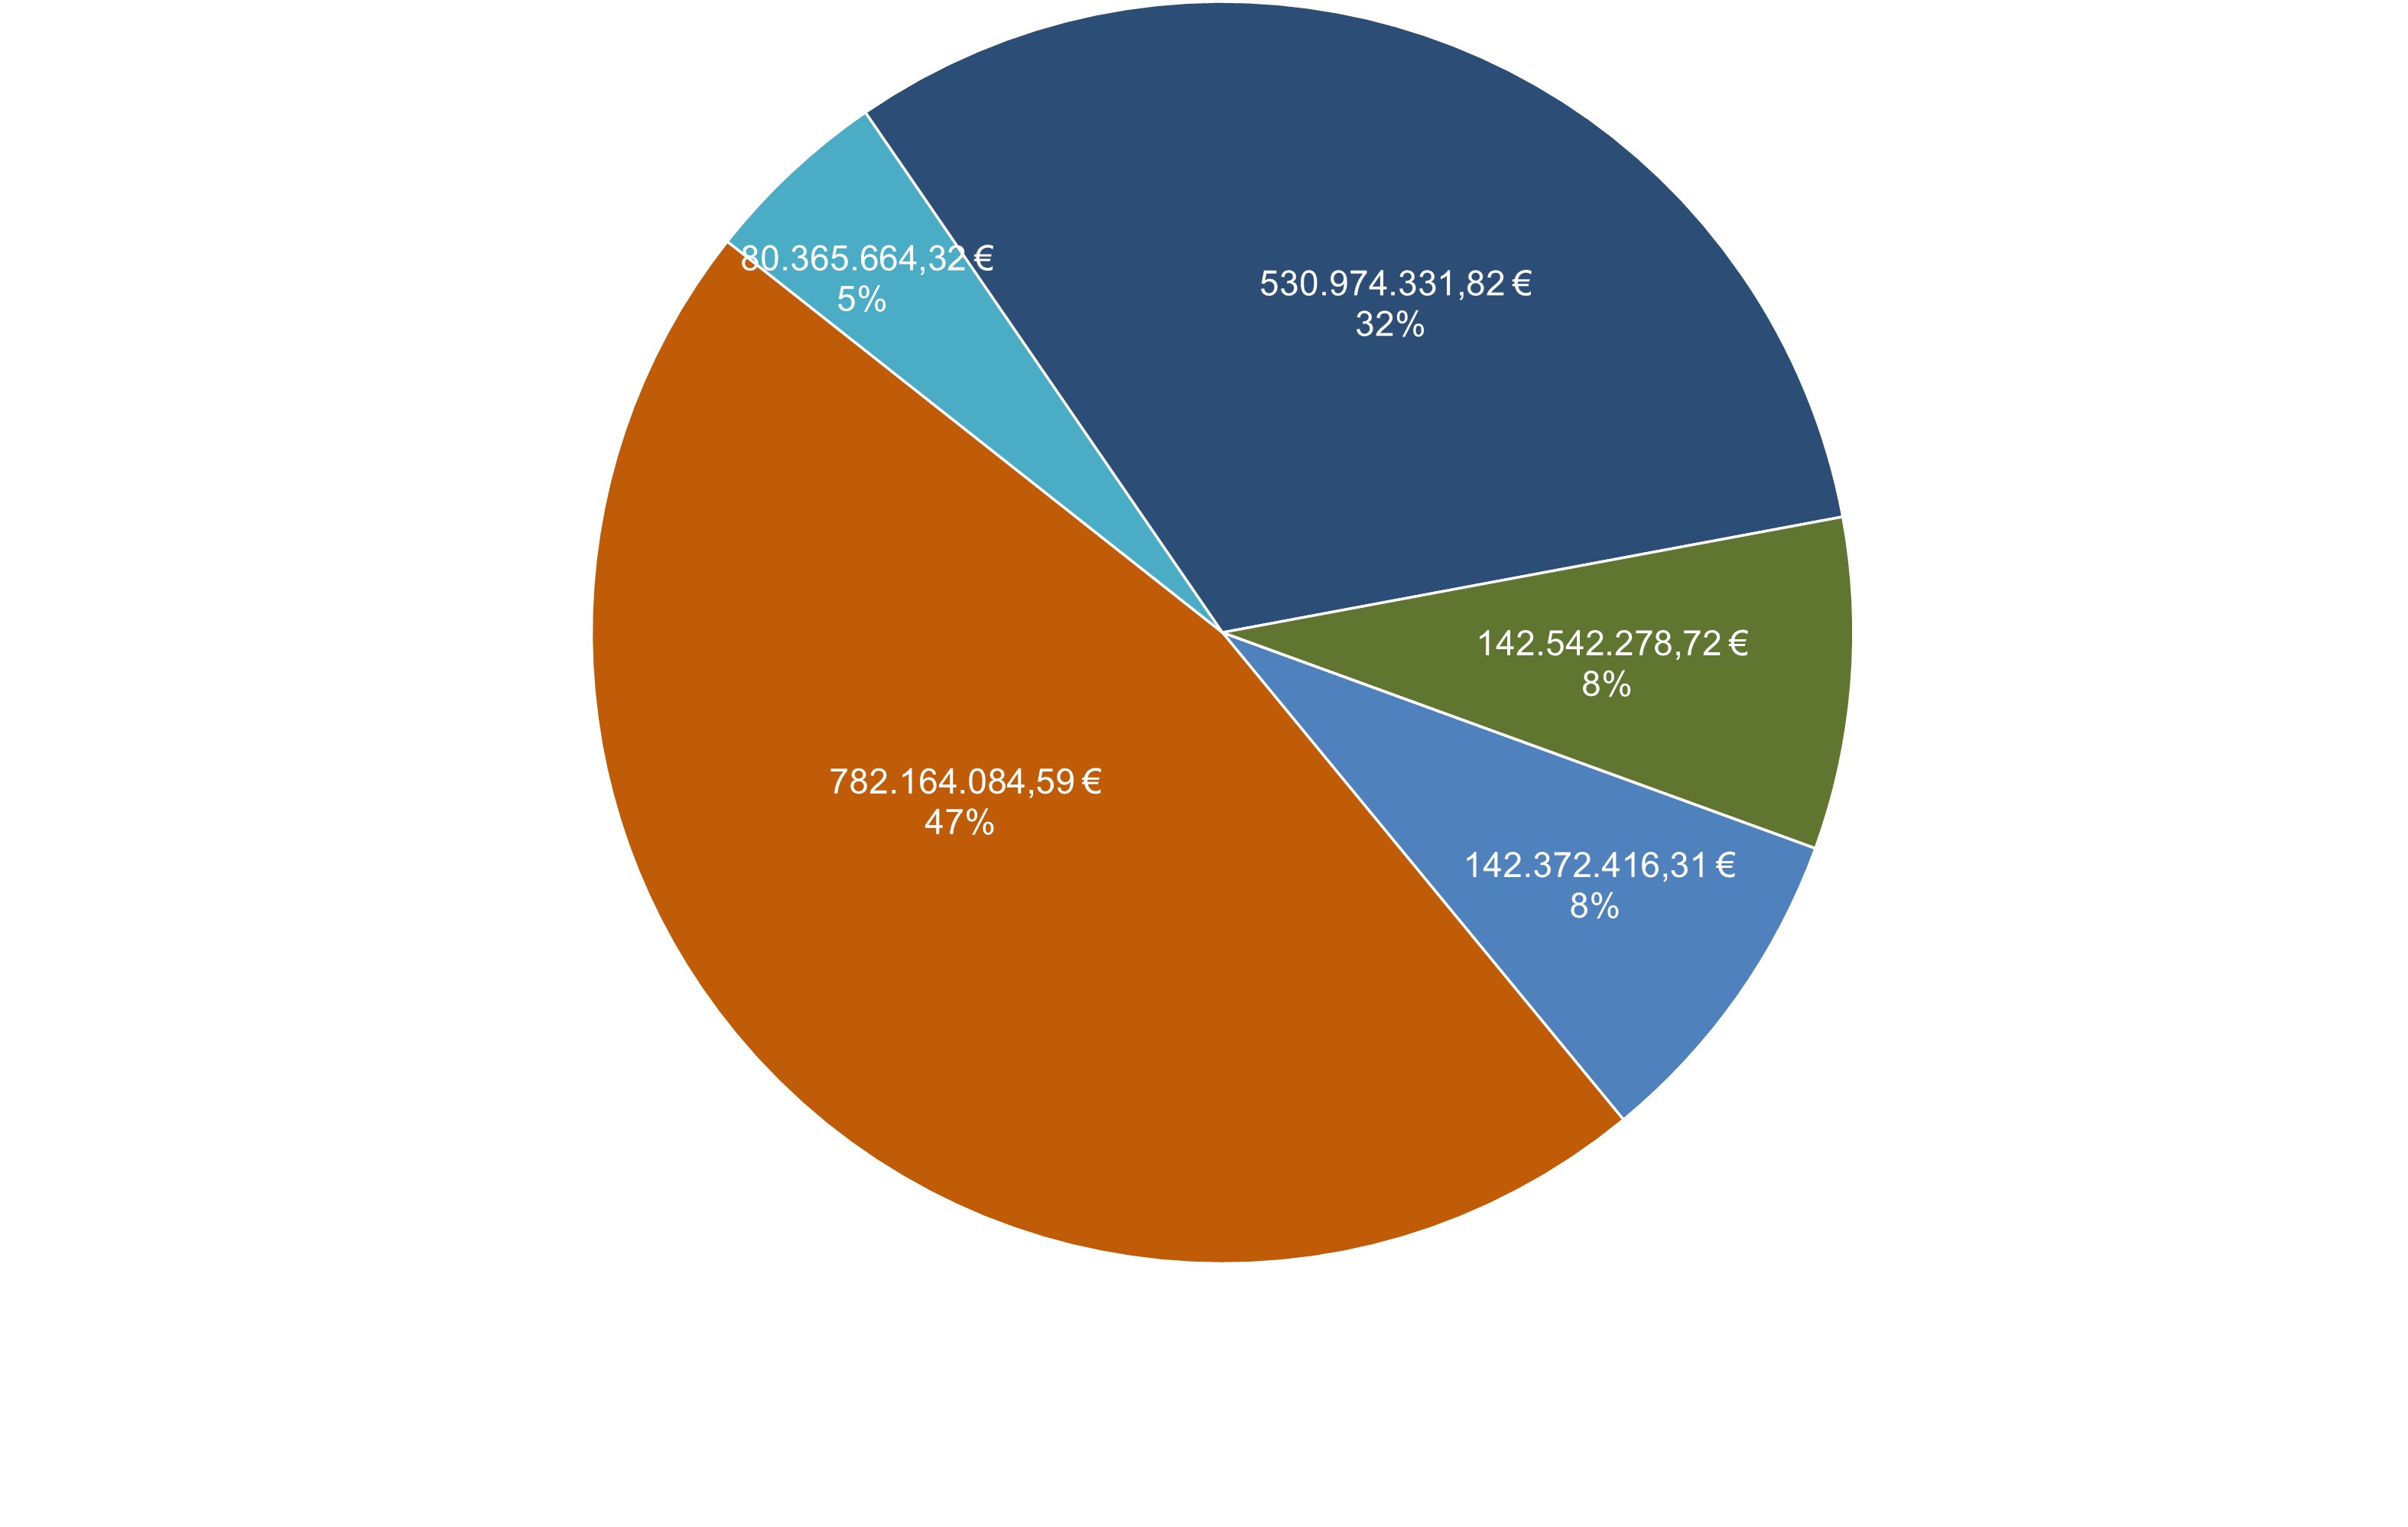
When comparing hazard categories with the requested funding amounts (Figure 5b), landslide-related applications — far more numerous than hydraulic ones (roughly 51% more) — account for 47% of the requested funds (€792 million). Hydraulic-risk interventions follow with nearly €531 million (32%), coastal interventions with €142.5 million (8%) and mixed instability with €142.3 million (8%). Applications lacking hazard classification represent 4% of all submissions and about 5% of requested resources.