ENVIRONMENTAL PROTECTION INVESTMENTS
Data aggiornamento scheda:
After the declines that had continued since 2017, in 2021, fixed capital investments (technologies) for environmental protection made by industrial enterprises recorded a significant increase of 81.0%, rising from €806 million to €1,454 million, marking a new local maximum. This increase was mainly driven by the electricity and gas supply industry (+135.5%) and the manufacturing industry (+103.9%). Companies continue to prefer end-of-pipe technologies over integrated ones, with a ratio of approximately 60:40. However, the latter recorded the largest increase, both compared to the previous year (+104.3%) and to 2016 (+21.0%).
Examining the period 2016–2021, it is noted that the environmental expenditure classes in which industrial enterprises invested the most cumulatively are "CEPA2: Wastewater management" (€2,140 million); "CEPA1: Air and climate protection" (€1,763 million); and "CEPA6: Protection of biodiversity and landscape" (€1,334 million). In the same period, the overall sectoral trend variation is +8.8%, with wide divergences, both positive and negative, among the sub-sectoral sections.
INDUSTRIAL PRODUCTION INDEX
Data aggiornamento scheda: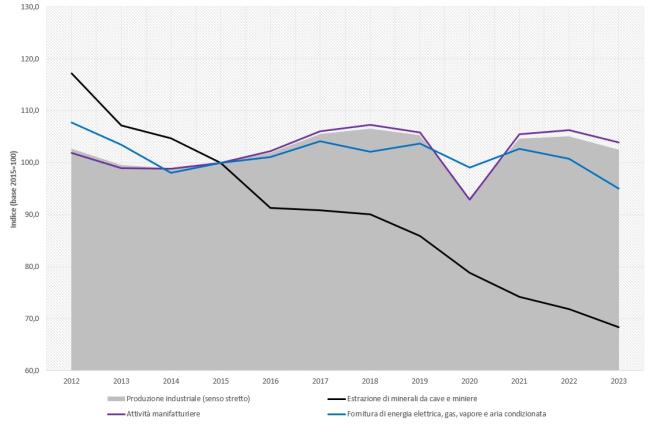
L'indice della produzione industriale descrive, attraverso la rilevazione mensile dei volumi di produzione effettiva, l’andamento dell’attività industriale (in senso stretto) italiana. Il livello di produzione industriale è un determinante correlato alle pressioni ambientali. La dinamica della produzione industriale in Italia, dopo un certo distacco durato nel periodo 2010-2013, presenta un andamento allineato a quello dei principali paesi industriali europei e alla media dell’area dell’euro (pur mantenendosi al di sopra). Nel 2020 si riscontra il minimo della serie storica (93,3), per via delle misure di contrasto alla crisi pandemica COVID-19 che hanno imposto la chiusura o una forte restrizione delle attività produttive. La ripresa della produzione industriale nel 2021 (104,7) è più forte di quella di Francia e Germania, ma viene superata dalla media dell’area dell’euro. Dopo il ristagno registrato tra 2021 e 2022 (105,1), l’indice torna a calare nel 2023 (102,5). La dinamica di medio-lungo periodo è comunque positiva: guadagna 2,5 punti percentuali nel 2023 rispetto all’anno base 2015. La variazione tendenziale per il raggruppamento “beni strumentali” è quella con il maggior rialzo (15,5 p.p.). Severa la riduzione, invece, per le attività estrattive minerarie (-31,6 p.p.) Quasi tutta la variabilità della produzione industriale nel tempo è spiegata dal variare del volume delle attività manifatturiere.
INDUSTRIAL PRODUCTION INDEX
Data aggiornamento scheda:
The Industrial Production Index (IPI) describes the trend of industrial activity (in the strict sense) in Italy through the monthly survey of actual production volumes. The level of industrial production is a key factor closely related to environmental pressures. After diverging during the 2010–2013 period, industrial production trends in Italy have aligned with those of the main European industrial countries and the euro area average (while remaining higher). In 2020, the index hit the historical minimum (93.3) due to COVID-19 containment measures, which led to the closure or strong restriction of production activities. The industrial production rebound in 2021 (104.7) was stronger than in France and Germany but was outpaced by the euro area average. After stagnating between 2021 and 2022 (105.1), the index declined again in 2023 (102.5). The medium- to long-term trend remains positive: in 2023, the index gained 2.5 percentage points compared to the base year 2015. The “capital goods” group showed the highest year-over-year increase (15.5 percentage points), while mining activities experienced a sharp decline (-31.6 p.p.). Nearly all variability in industrial production over time is explained by changes in manufacturing activity volumes.
ENVIRONMENTAL PROTECTION INVESTMENTS
Data aggiornamento scheda:
Dopo le diminuzioni, che proseguivano dal 2017, nel 2021 gli investimenti in capitale fisso (tecnologie) per la protezione dell’ambiente effettuati dalle imprese industriali registrano un aumento importante, pari all’81,0%, passando da 806 M€ a 1.454 M€, segnando un nuovo massimo locale. L’aumento è trainato, soprattutto, dall’industria della fornitura di energia elettrica e gas (+135,5%) e dall’industria manifatturiera (+103,9%). Le imprese continuano a preferire le tecnologie di fine ciclo (end of pipe) rispetto a quelle integrate, con un rapporto di circa 60:40, ma sono queste ultime ad aver segnato l’aumento più grande, sia rispetto all’anno scorso (+104,3%), sia rispetto al 2016 (+21,0%). Esaminando il periodo 2016-2021, si rileva che le classi di spesa ambientale in cui le imprese industriali hanno investito di più, cumulativamente, sono “CEPA2: Gestione delle acque reflue” (2.140 M€); “CEPA1: Protezione dell’aria e del clima” (1.763 M€) e “CEPA6: Protezione della biodiversità e del paesaggio” (1334 M€). Nello stesso periodo la variazione tendenziale complessiva di settore è del +8,8%, con ampie divergenze, di segno positivo e negativo, tra le sezioni sub-settoriali.