Roberto Borghesi, Maria Cortese, Roberto Cristofaro, Geneve Farabegoli, Tiziana Mazza, Simona Spuri
The indicator represents emissions in the refining sector, taking into account the three environmental components: air, water, and waste, particularly: airborne emissions of major pollutants such as SOx, NOx, CO, and particulates; emissions of polluting substances into water, such as COD (chemical oxygen demand), TSS (total suspended solids), phenols, and total hydrocarbons; the quantity of total waste, including hazardous and non-hazardous waste produced, and the waste recovery rate. Air emissions have decreased significantly over the past 10 years, thanks to the introduction of more restrictive limits in the AIA (Integrated Environmental Authorisation) measures and the implementation of BAT (Best Available Techniques). The largest reduction in polluting emissions in water is observed for the pollutant TSS, which has decreased by 84.8% between 2011 and 2023. The percentage of waste sent for recovery has increased, rising from 26.7% in 2011 to 42.7% in 2023. The improvements achieved in terms of reduction of polluting emissions in water and the percentage of waste sent for recovery can be attributed to the environmental management systems implemented by operators, based on the specific requirements of the Integrated Environmental Authorisations imposed by the MASE (Ministry of Environment and Energy Security), especially since 2018, the period of comprehensive reviews of AIA for refineries, and to the monitoring activities carried out by ISPRA for environmental monitoring, which is conducted during both regular and extraordinary inspection controls.
The indicator represents: 1. the airborne emissions of SOx, NOx, CO, and particulate matter, relative to the authorized mass flows before the AIA (2009-2010, pre-AIA situation), following the first AIA (2011-2016), after the review post-“BAT Conclusions” (post-review situation 2018-2023), and actual emissions in the subsequent years; 2. the quantities of polluting substances, per ton of crude oil processed, discharged into water bodies after treatment in a treatment plant, containing COD (Chemical Oxygen Demand), TSS (Total Suspended Solids), phenols, and total hydrocarbons, measured by operators at the authorized discharge points and monitored in terms of flow rate; 3. the total quantity of waste produced per ton of crude oil processed, non-hazardous waste per ton of crude oil processed, and hazardous waste per ton of crude oil processed. The waste recovery index is given by the ratio between the quantity of hazardous and non-hazardous waste sent for recovery and the total quantity of waste produced in each year of operation.
-
Evaluate the air emissions of major pollutants, SOx, NOx, CO, and particulates, following the issuance of AIA decrees.
-
Assess the environmental performance of the management and treatment systems for pollutants such as COD, TSS, phenols, and total hydrocarbons discharged into water by refineries, quantifying the environmental impact on aquatic environments in terms of annual emissions of pollutants discharged.
-
Evaluate the waste recovery index through the application of Environmental Management Systems with related operational procedures, as outlined in the “BAT Conclusions.”
BAT CONCLUSIONS - COMMISSION IMPLEMENTING DECISION OF 9 OCTOBER 2014 - 2014/738/EU ESTABLISHING THE CONCLUSIONS ON THE BEST AVAILABLE TECHNIQUES CONCERNING THE REFINING OF PETROLEUM AND NATURAL GAS.
D.Lgs. 46/2014 - IMPLEMENTATION OF DIRECTIVE IED 2010/75/EU - INDUSTRIAL EMISSIONS DIRECTIVE IMPLEMENTATION OF DIRECTIVE WFD 2000/60/EU - WATER FRAMEWORK DIRECTIVE.
D.Lgs. 152/2006 AND AMENDMENTS – TUA (UNIFIED ENVIRONMENTAL TEXT).
The Integrated Environmental Authorization (AIA) is the measure that authorizes the operation of an installation under certain conditions, aiming to prevent, reduce, and control emissions to air, water, and soil, including measures related to waste, in order to maintain a high level of environmental protection, in accordance with the requirements of Directive IPPC 96/61/EC, which was later replaced by Directive IED 2010/75/EU on industrial emissions, transposed in Part II of D.Lgs. 3 April 2006, no. 152 and amendments, as modified by D.Lgs. 46/2014. Directive IED 2010/75/EU was recently revised by Directive 2024/1785/EU, which will enter into force on 4 August 2024. Installations involved in activities listed in Annex VIII to Part II of D.Lgs. 152/2006 are subject to the AIA procedure. Those under state jurisdiction are defined in Annex XII to Part II (such as large combustion plants, petroleum refineries, gasification and liquefaction plants (of at least 500 t/day), integrated steelworks, chemical plants beyond a certain production threshold, gas compression stations, offshore plants such as gas extraction platforms and regasification units). The AIA is issued taking into account the guidelines in Annex XI to Part II of D.Lgs. 152/06. Considerations to be taken into account in general or in specific cases when determining the best available techniques, as defined in Article 5, paragraph 1, letter 1 ter), considering costs and benefits that may result from an action, and the precautionary and preventive principles and the related conditions, as defined with reference to the BAT Conclusions (Best Available Techniques). The AIA is reviewed and applied following the issuance of Decision 2014/738/EU of 9 October 2014, which establishes the conclusions on the best available techniques concerning the refining of petroleum and natural gas, pursuant to Directive 2010/75/EU, within 4 years of the publication in the Official Journal of the European Union of the “BAT Conclusions,” which include the new emission limit values (ELVs) for pollutants in environmental media. Furthermore, regarding the emissions of pollutants into water, it is also necessary to consider Decision 2016/902/EU of 30 May 2016, which establishes the conclusions on the best available techniques concerning common wastewater and exhaust gas treatment/management systems in the chemical industry. Finally, Directive 2010/75/EU provides that where an environmental quality standard – such as those derived from Directive 2000/60/EU – requires more stringent conditions than those achievable through the use of BAT, additional measures must be provided in the Integrated Environmental Authorization, subject to other measures that can be adopted to comply with environmental quality standards.
Partial data heterogeneity concerning the three environmental components — air, water, and waste — is due to the different requirements and conditions outlined in the authorization documents, the specific plant and territorial characteristics of each installation, and the varying quality of the data.
Implementazione di un database dedicato nel quale i gestori dovranno caricare i dati ambientali richiesti in maniera puntuale e omogenea. Informare e sensibilizzare i gestori delle raffinerie sull’importanza della trasmissione dei dati.
MASE (Ministry of Environment and Energy Security)
National
2009-2023 (air emissions); 2011-2023 (water emissions of COD and TSS); 2018-2023 (water emissions of Phenols and Total Hydrocarbons); 2011-2023 (waste produced per tonne of crude oil and percentage of total waste sent for recovery).
The indicator was developed as follows:
-
By calculating the mass flow based on the authorized concentrations and emission flows at maximum production capacity before the AIA (pre-AIA situation), after the first AIA (post-AIA situation), and after the review following the "BAT Conclusions" (post-review situation). For the subsequent years, the mass flow was calculated based on the measured concentrations and the actual emission flows during the reference period.
-
By calculating the mass flows of COD, SST, Phenols, and Total Hydrocarbons emitted into water, normalized by crude oil processed. Then, the percentage change in the flows of COD and SST emitted by the refineries between 2023 and 2011 was calculated, as well as the percentage change in the flows of Phenols and Total Hydrocarbons between 2023 and 2018 (post-overall AIA review in accordance with the European regulation, BAT Conclusions of 2018).
The indicator includes the pollutant flows emitted by 7 refineries—selected from the 11 refineries currently operating in the country—since they are equipped with wastewater treatment systems at the same site and hold relevant discharge permits into water bodies.
-
By calculating the total waste, hazardous, and non-hazardous waste produced per ton of crude oil processed; specifically, by calculating the ratio of waste quantity in kg per ton of crude oil processed. The waste recovery indicator was calculated as the ratio between the quantity of hazardous and non-hazardous waste sent for recovery and the total quantity of waste produced in each year of operation.
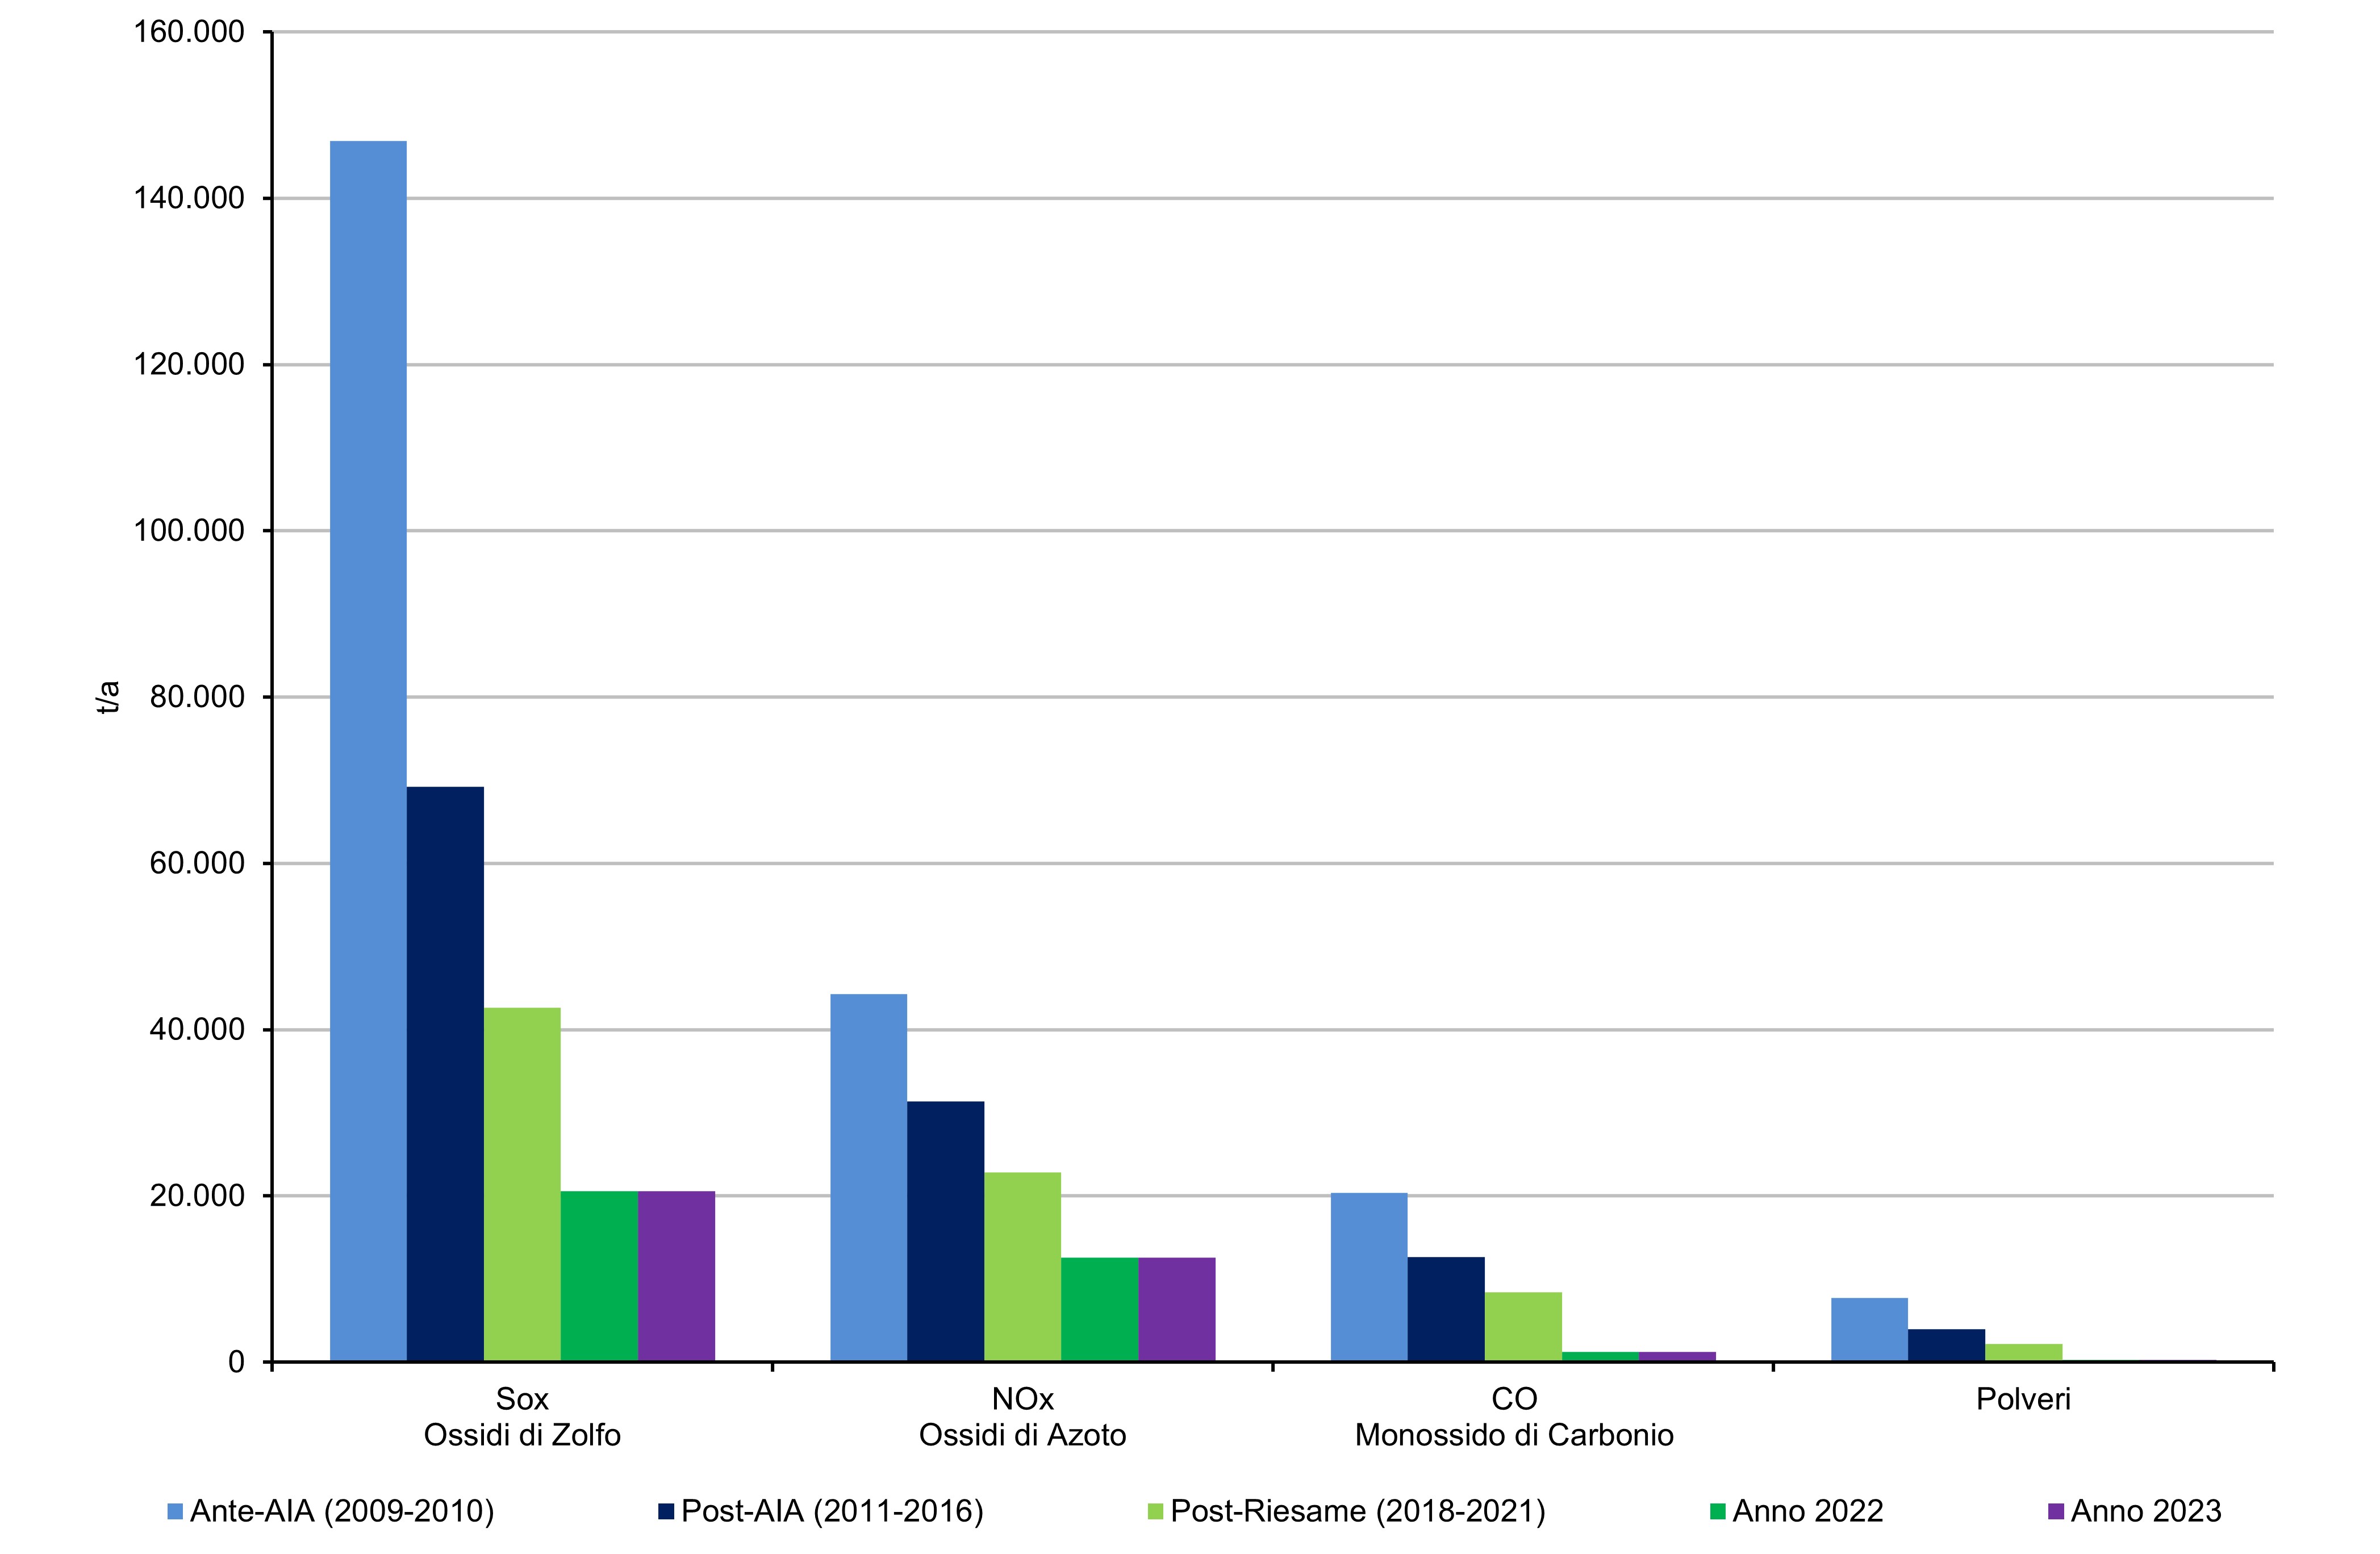
The emission status of the refinery sector is the result of the application of the BAT established at the European level, the issuance of Integrated Environmental Authorizations by the Competent Authorities, and the implementation of BAT AELs (Associated Emission Limits) during the comprehensive reviews, in line with the principles of pollution prevention and control. In 2023, the actual air emissions released by refinery installations were significantly lower than the authorized air emission values in the post-“BAT Conclusions” reviews (2018-2021 post-review situation), and aligned with the actual air emission values emitted in 2022 (Table 1 and Figures 1 and 2).
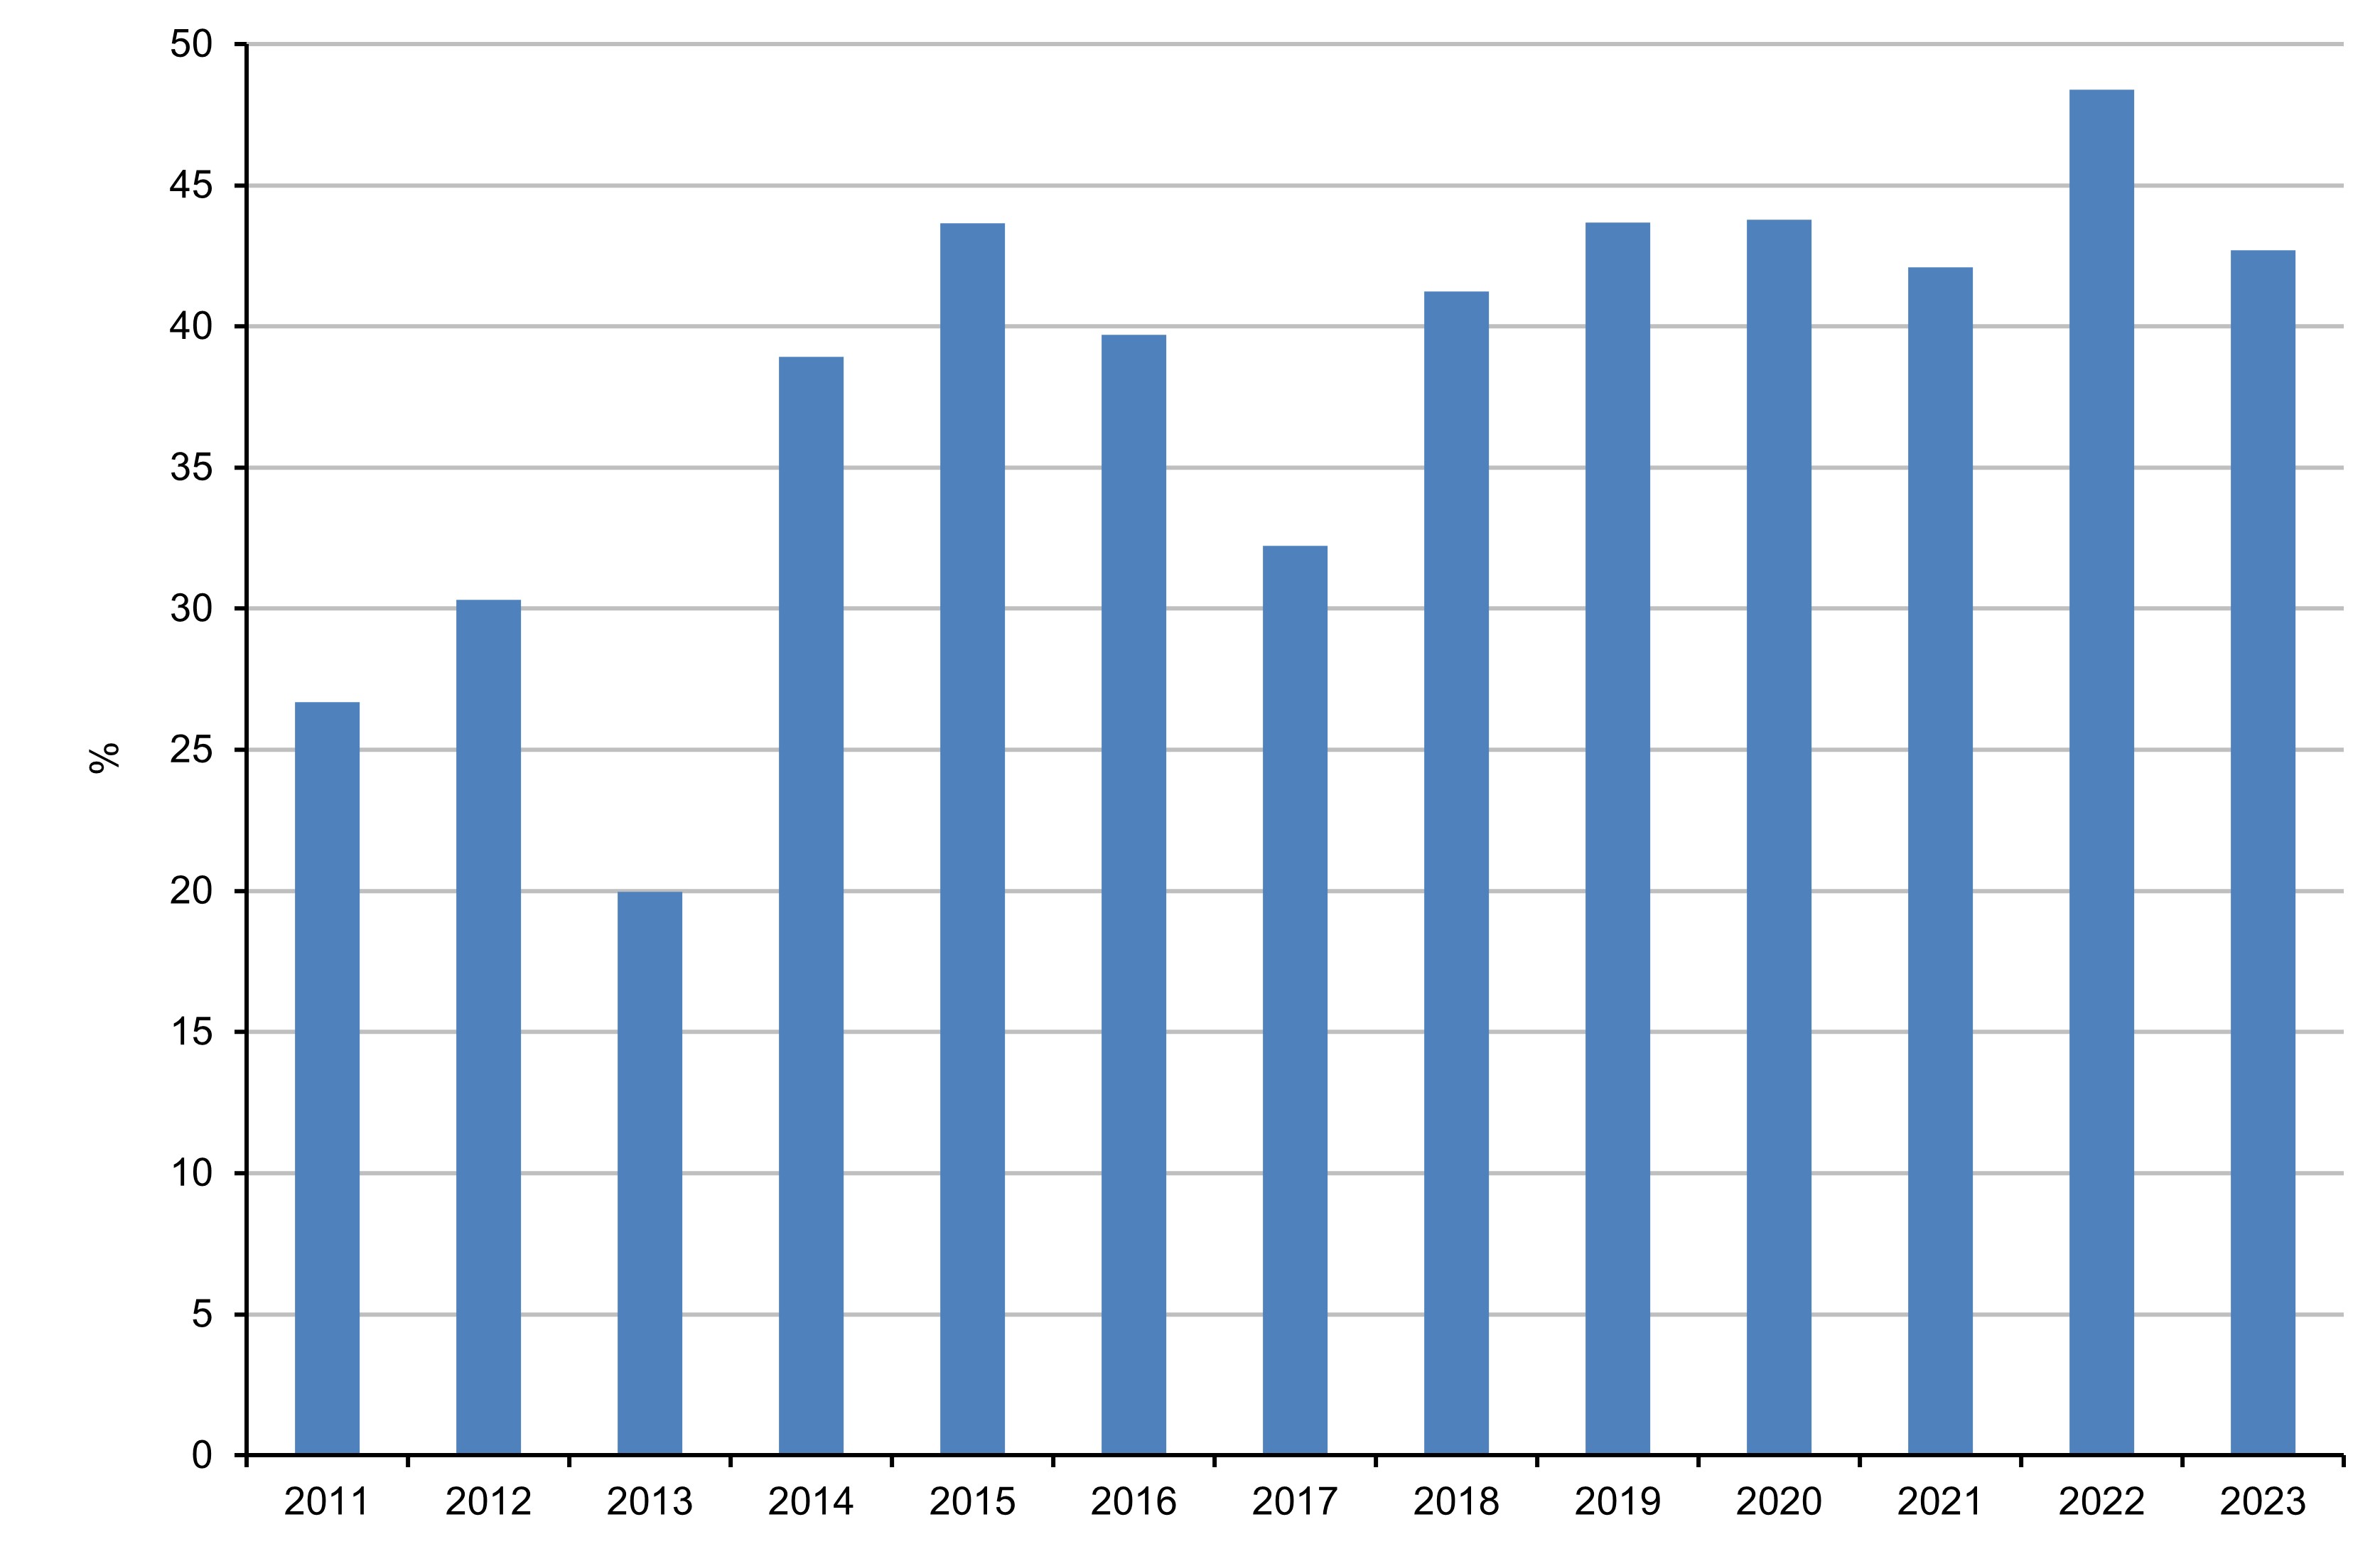
Regarding water emissions, the values remained virtually stable compared to the previous year; there were no changes for SSTs, while there was a slight increase in COD (Figure 5) and Total Hydrocarbons, and a small decrease in Phenols (Figure 6). As for the waste recovery index, it decreased compared to the previous year but remained consistent with the trend of the last 5 years, reaching 42.7% (Figure 7). Overall, the status can therefore be considered good.
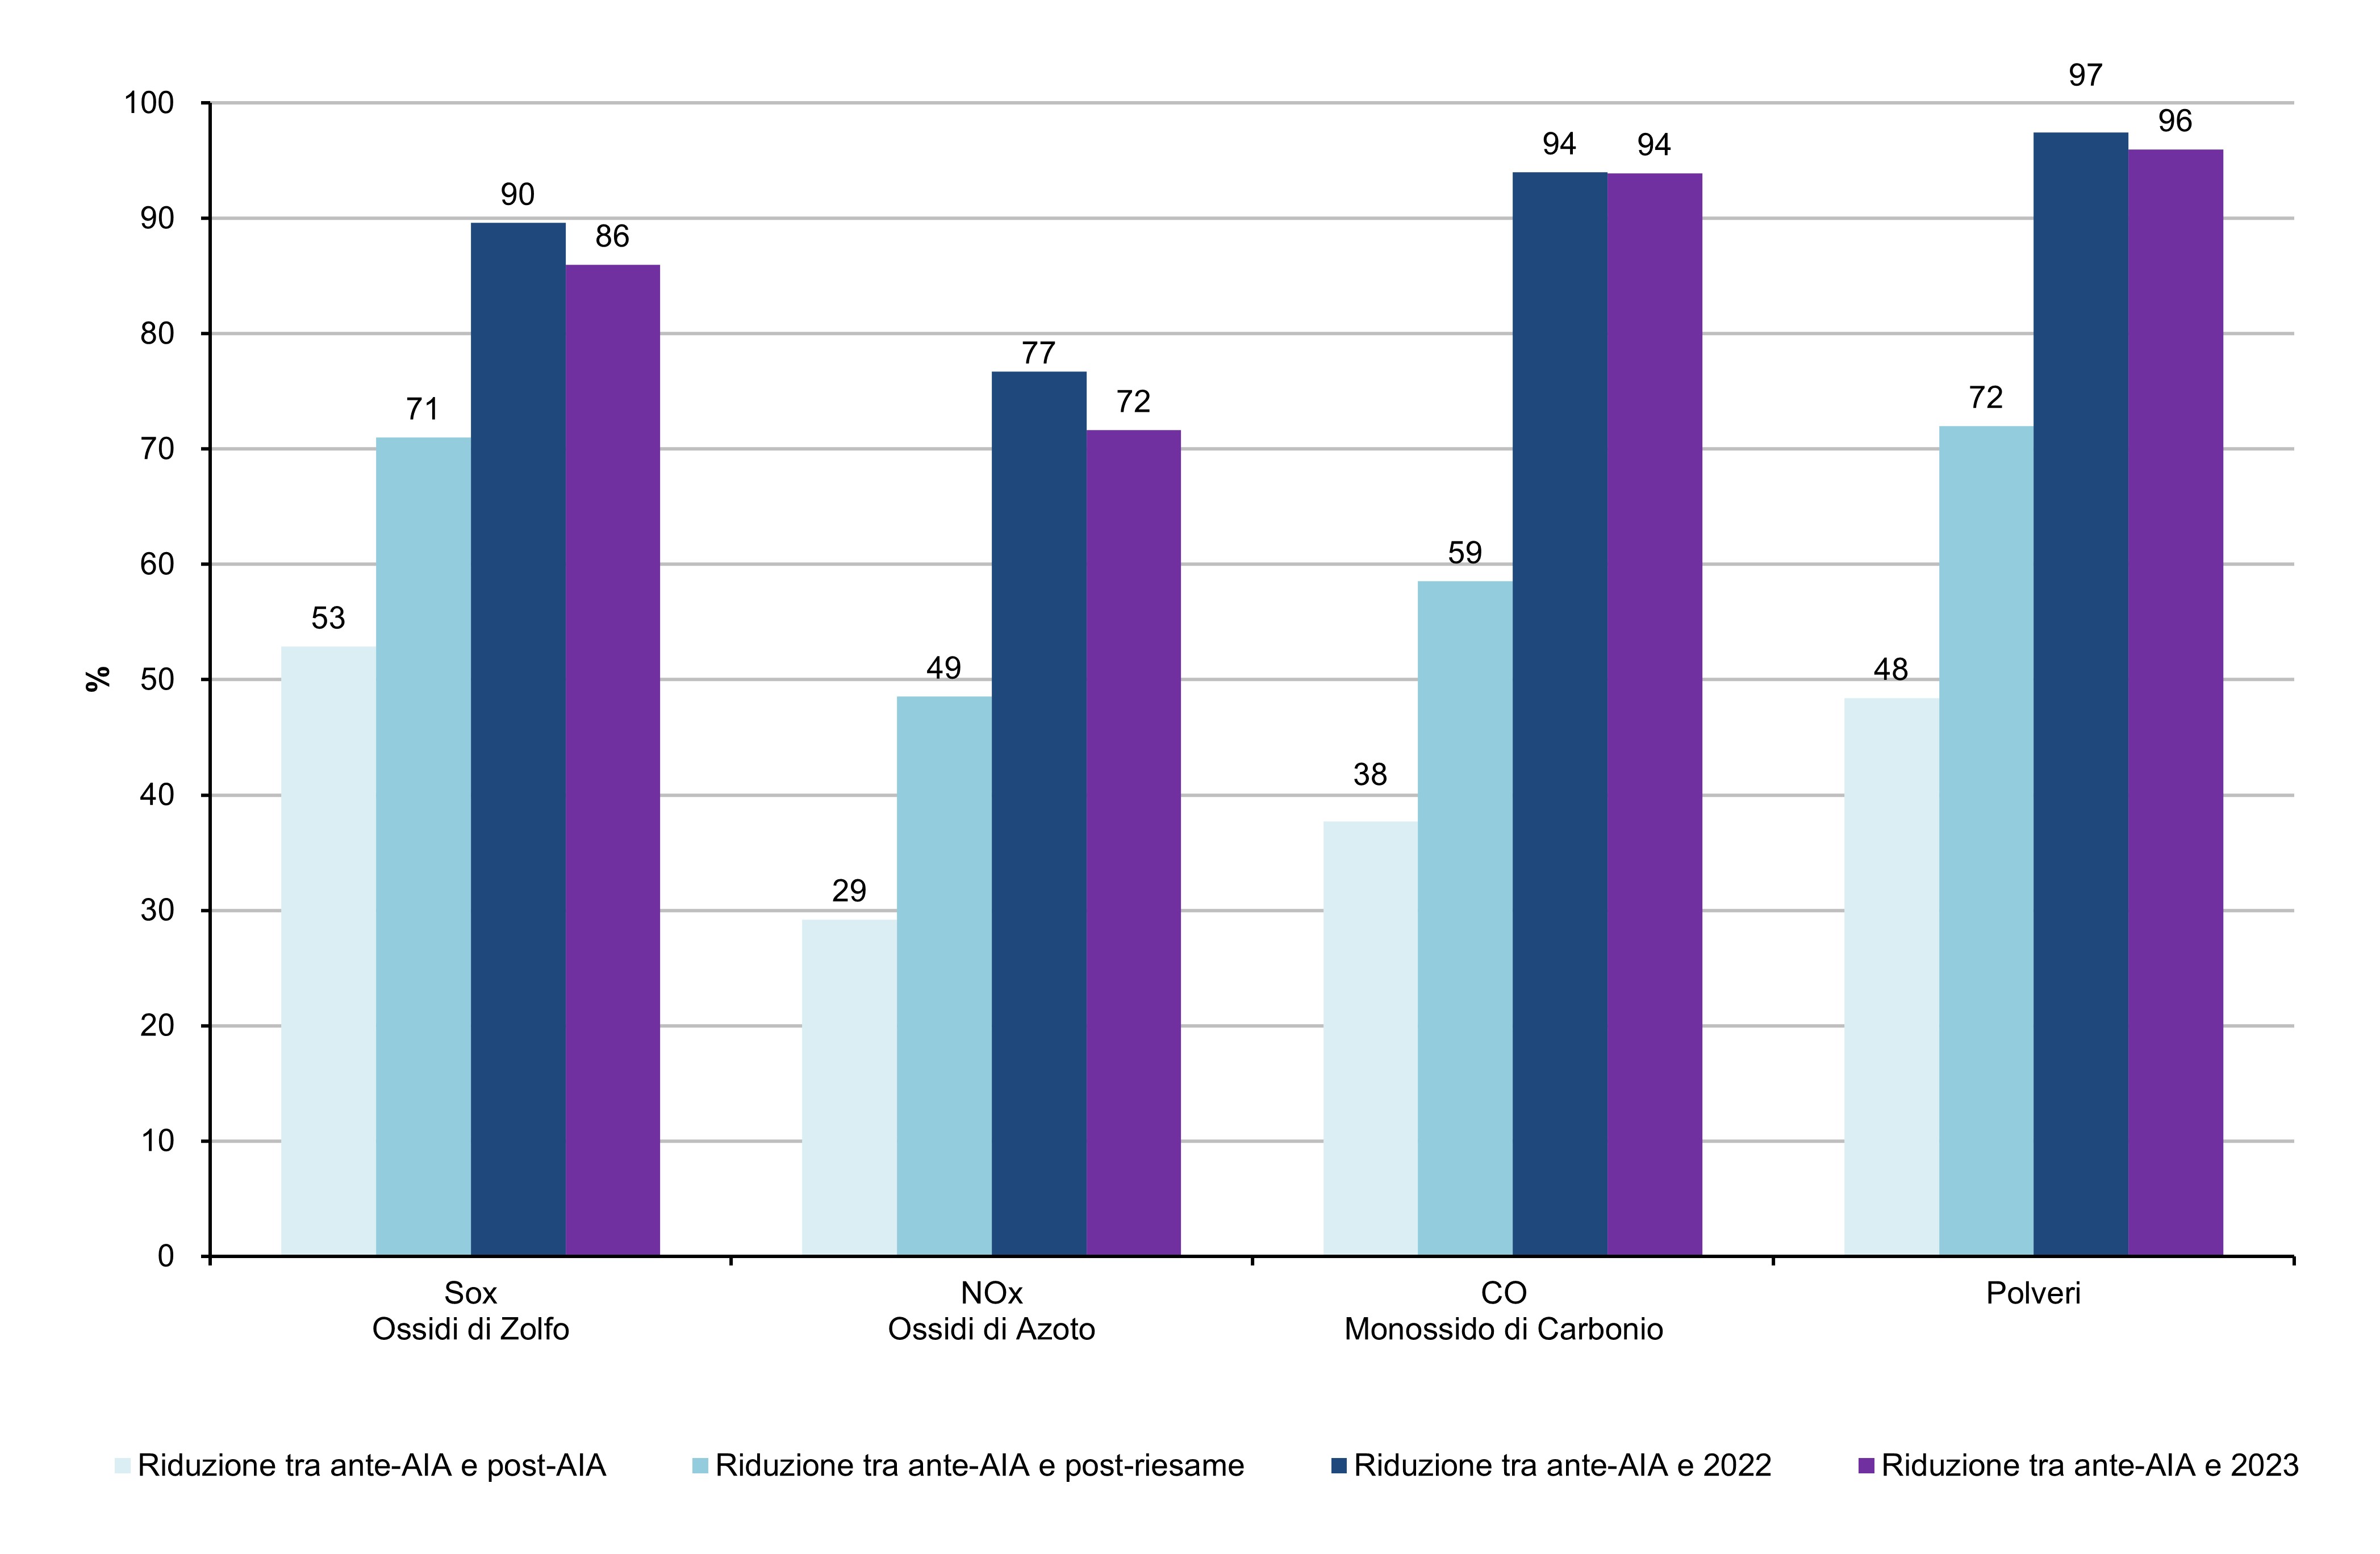
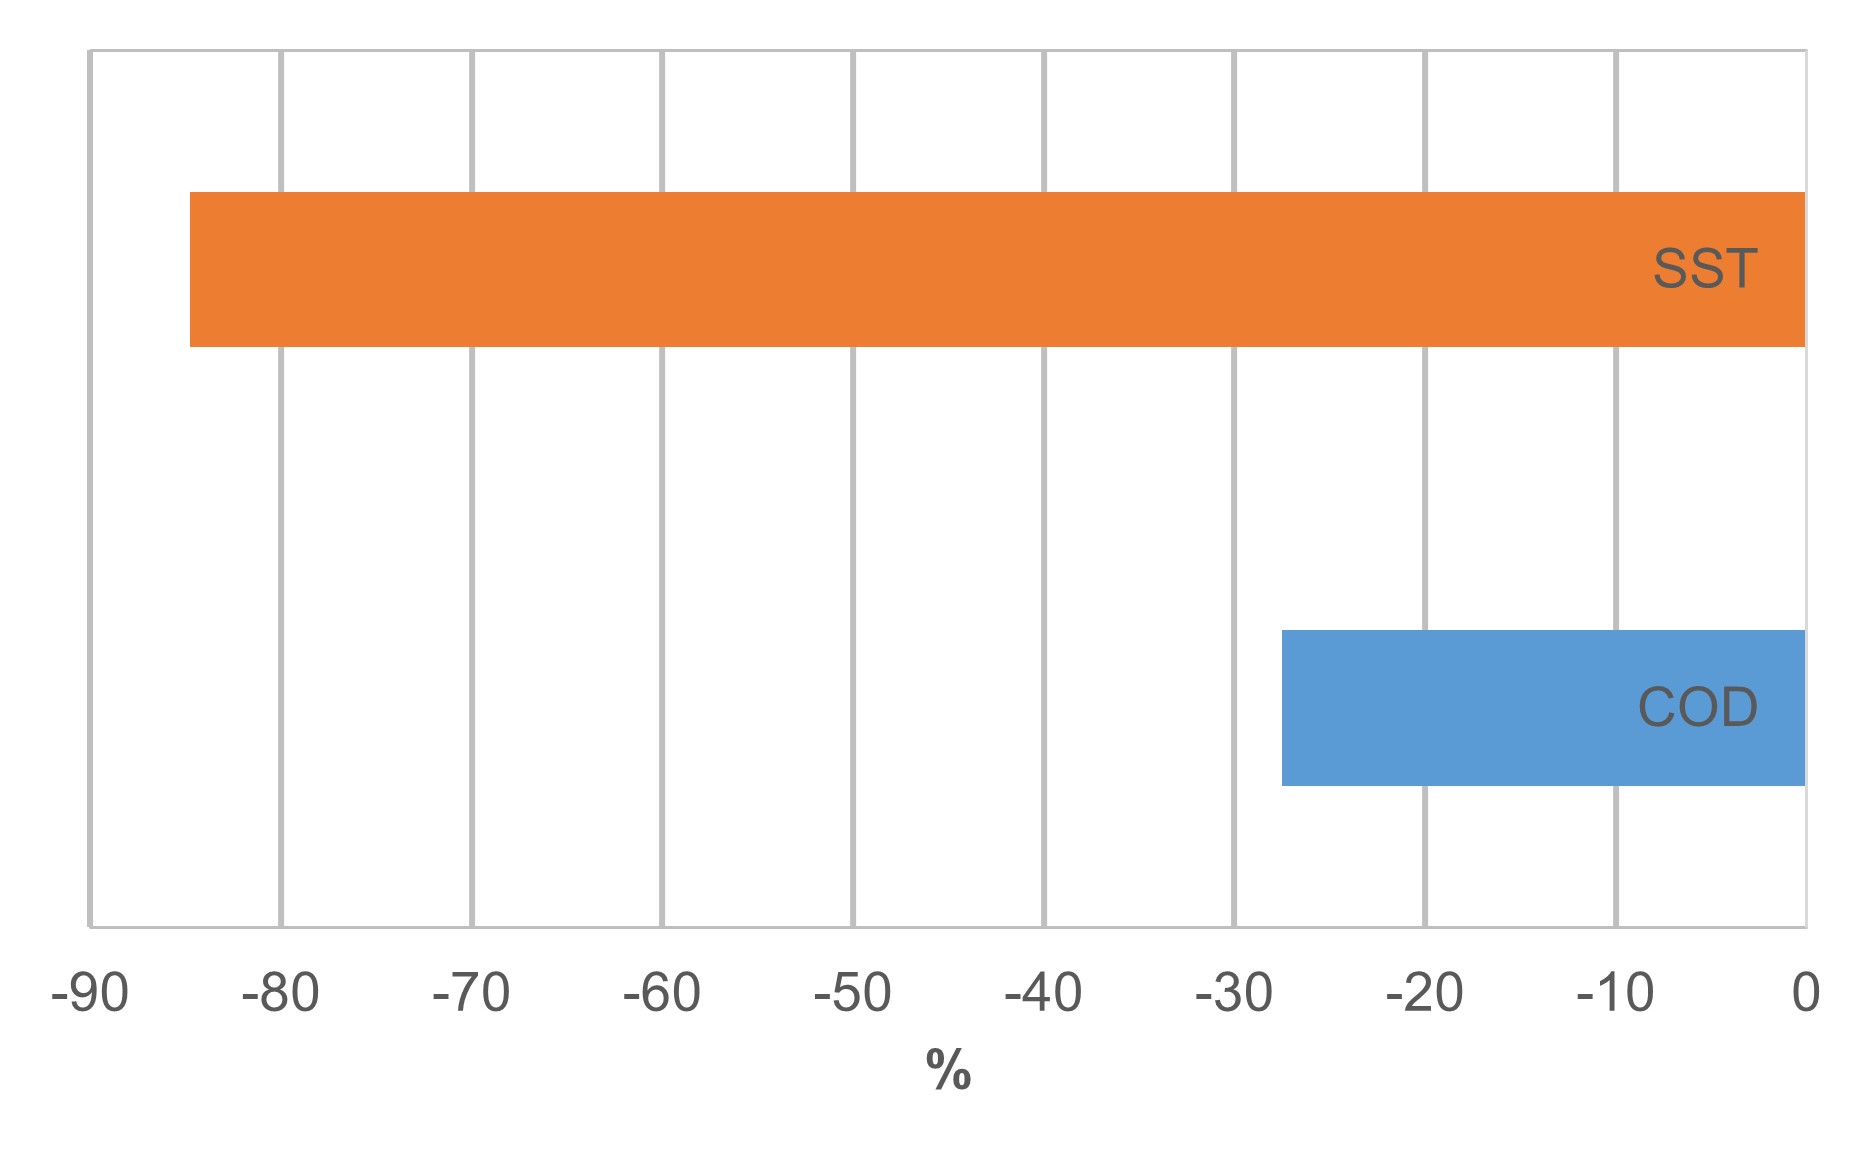
Air emissions of key pollutants (SOx, NOx, CO, and Particulates) have decreased by 86%, 72%, 94%, and 96%, respectively, from the pre-AIA period (2009-2010) to 2023 (Figure 2). Between 2011 and 2023, there was also a reduction in water emissions of COD and SST by 27.5% and 84.8%, respectively (Figure 3), while during the 2018-2023 period, total hydrocarbon emissions decreased by 26.8% and phenol emissions increased by 9.7% (Figure 4). Regarding waste recovery, between 2011 and 2023, there was a significant increase, rising from 26.7% to 42.7% (Figure 7). Overall, the trend can thus be considered positive.
| Data |
|---|
Headline
Table 1: Airborne emissions of pollutants (SOx, NOx, CO, Particulate Matter) from the refinery sector (2002 - 2023) and percentage reduction compared to the pre-AIA situation and post-AIA situation. Data source
ISPRA processing based on MASE data. Data legend
SOx: Sulfur Oxides; |
Headline
Table 2: Emissions (COD, SST, Phenols, HC "Total Hydrocarbons") in water from the refinery sector, normalized to crude oil processed. Data source
ISPRA processing of data from MASE Data legend
COD (Chemical Oxygen Demand); |
Headline
Table 3: Waste Generation in the Refinery Sector and Recovery Rate Data source
ISPRA Processing on MASE Data |
Thumbnail
Headline
Figure 1: Airborne Emissions of Pollutants (SOx, NOx, CO, Particulate Matter) from the Refinery Sector (2023) Data source
ISPRA Processing on MASE Data Data legend
SOx: Sulfur Oxides; |
Thumbnail
Headline
Figure 2: Percentage reduction of air-conveyed emissions of pollutants (SOx, NOx, CO, Dust) for the refinery sector (2023). Data source
ISPRA Processing on MASE Data Data legend
SOx: Sulfur Oxides; |
Thumbnail
Headline
Figure 7: Waste recovery index in the refinery sector. Data source
ISPRA Processing on MASE Data |
Thumbnail
Headline
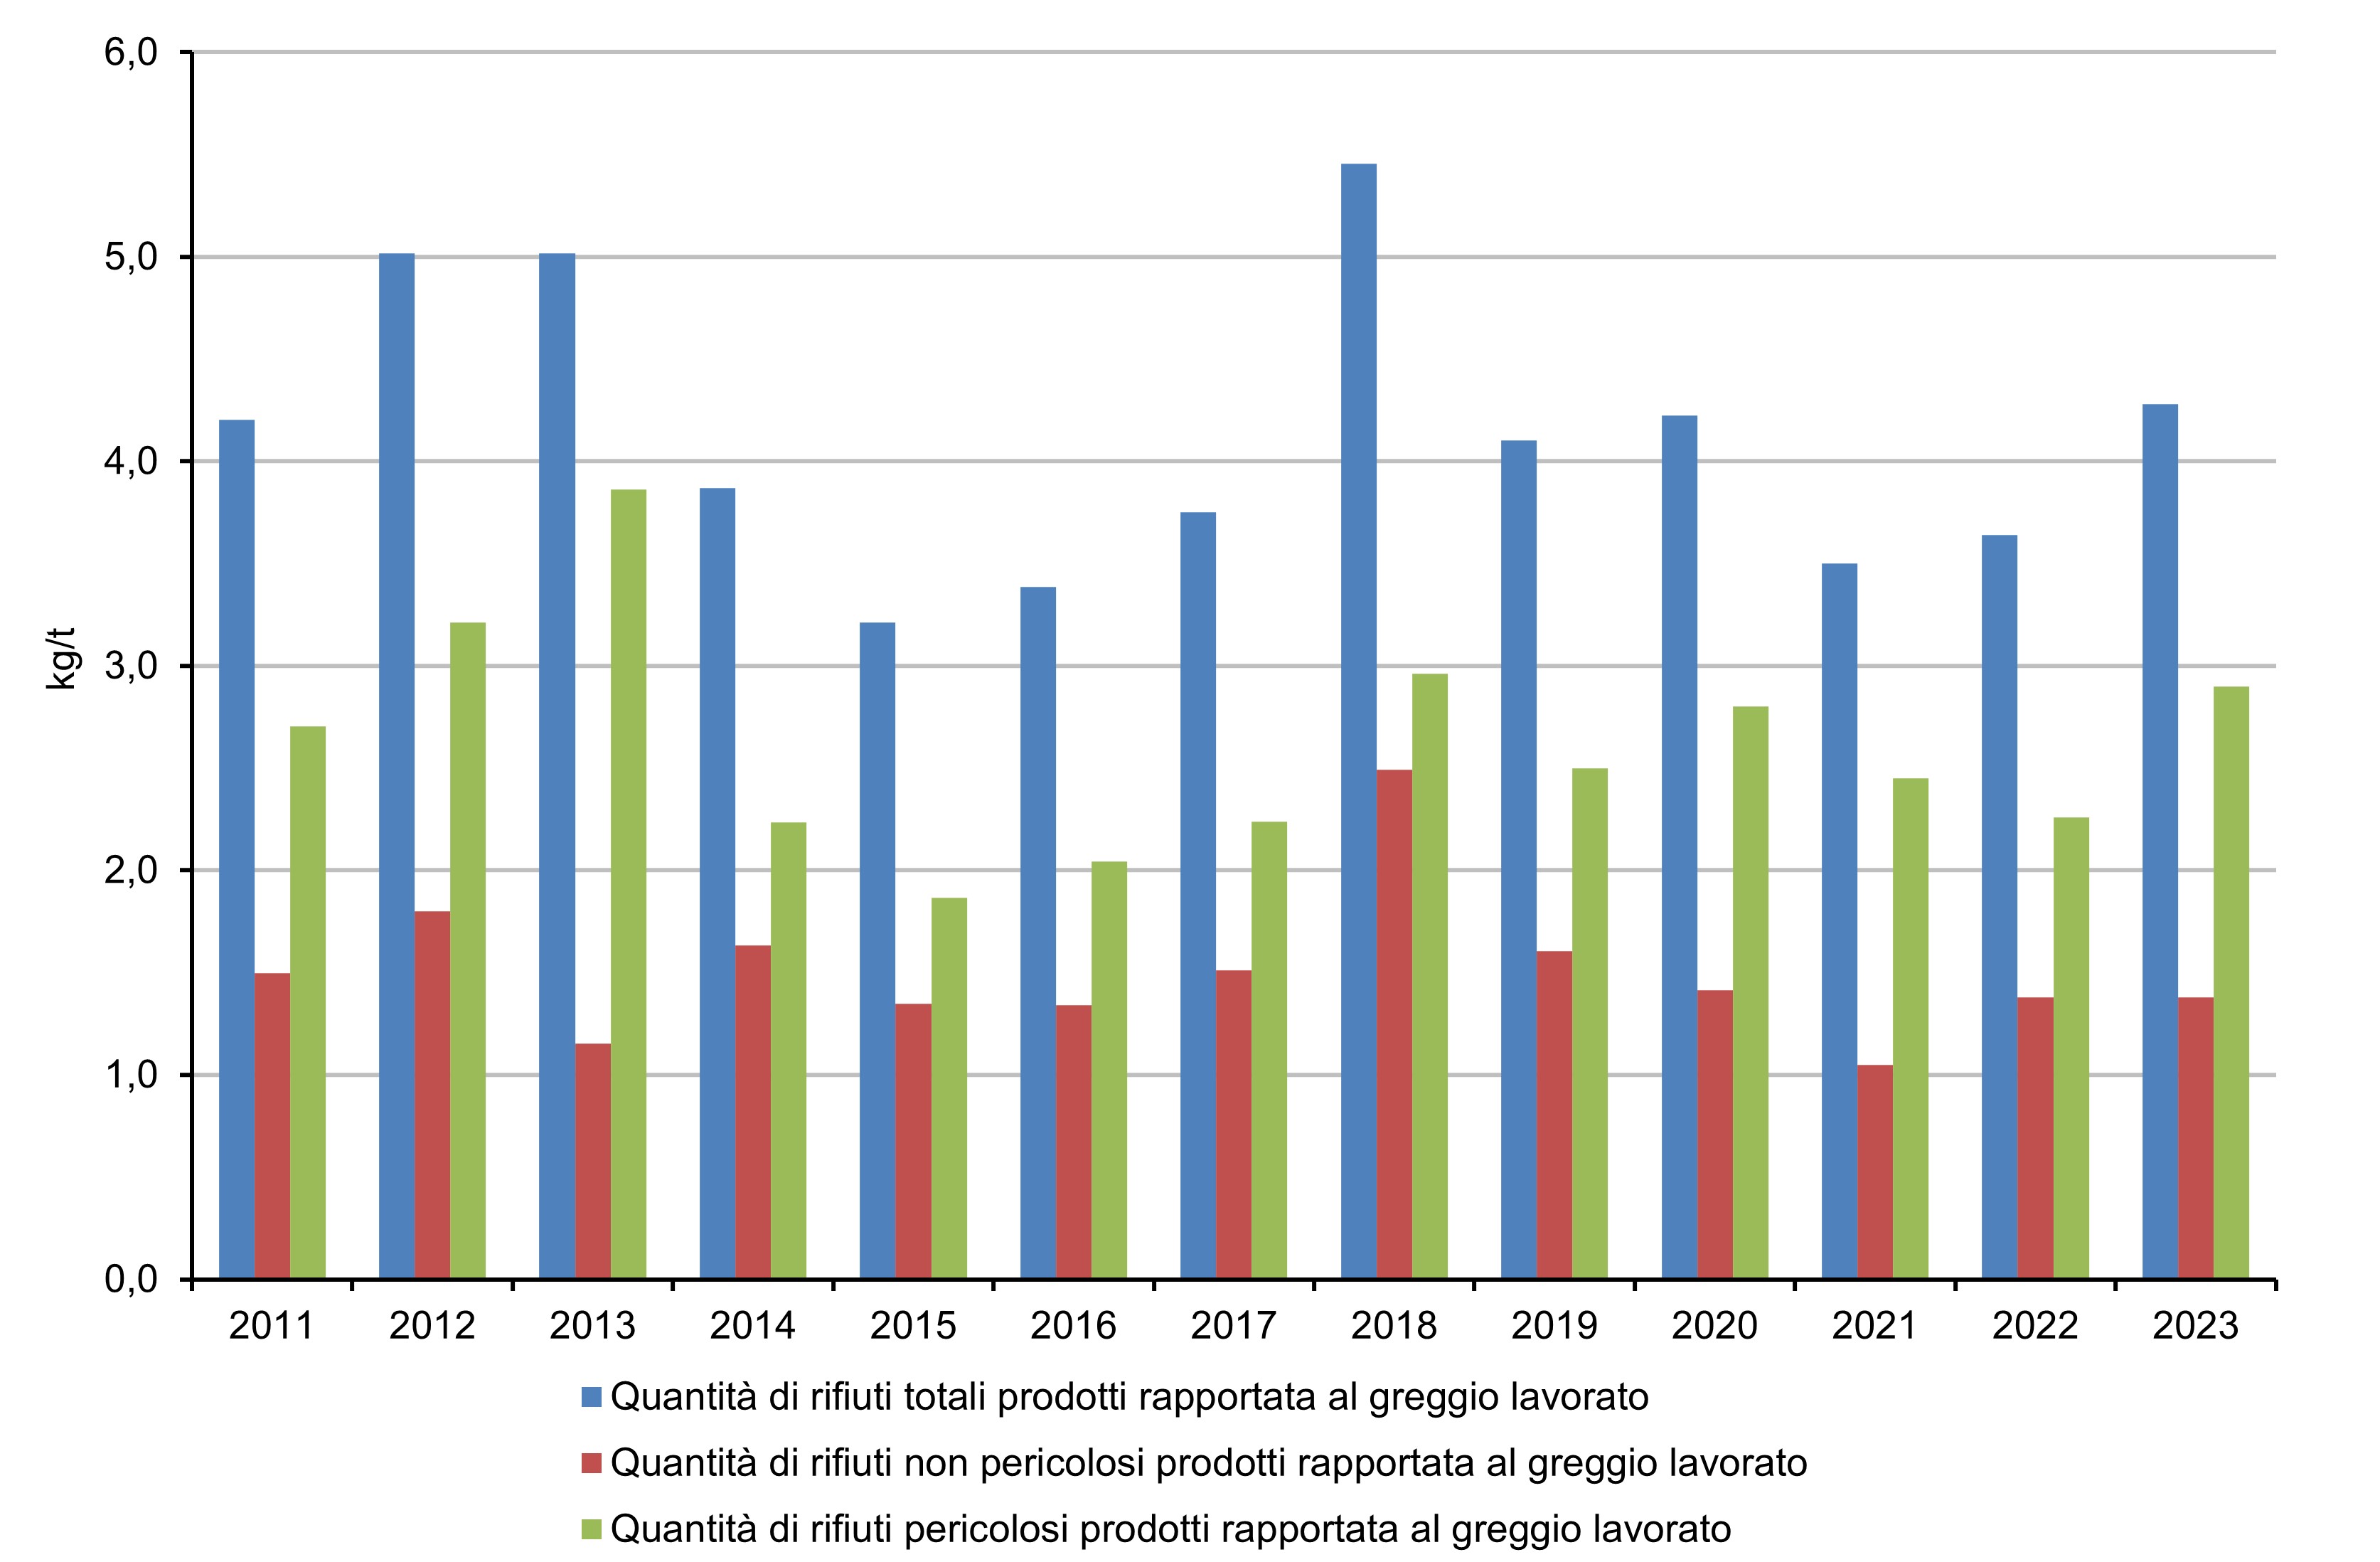
Figure 8: Specific waste production in the refinery sector, reported per tonne of crude oil processed. Data source
ISPRA Processing on MASE Data |
Thumbnail
Headline
Figure 3: Percentage variation between 2023 and 2011 of COD and SST emissions in water in the refinery sector, reported per tonne of crude oil processed. Data source
ISPRA Processing on MASE Data Data legend
COD (Chemical Oxygen Demand); |
Thumbnail
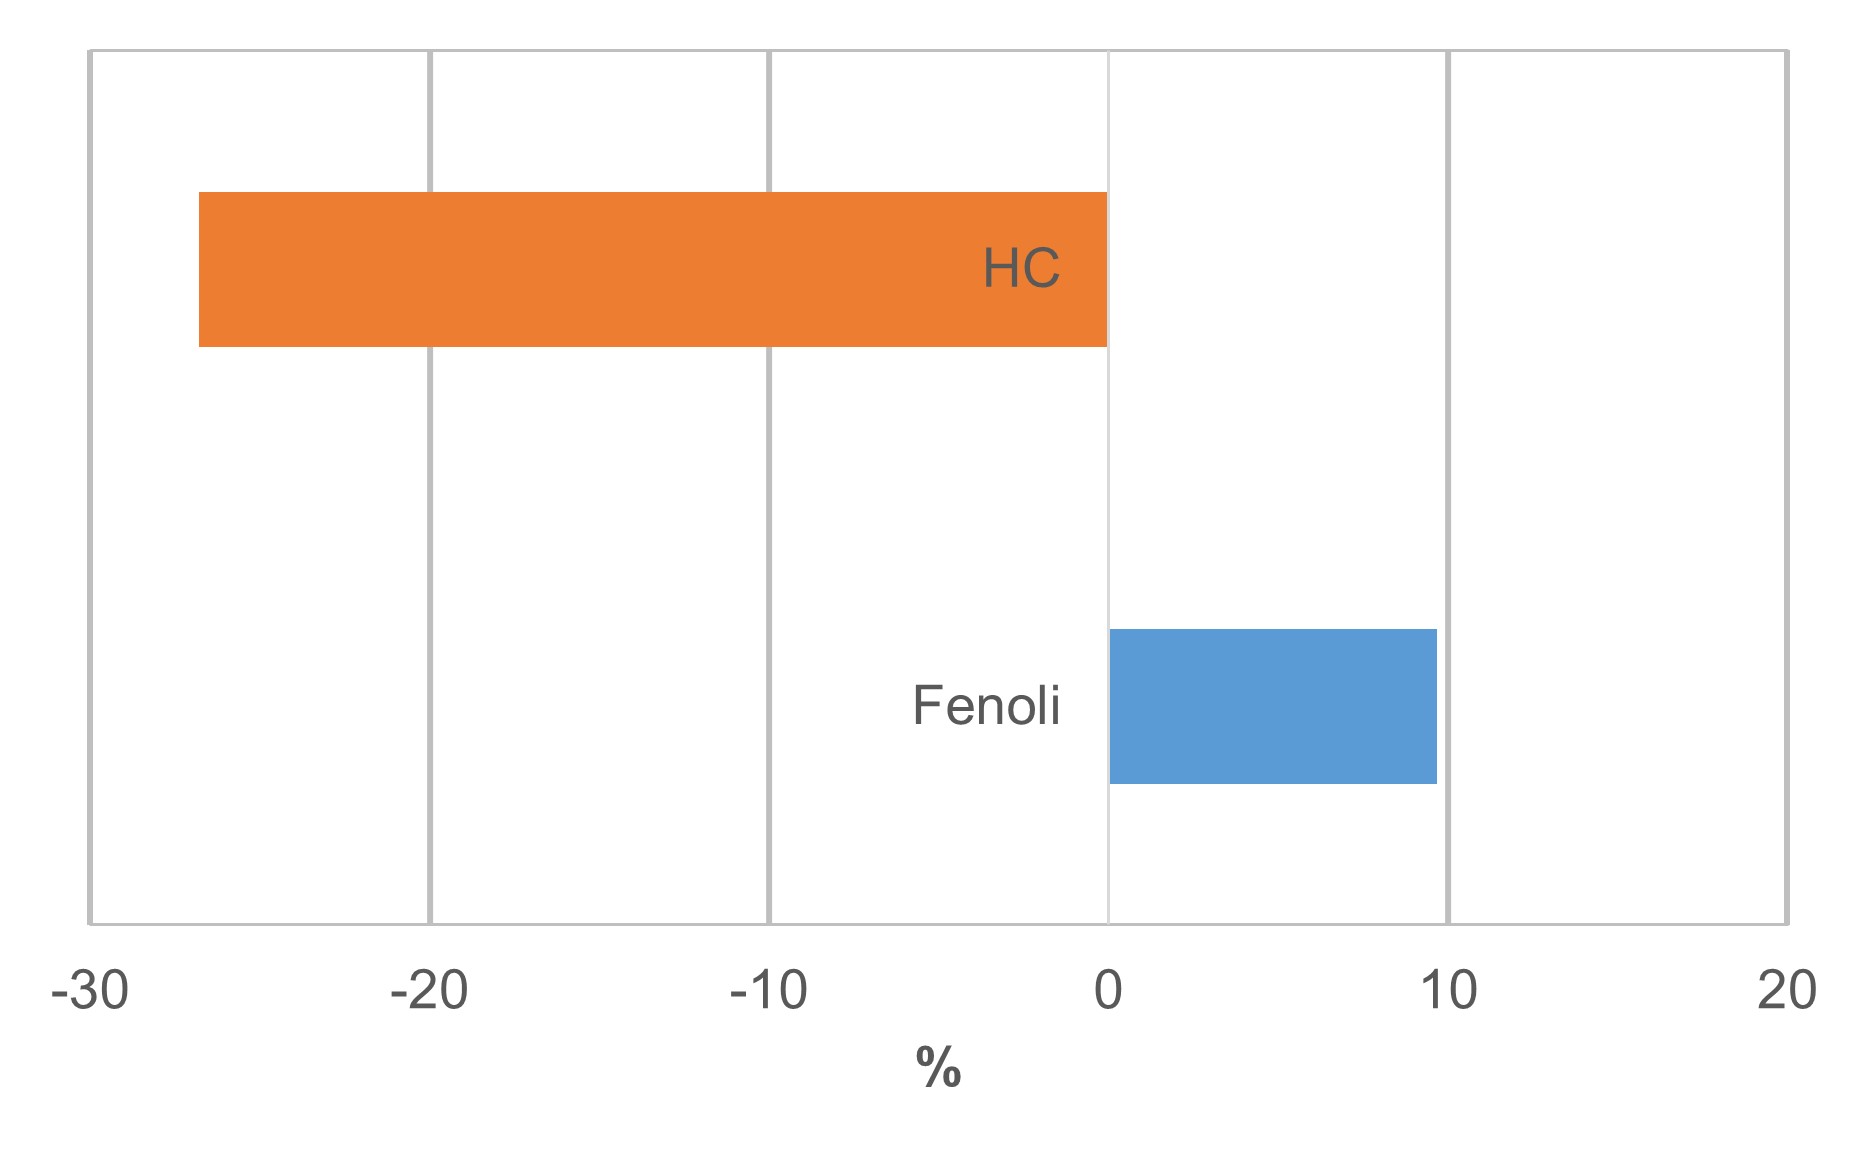
Headline
Figure 4: Percentage variation between 2023 and 2018 of Phenol and HC (Total Hydrocarbons) emissions in water in the refinery sector, normalized by crude oil processed. Data source
ISPRA Processing on MASE Data Data legend
Phenols; |
Thumbnail
Headline
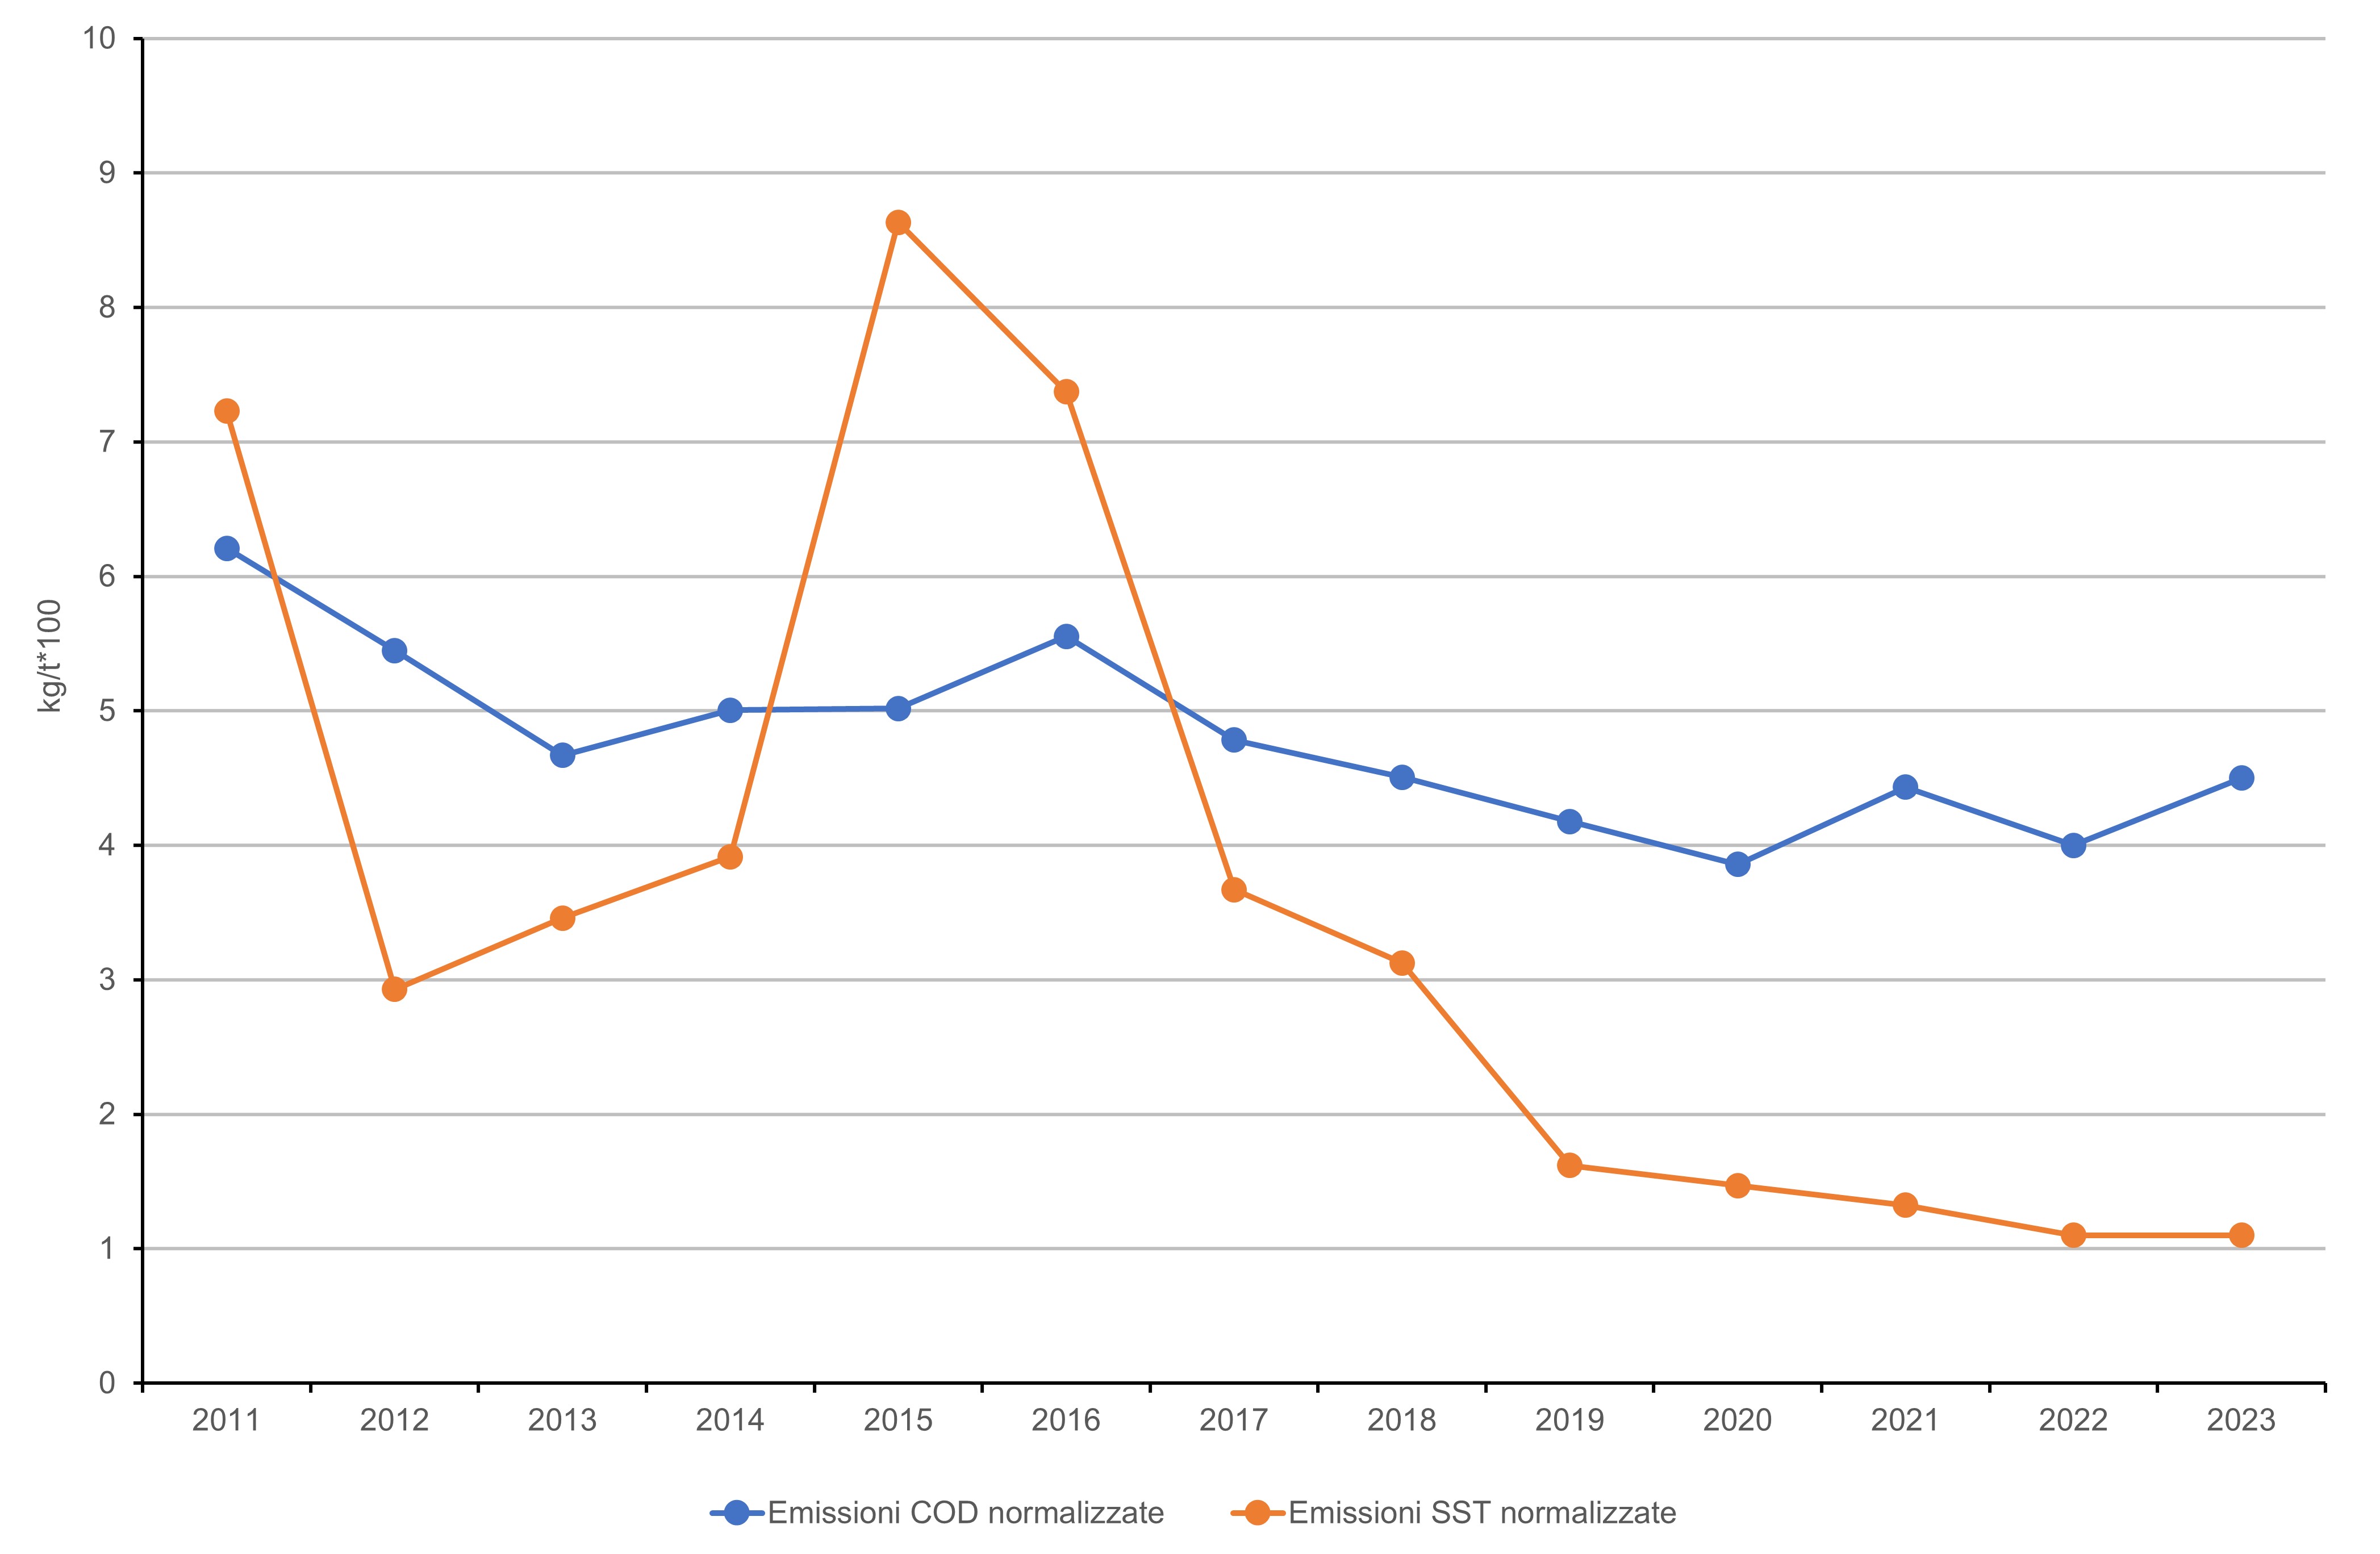
Figure 5: Trend of emissions (COD, SST) in water from the refinery sector, normalized to crude oil processed. Data source
ISPRA Processing on MASE Data Data legend
COD (Chemical Oxygen Demand); |
Thumbnail
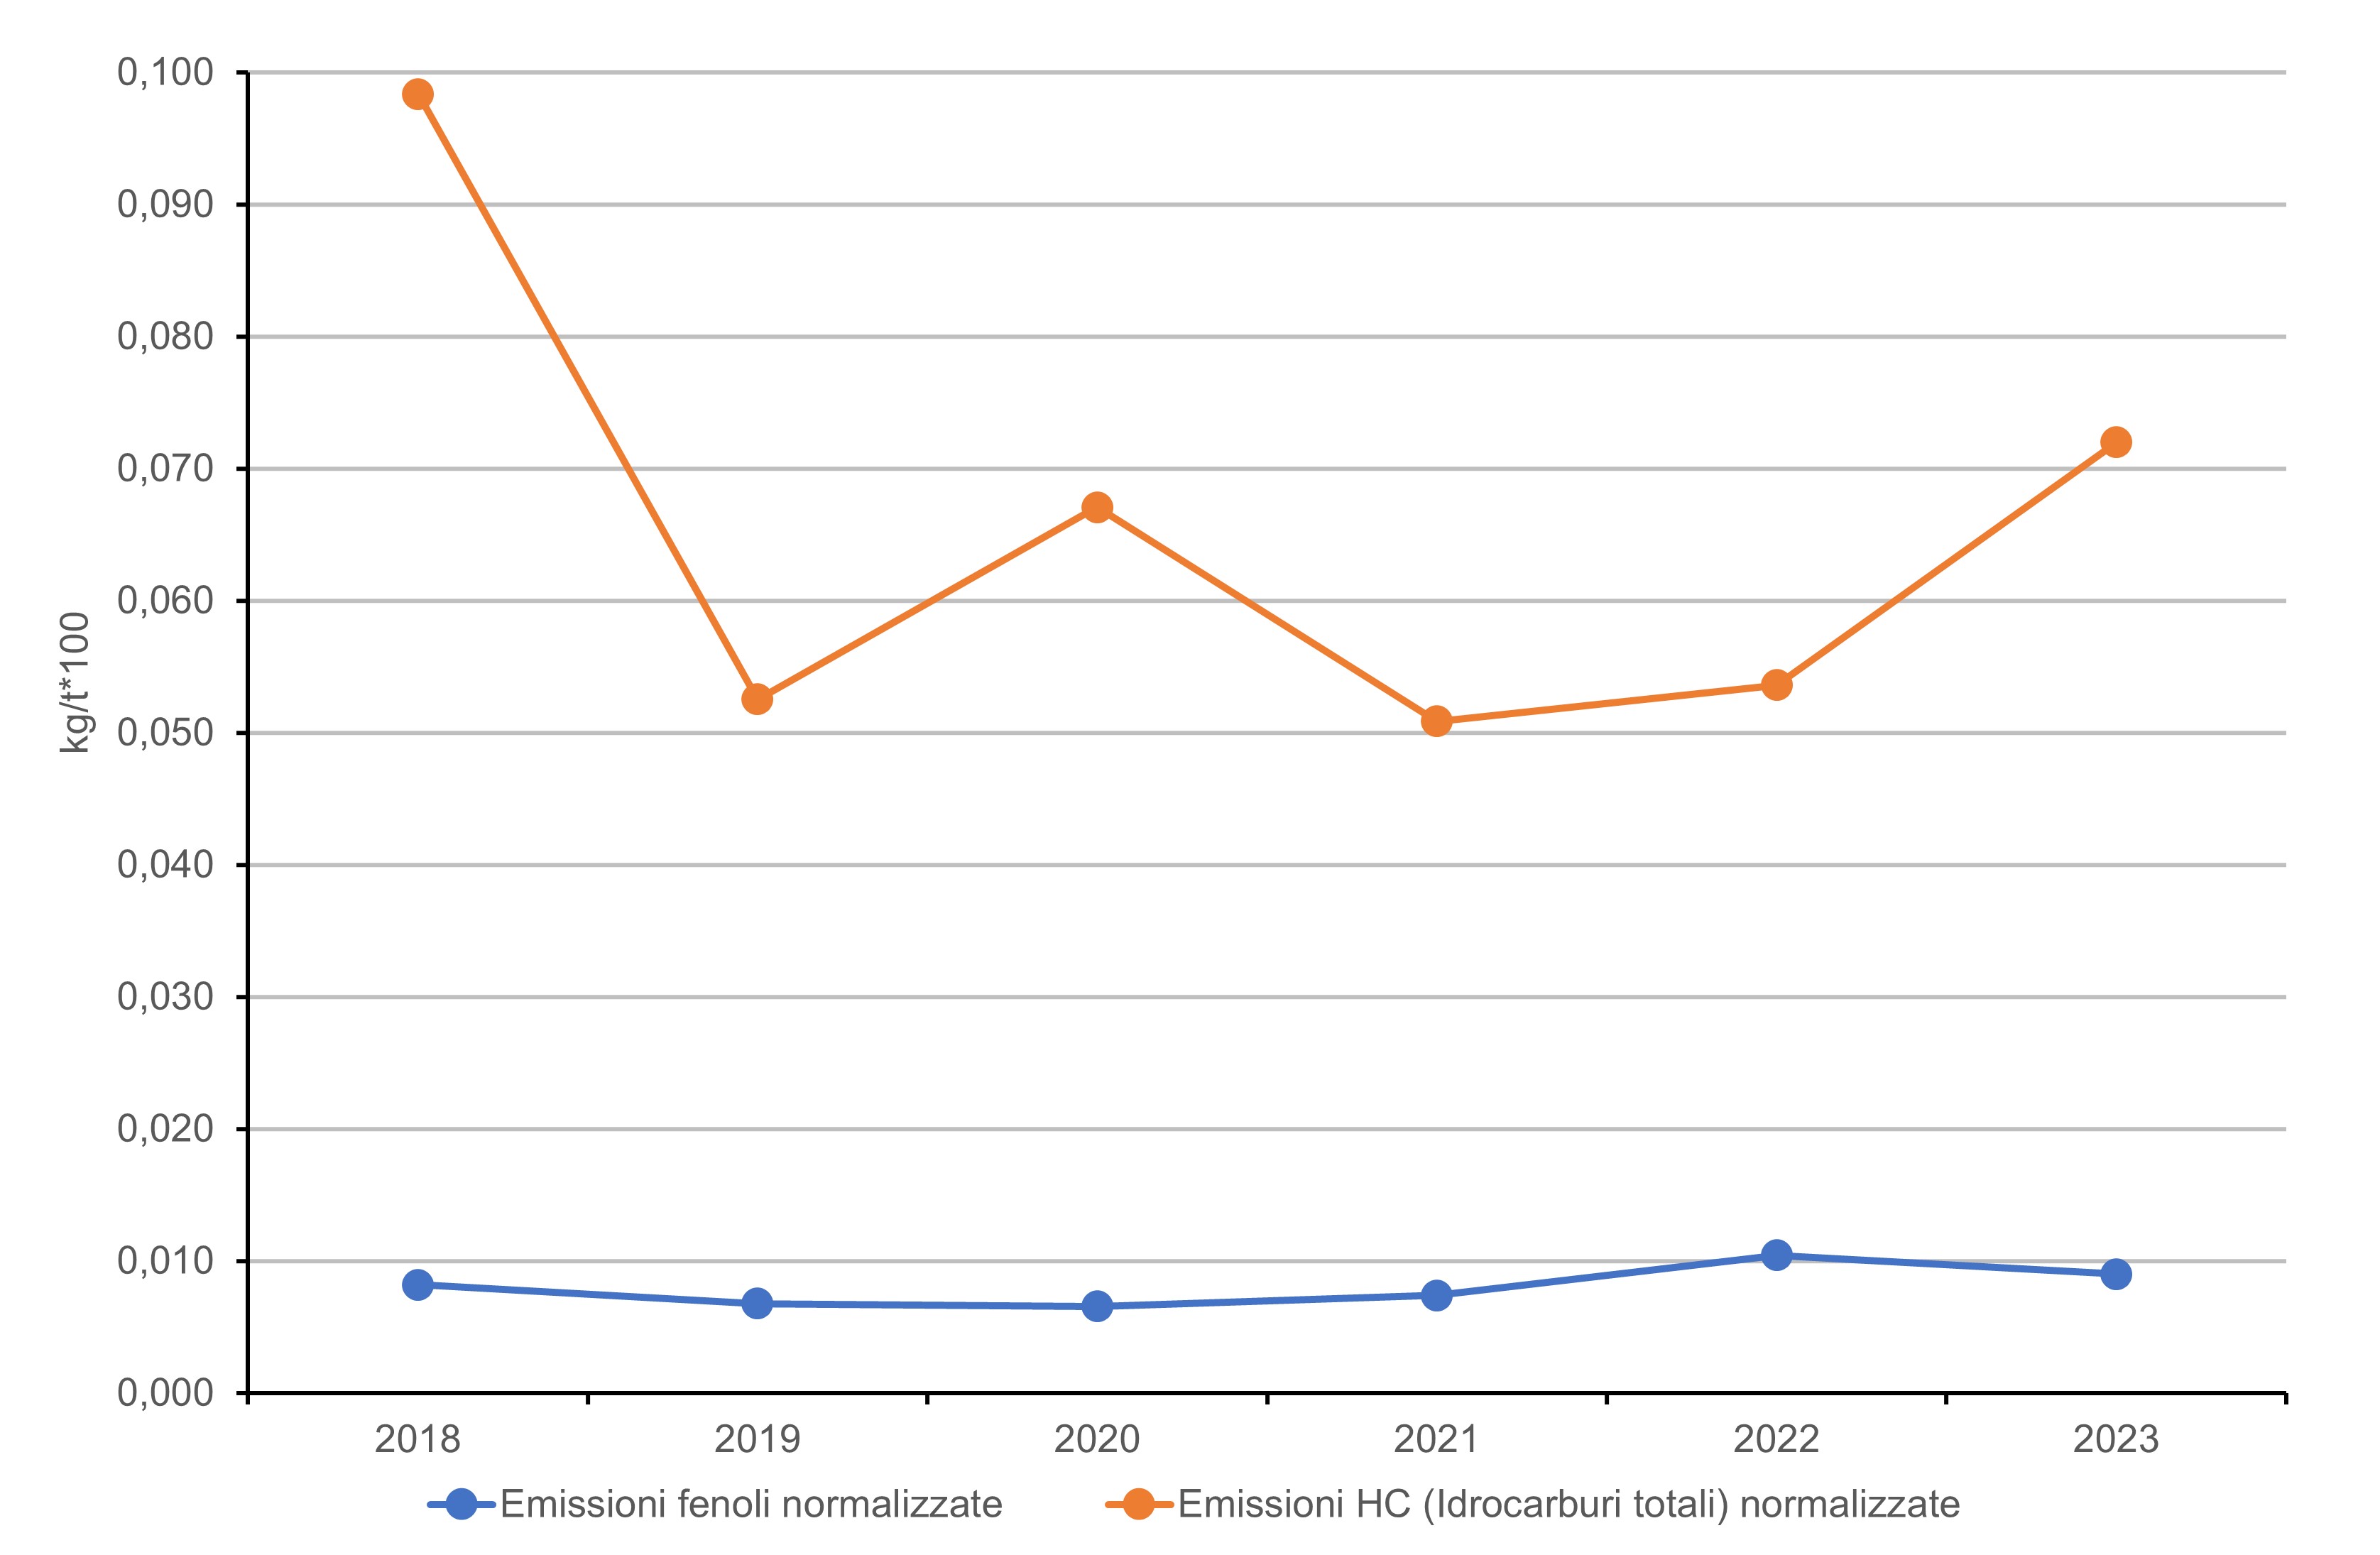
Headline
Figure 6: Trend of emissions (Phenols, HC "Total Hydrocarbons") in water from the refinery sector, normalized to crude oil processed. Data source
ISPRA Processing on MASE Data Data legend
Fenoli; |
With the issuance of the first AIA (Integrated Environmental Authorizations) provisions starting in 2011, compared to the previous authorizations, there was a significant reduction in atmospheric emissions of all considered macro-pollutants (a 53% reduction for SOx, 29% for NOx, 38% for CO, and 48% for Particulates). The alignment of the AIA with the “BAT Conclusions” from 2014 led to further reductions in emissions of all macro-pollutants compared to the post-AIA situation (a 38% reduction for SOx, 27% for NOx, 33% for CO, and 46% for Particulates) (Table 1). Overall, atmospheric emissions of SOx, NOx, CO, and Particulates from refineries subject to state AIA have significantly decreased over recent years, showing a reduction between the post-review situation and the pre-AIA situation (71% reduction for SOx, 49% for NOx, 59% for CO, and 72% for Particulates) (Figure 2), thanks to the application of BAT and the implementation of stricter limits in AIA provisions in accordance with BAT AEL (Associated Emission Limits). Furthermore, for 2023, the actual emissions, i.e., those measured by the operators, of the aforementioned macro-pollutants were significantly lower than the authorized values, showing a substantial reduction compared to the post-review situation (52% for SOx, 45% for NOx, 85% for CO, and 86% for Particulates), even more pronounced when compared to the pre-AIA values (86% for SOx, 72% for NOx, 94% for CO, and 96% for Particulates) (Figure 1).
Regarding water discharges, the changes between 2011 and 2023 for the emissions of COD and SST flows (Table 2 and Figure 3) show reductions in the masses of pollutants discharged, by 26.9% and 85.5%, respectively. A comparison of the flows of Phenols and Total Hydrocarbons emitted between 2018 and 2023 (Figure 4) highlights a reduction in Total Hydrocarbon emissions by 26.8% and an increase in Phenols by 9.7%, a parameter that, however, shows a decrease compared to the previous year.
To complement the data on the comparison between emission performances of 2011 and 2023, Figure 5 shows normalized emissions of COD and SST, i.e., related to crude oil processed for the entire observation period. For both pollutants, a reduction in the quantities emitted from 2017 onwards can be observed, due to the short and medium-term effects of the implementation of the comprehensive AIA review decrees during 2017-2018. The new AIA provisions, compared to the pre-existing VLE (Emission Limit Values) concentrations in the initial AIAs, incorporate new BAT-AELs (Best Available Techniques - Associated Emission Limits) imposed by the “BAT Conclusions,” which are more restrictive and expressed in terms of the annual average concentration. These provisions required further technical improvements in pollution control and management systems, including upgrading and/or extraordinary maintenance interventions at wastewater treatment plants in some refineries, thus allowing a reduction in the amounts of COD and SST discharged into water.
In analyzing Figure 6, it shows a steady trend for Phenols, with a slight increase in 2022 followed by a decrease in 2023. For Total Hydrocarbons, an increase is noted in 2023 compared to previous years, except in 2018 when it decreased by approximately 27%. In relation to these data, it should be considered that the quantities of Phenols and Total Hydrocarbons are always two orders of magnitude lower than those of COD and SST, so the differences in Phenols and Total Hydrocarbons over the years are minimal compared to those of the other two parameters. Again, it can be stated that the slight reduction is due to the short and medium-term effects of the implementation of the 2018 AIA review decrees, for which compliance is required within 6 months of the issuance of the AIA Decree.
The percentage of waste recovered compared to the total produced, between 2011 and 2023, increased from 26.7% in 2011 to 42.7% in 2023. The lowest value was recorded in 2013 with 20% (Table 3 and Figure 7). The production of total waste per ton of crude oil processed has slightly increased from 4.2 kg/t in 2011 to 4.3 kg/t in 2023. Similarly, the production of hazardous waste per ton of crude oil processed increased from 2.7 kg/t to 2.9 kg/t; however, the production of non-hazardous waste per ton of crude oil processed decreased from 1.5 kg/t to 1.4 kg/t (Table 3 and Figure 8). The positive trend of the waste recovery index, as part of a waste management policy outlined in the “BAT Conclusions,” has led to a reduction in landfill disposal and a potential reduction in the consumption of raw materials.