Maria Luisa Cassese, Filippo D'Ascola, Valeria Pesarino, Andrea Salmeri
The indicator provides a measure of coastal engineering interventions that directly alter geomorphology, coastal dynamics and often the natural character of long stretches of coast. The reference data for the calculation of the indicator concern three main aggregations within which the various types of works can be grouped: the port infrastructures, the coastal defense works built near the shore and the set of the other differently characterized structures, which however retain the peculiarity of being leaning against the coastline. The elaborations led to the creation of graphs useful to assess the situation in 2020 of the national coastal artificialization and the variation that took place with reference to the years 2000, 2006 and 2020. In general terms, there is an increase in artificialization ranging from 696 km in 2000, to 714 km in 2006, to 770 km in 2020 (about 8,300 km of national coast), mainly due to the growth of port works and coastal defense works grazing on the coast.
The data for the development of the indicator are related to the presence along the coast of the various types of anthropic works, such as: port works, coastal defense, filled, bathing beaches, piers, sea walks, hydraulic works, etc. The port works, with the construction of piers, forane dams and docks determine an evident morphological deformation of the coasts. The coastal defense works grazing to protect road infrastructures and homes threatened by coastal erosion and storm surges, represent a defense intervention, often built in emergency, to secure roads, railways or artifacts; it is a technique of defense of the coasts rather widespread in Italy, to contain the most serious phenomena of coastal erosion. All other works characterized differently such as, for example, those related to the activities of fruition (bathing forms, piers, sea walks, etc.) and grazing to the coast, represent a not insignificant portion of artificialization. It also considers the presence of further works, such as: brushes, cliffs, arms, mixed and filled works that, in their parts of connection to the coast, contribute to the phenomenon of anthropization. The indicator also provides a measure of the kilometers of artificialized coast relative to the regional level, for which only the most impacting components on the coast have been taken into account, namely the port works, and the works grazed at the coast, distinct in grazing coastal defense works (drop and on the wall) and other works grazing to the coast. The characterization of the types of anthropogenic elements was made as part of the updating of the ISPRA coastal information layers published on the Coasts Portal (https://sinacloud.isprambiente.it/portal/apps/sites//cost).
Measuring the degree of artificialization of the coast, to help evaluate how much direct human interventions that introduce stiffening elements can change the earth-sea interface, intervening on the dynamics of the coasts and causing serious effects on the physical and ecological balance of coastal habitats, in addition to potential natural causes (wave motion, tide, sea currents, etc.).
Legislative Decree no. 112 of 31 March 1998, in implementation of Chapter I of Law No. 59 of 15 March 1997, confers functions on the regions in the field of planning, planning, integrated management of coastal and coastal housing interventions (Article 89 paragraph 1 letter h), leaving the State with the tasks of national importance relating to the general guidelines and criteria for the defense of the coasts (Article 88 paragraph 1 letter aa). The L 88/2001, that to the article9 operate the clear separation, for the purposes of the structure of competences of the ports of regional and interregional importance, from those of national importance, etc. reserved to the state competence. The indicator is also functional to the definition of general guidelines and to reports on the state of implementation of the Recommendation of the European Parliament no. 2002/413/EC of 30/05/02.
F. D'Ascola, M. L. Cassese, N. Lugeri, V. Pesarino, A. Salmeri. 2022. From coastline to backshore: a Geodatabase for the monitoring and analysis of the state of the Italian coasts. In: L. Bonora, D. Carboni, M. De Vincenzi, G. Matteucci (edited by), Series of Proceeding of Nineth International Symposium “Monitoring of Mediterranean Coastal Areas. Problems and Measurement Techniques”. Livorno (Italy) June 2022. Published by Firenze University Press. In Press. F. D'Ascola, A.-L. Beck, M. L. Cassese, M. Jones, N. Lugeri, V. Pesarino, A. Salmeri, M. A. Taji. 2022. Monitoring of the evolution of “barene” borders and the safeguard of the Venice Lagoon morphology: a contribution from the Coastal Change from Space project results. In: L. Bonora, D. Carboni, M. De Vincenzi, G. Matteucci (edited by), Series of Proceeding of Nineth International Symposium “Monitoring of Mediterranean Coastal Areas. Problems and Measurement Techniques”. Livorno (Italy) June 2022. Published by Firenze University Press. In Press. MATTM-Regioni, 2018. Linee Guida per la Difesa della Costa dai fenomeni di Erosione e dagli effetti dei Cambiamenti climatici. Versione 2018 - Documento elaborato dal Tavolo Nazionale sull'Erosione Costiera MATTM-Regioni con il coordinamento tecnico di ISPRA, 305 pp
Periodic monitoring, five-yearly, uniform in representation scale and for territorial coverage, with updating of the standard in relation to the development of important innovative technologies.
ISPRA
The data on coastal defense works, processed by ISPRA, can be consulted on the ISPRA Coasts Portal at the link: https://sinacloud.isprambiente.it/portal/apps/sites//coste. In addition, in the Data section of the Coasts Portal it is possible to download the information layers for the entire national settling and for all the time series developed by ISPRA in geopakage format, which can be used through the main GIS tools.
National; Coastal Regions
2000, 2006, 2020
The reference data for the calculation of the indicator mainly concern port works and coastal defence works, which represent the elements of greater modification of the coastal morphological structure. The reference data for the calculation of the coastal occupation due to the port works is represented by the length (in km) of the fictitious section ("Coarmaal operation collaboration" Figure 1a) that connects the details of the port structure to the coast, in the points in which this is interrupted for the construction of the work; for the throwing and wall-mounted defense works ("Scouzstone defense works of the coast), the reference data for the calculation of the coast. A further component of artificialization is represented by those elements that develop at sea and that, although for a short stretch, connect to the coast line. The length (in km) of the fictitious stretch that connects the extremes of these works to the coast, defined from time to time as “colleague” (Figure 1b) or “confirmed link”, represents the reference data for the calculation of coastal occupation. Please refer to the comments section for a description of more detail. For the collection of data on which the indicator is based, a coastal-belt acquisition methodology based on photointerpretation has been defined. The reference sources used for the map survey of basic data are for 2020 satellite images made available on the Google Maps platforms, for 2006 and 2000 the mosaic of orthophotos respectively of the flight IT2006 and the flight IT2000, available on the National Cartographic Portal. The catalogue of the works is composed of all the artifacts made close to the bank visible, identified by use (port, beaches, piers, grazing coastal defense works, etc.). The indicator was developed through the sum of the kilometers of occupied coast (excluding the inland coasts in the lagoons, in rivers and artificial canals) at the national level. It was then calculated at the regional level both the sum of the kilometers of coast occupied only by the works grazing to the coast and the port works, and the percentage of the kilometers of coast occupied by these, compared to the length of the coast of each region (also in this case the coasts inside the lagoons, rivers and artificial canals were excluded). The results were presented in the form of graphs. The calculations were made on the data contained in the ISPRA coastal information layers for the years 2000, 2006 and 2020, updated and published on the Coasts Portal (https://sinacloud.isprambiente.it/portal/apps/sites//coste). The updating of the aforementioned information layers has left the general classification unchanged to allow a comparison between the time series.
At present, at national level, about 770 km of coastline on about 8,300 km of Italian coast, equal to 9.3%, are occupied by artificial works. It should also be noted that the stretches of coast most affected by human activities mainly concern only the low coast (about 5,700 km), the one generally more affected by human activities. Compared to this, the percentage of artificialization rises to 13.5%.
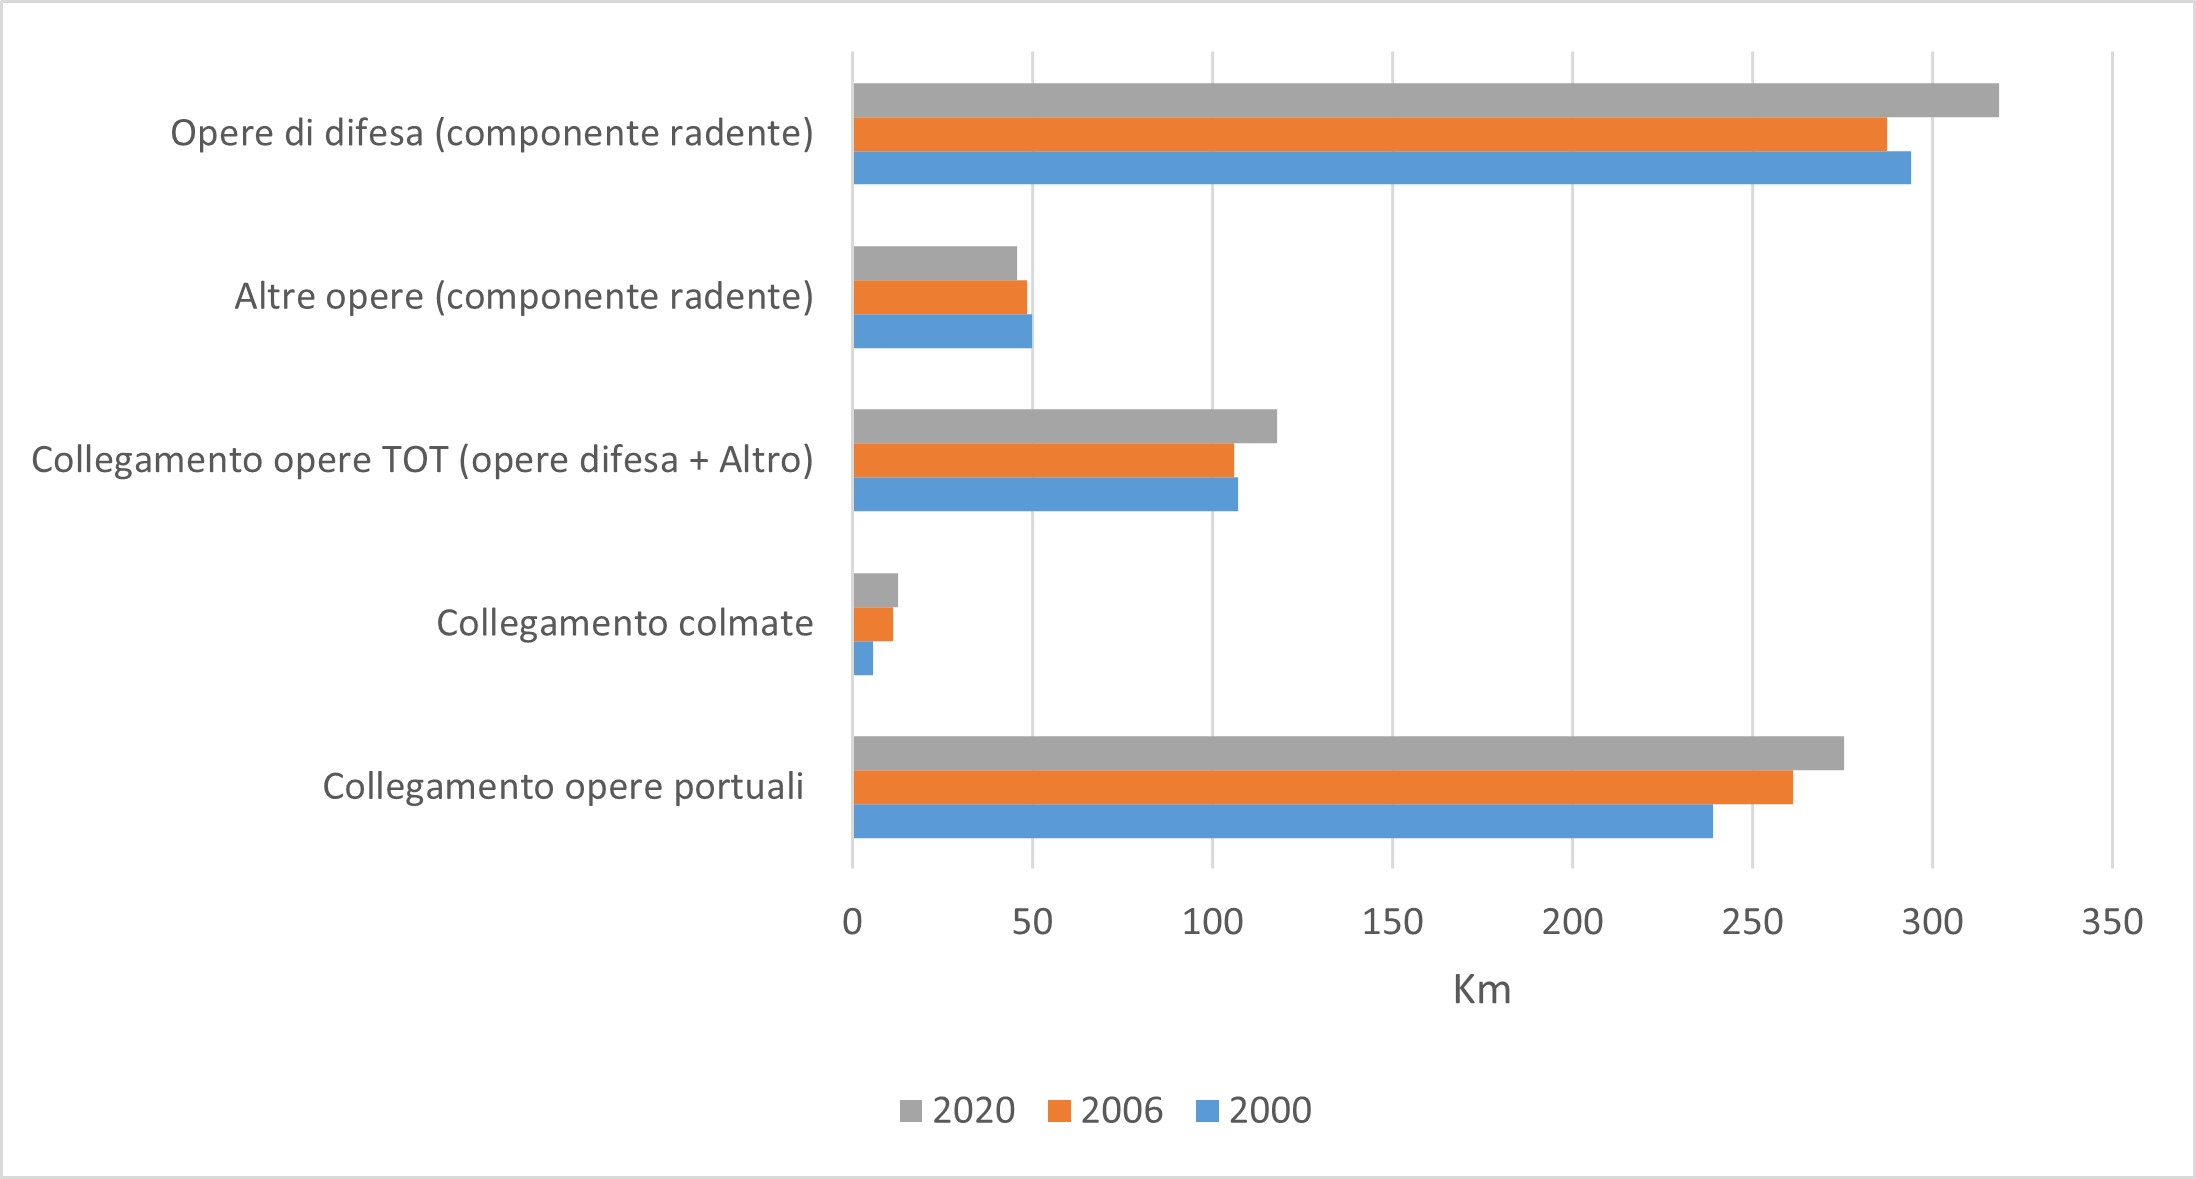
From 2000 to 2020 it goes from 696 km to 770 km of artificialized coast, with an increase of 10.6% and a consequent loss of 74 km of natural coast (Figure 3). It should also be emphasized that the overwhelming variables of artificialization are the grazing defense works and the port works.
| Allegati |
|---|
Thumbnail
Headline
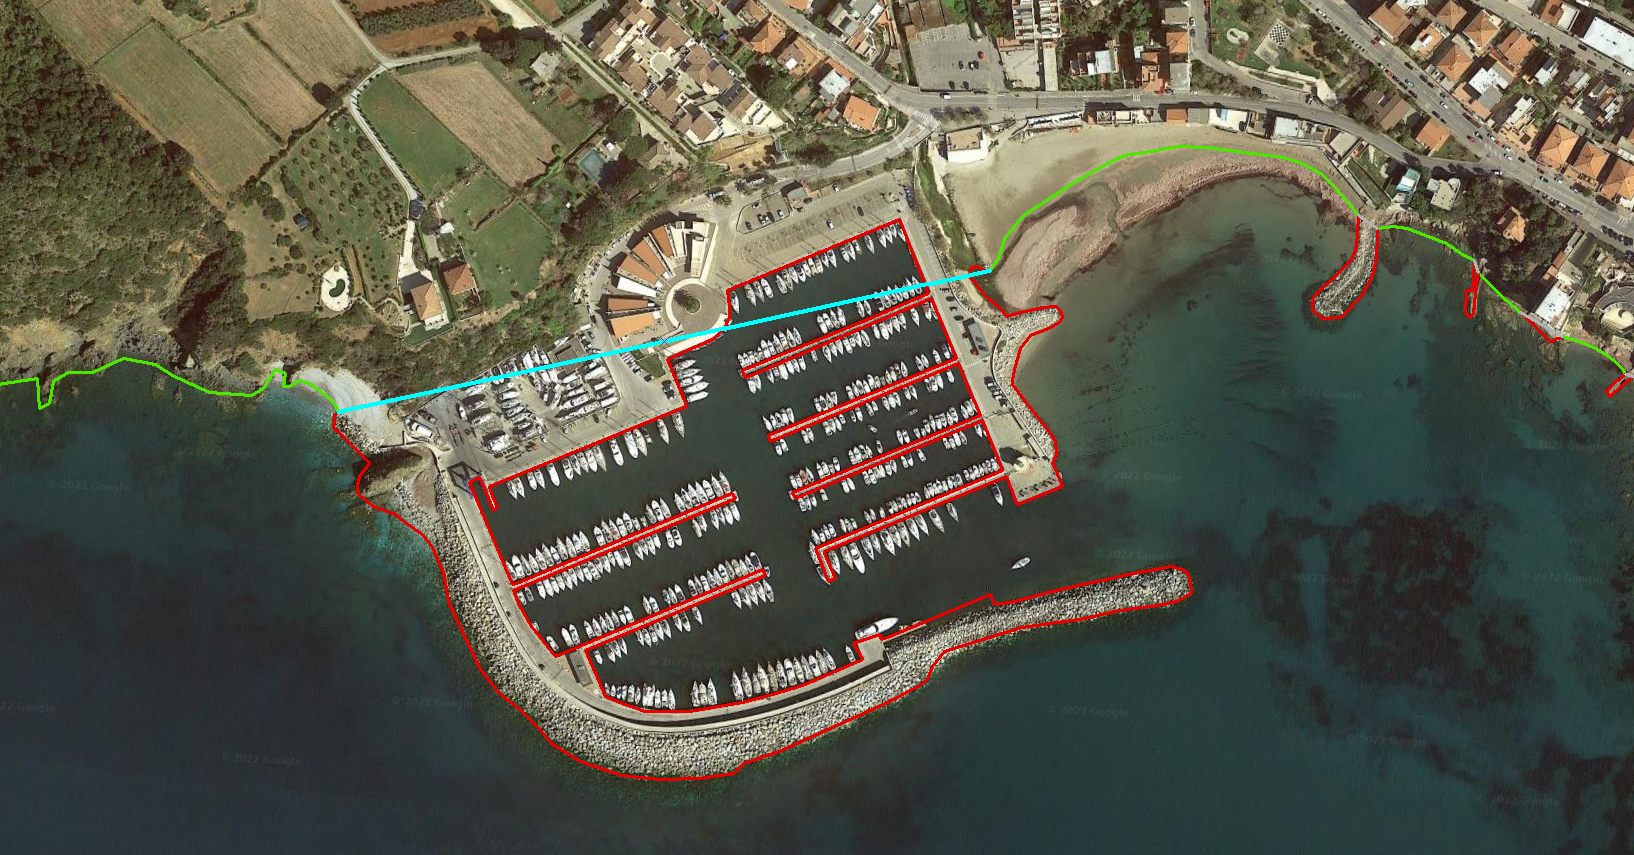
Figure 1a: Fictitious line “port work link” of the Marina of Salivoli (Tuscany) Data source
ISPRA |
Thumbnail
Headline
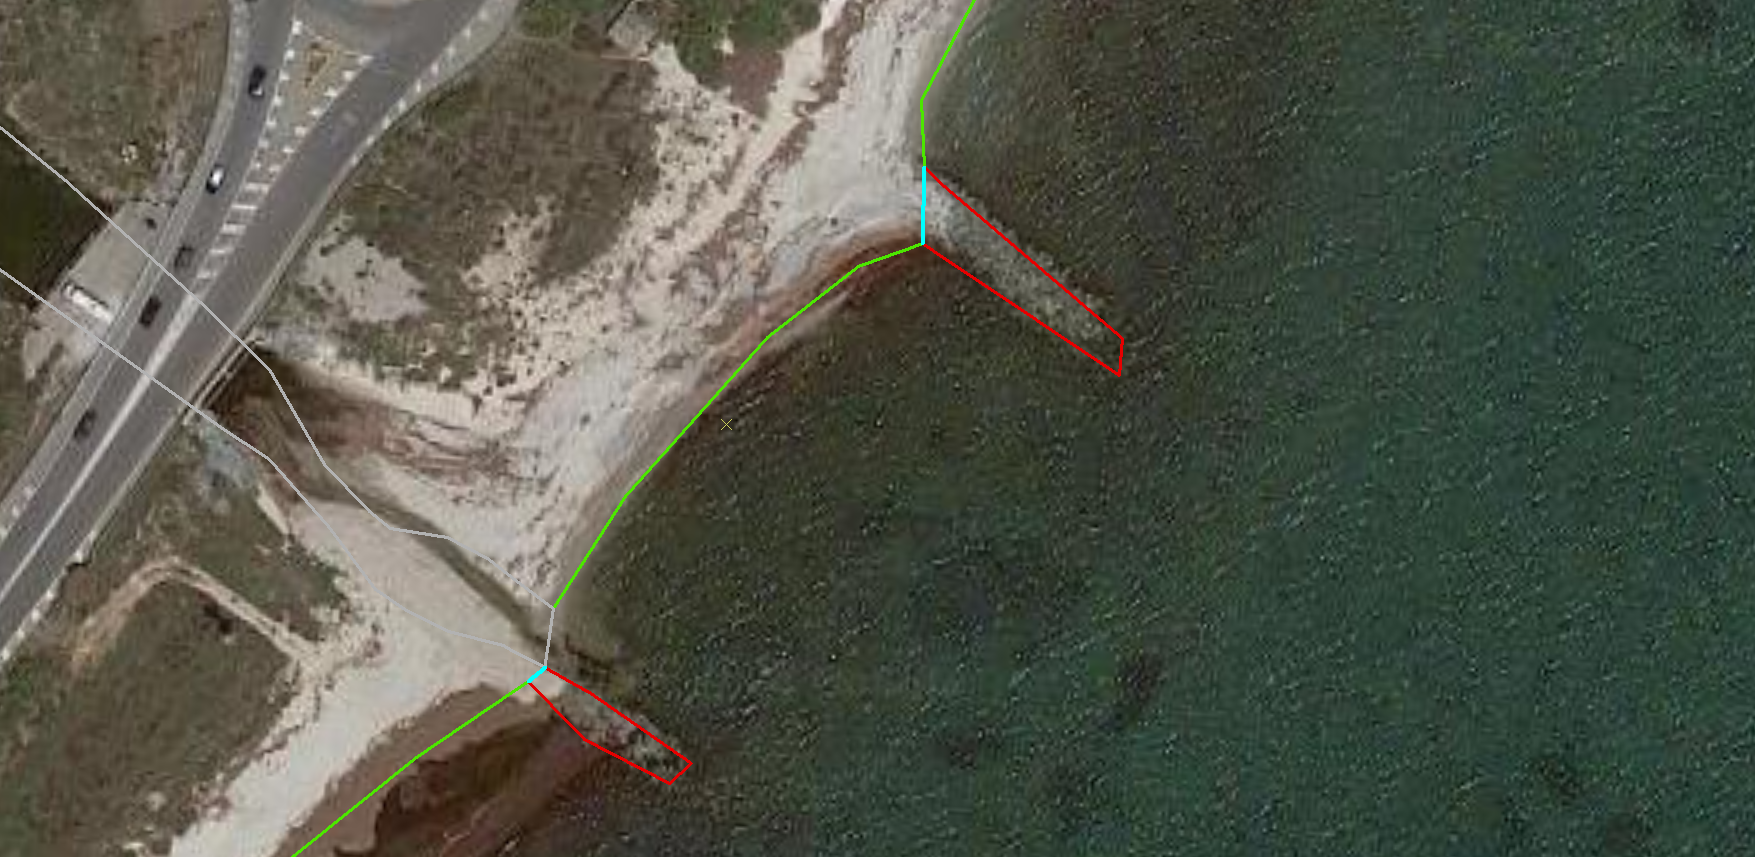
Figure 1b: Armed mouth (bottom) and orthogonal brush emerged (top) on the coastline in front of the Capoterra Pond (CA) Data source
ISPRA |
Thumbnail
Headline
Figure 2: Artificialized Coast Distribution (2020) Data source
ISPRA |
Thumbnail
Headline
Figure 3: Variation of the artificialized coast in the years 2000, 2006, 2020 Data source
ISPRA |
Thumbnail
Headline
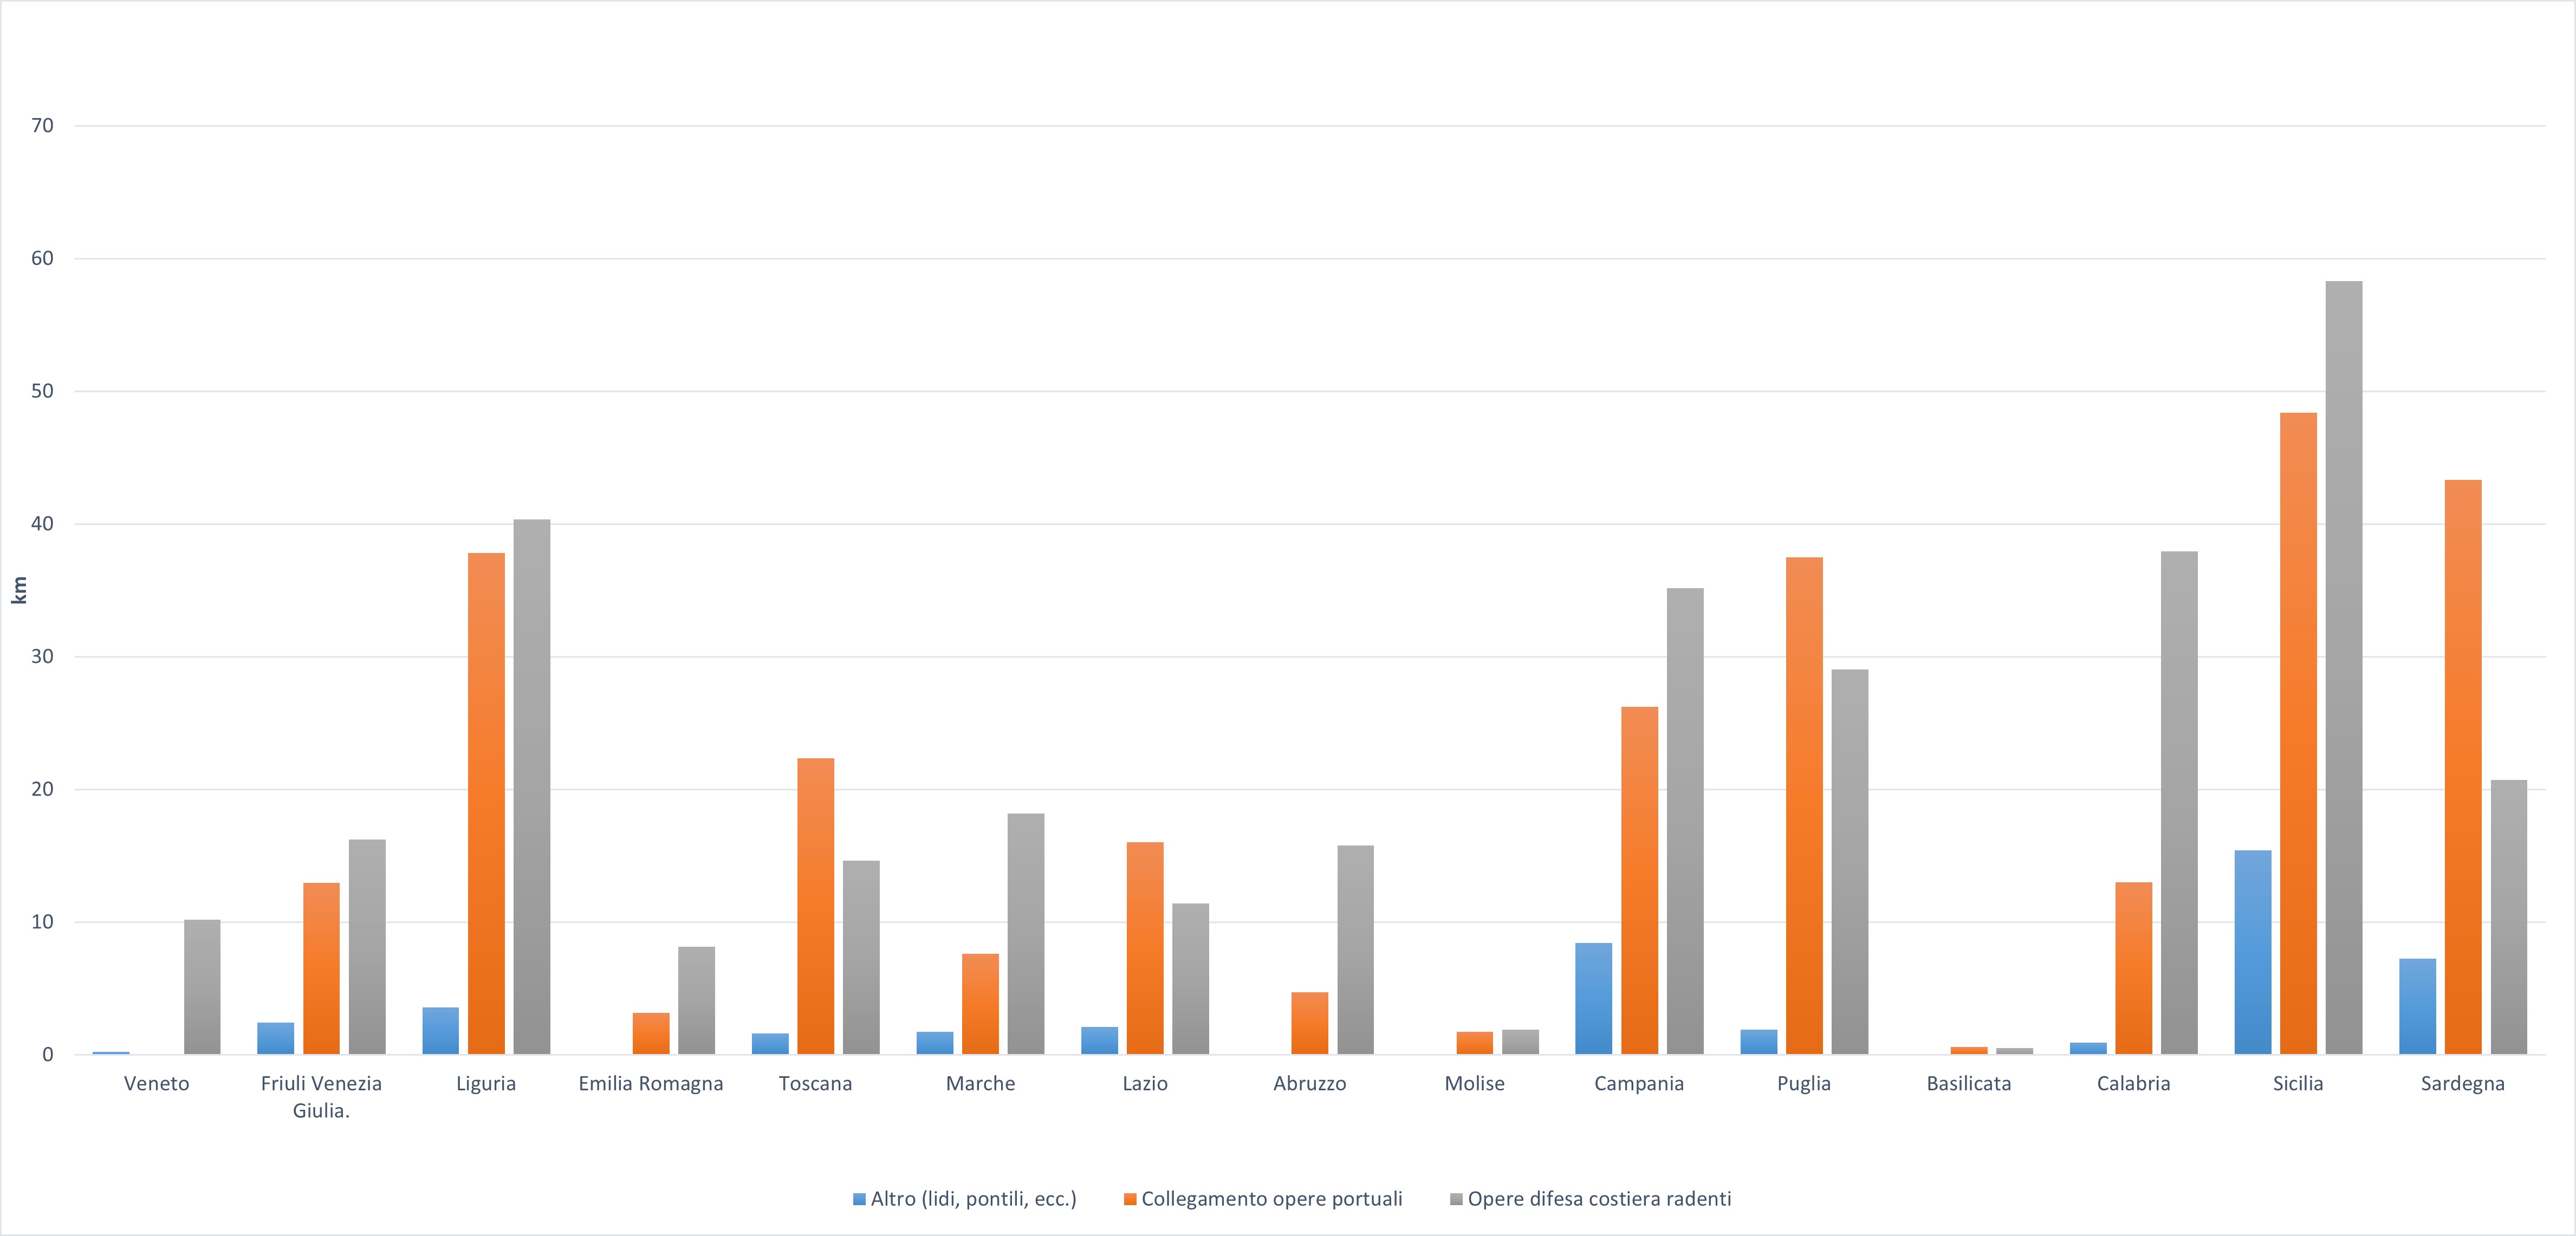
Figure 4: Main elements of artificialized coast by region (2020) Data source
ISPRA |
Thumbnail
Headline
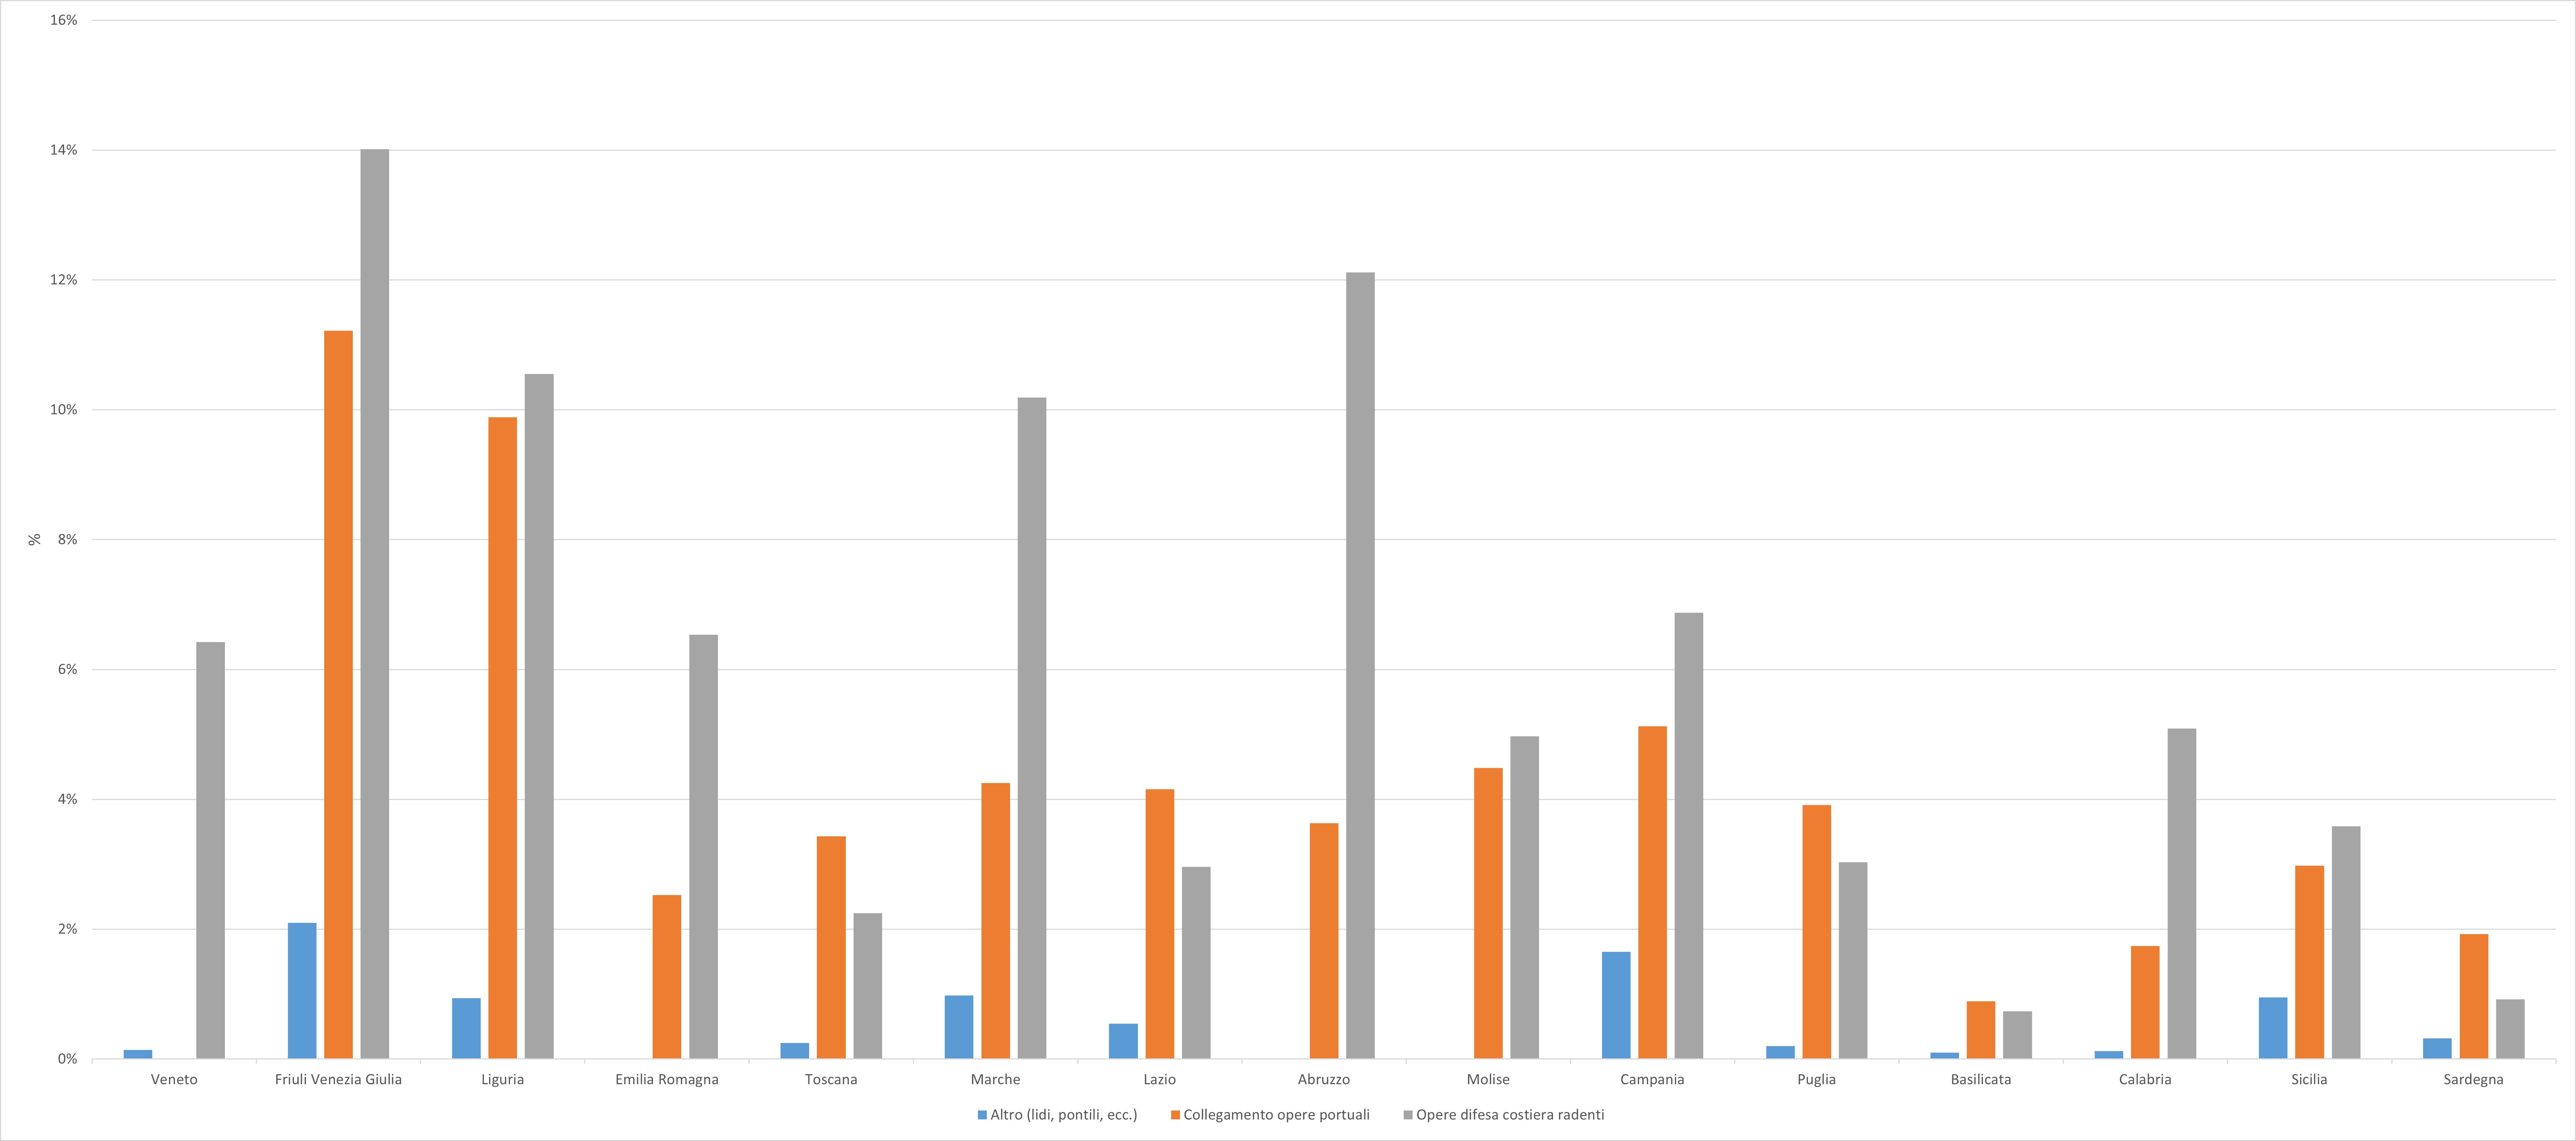
Figure 5: Share of the main elements of artificialized coast by region (2020) Data source
ISPRA |
Thumbnail
Headline
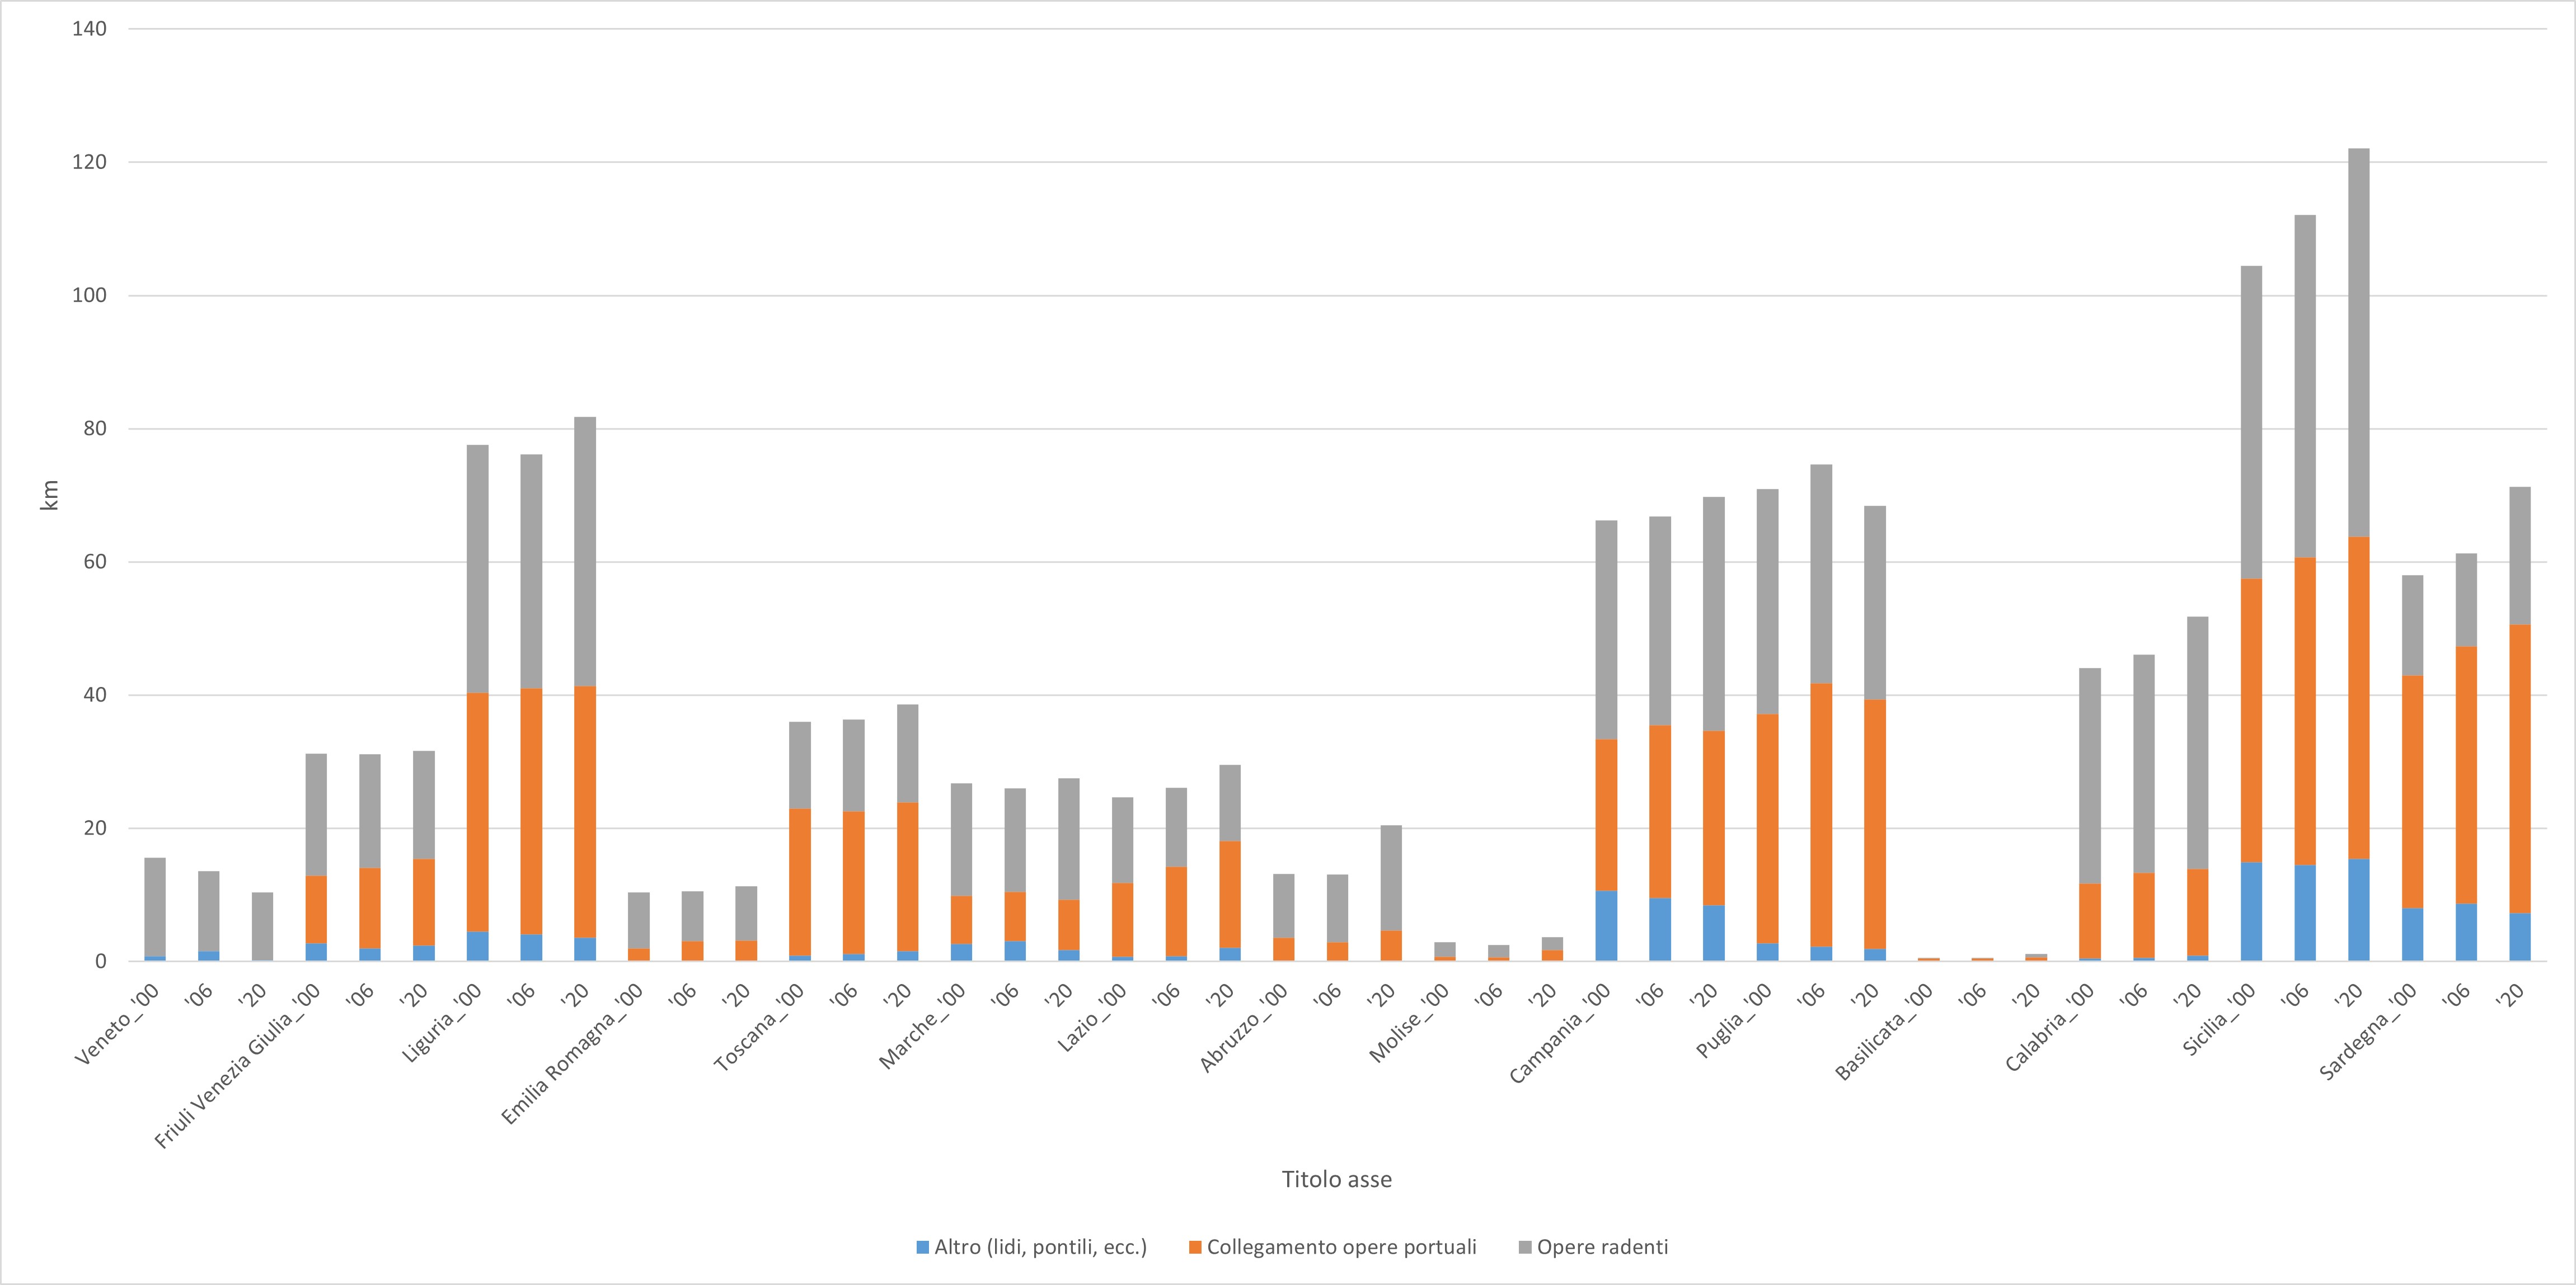
Figure 6: Regional trend of the main elements of coastal artificialization for the years 2000, 2006, 2020 Data source
ISPRA |
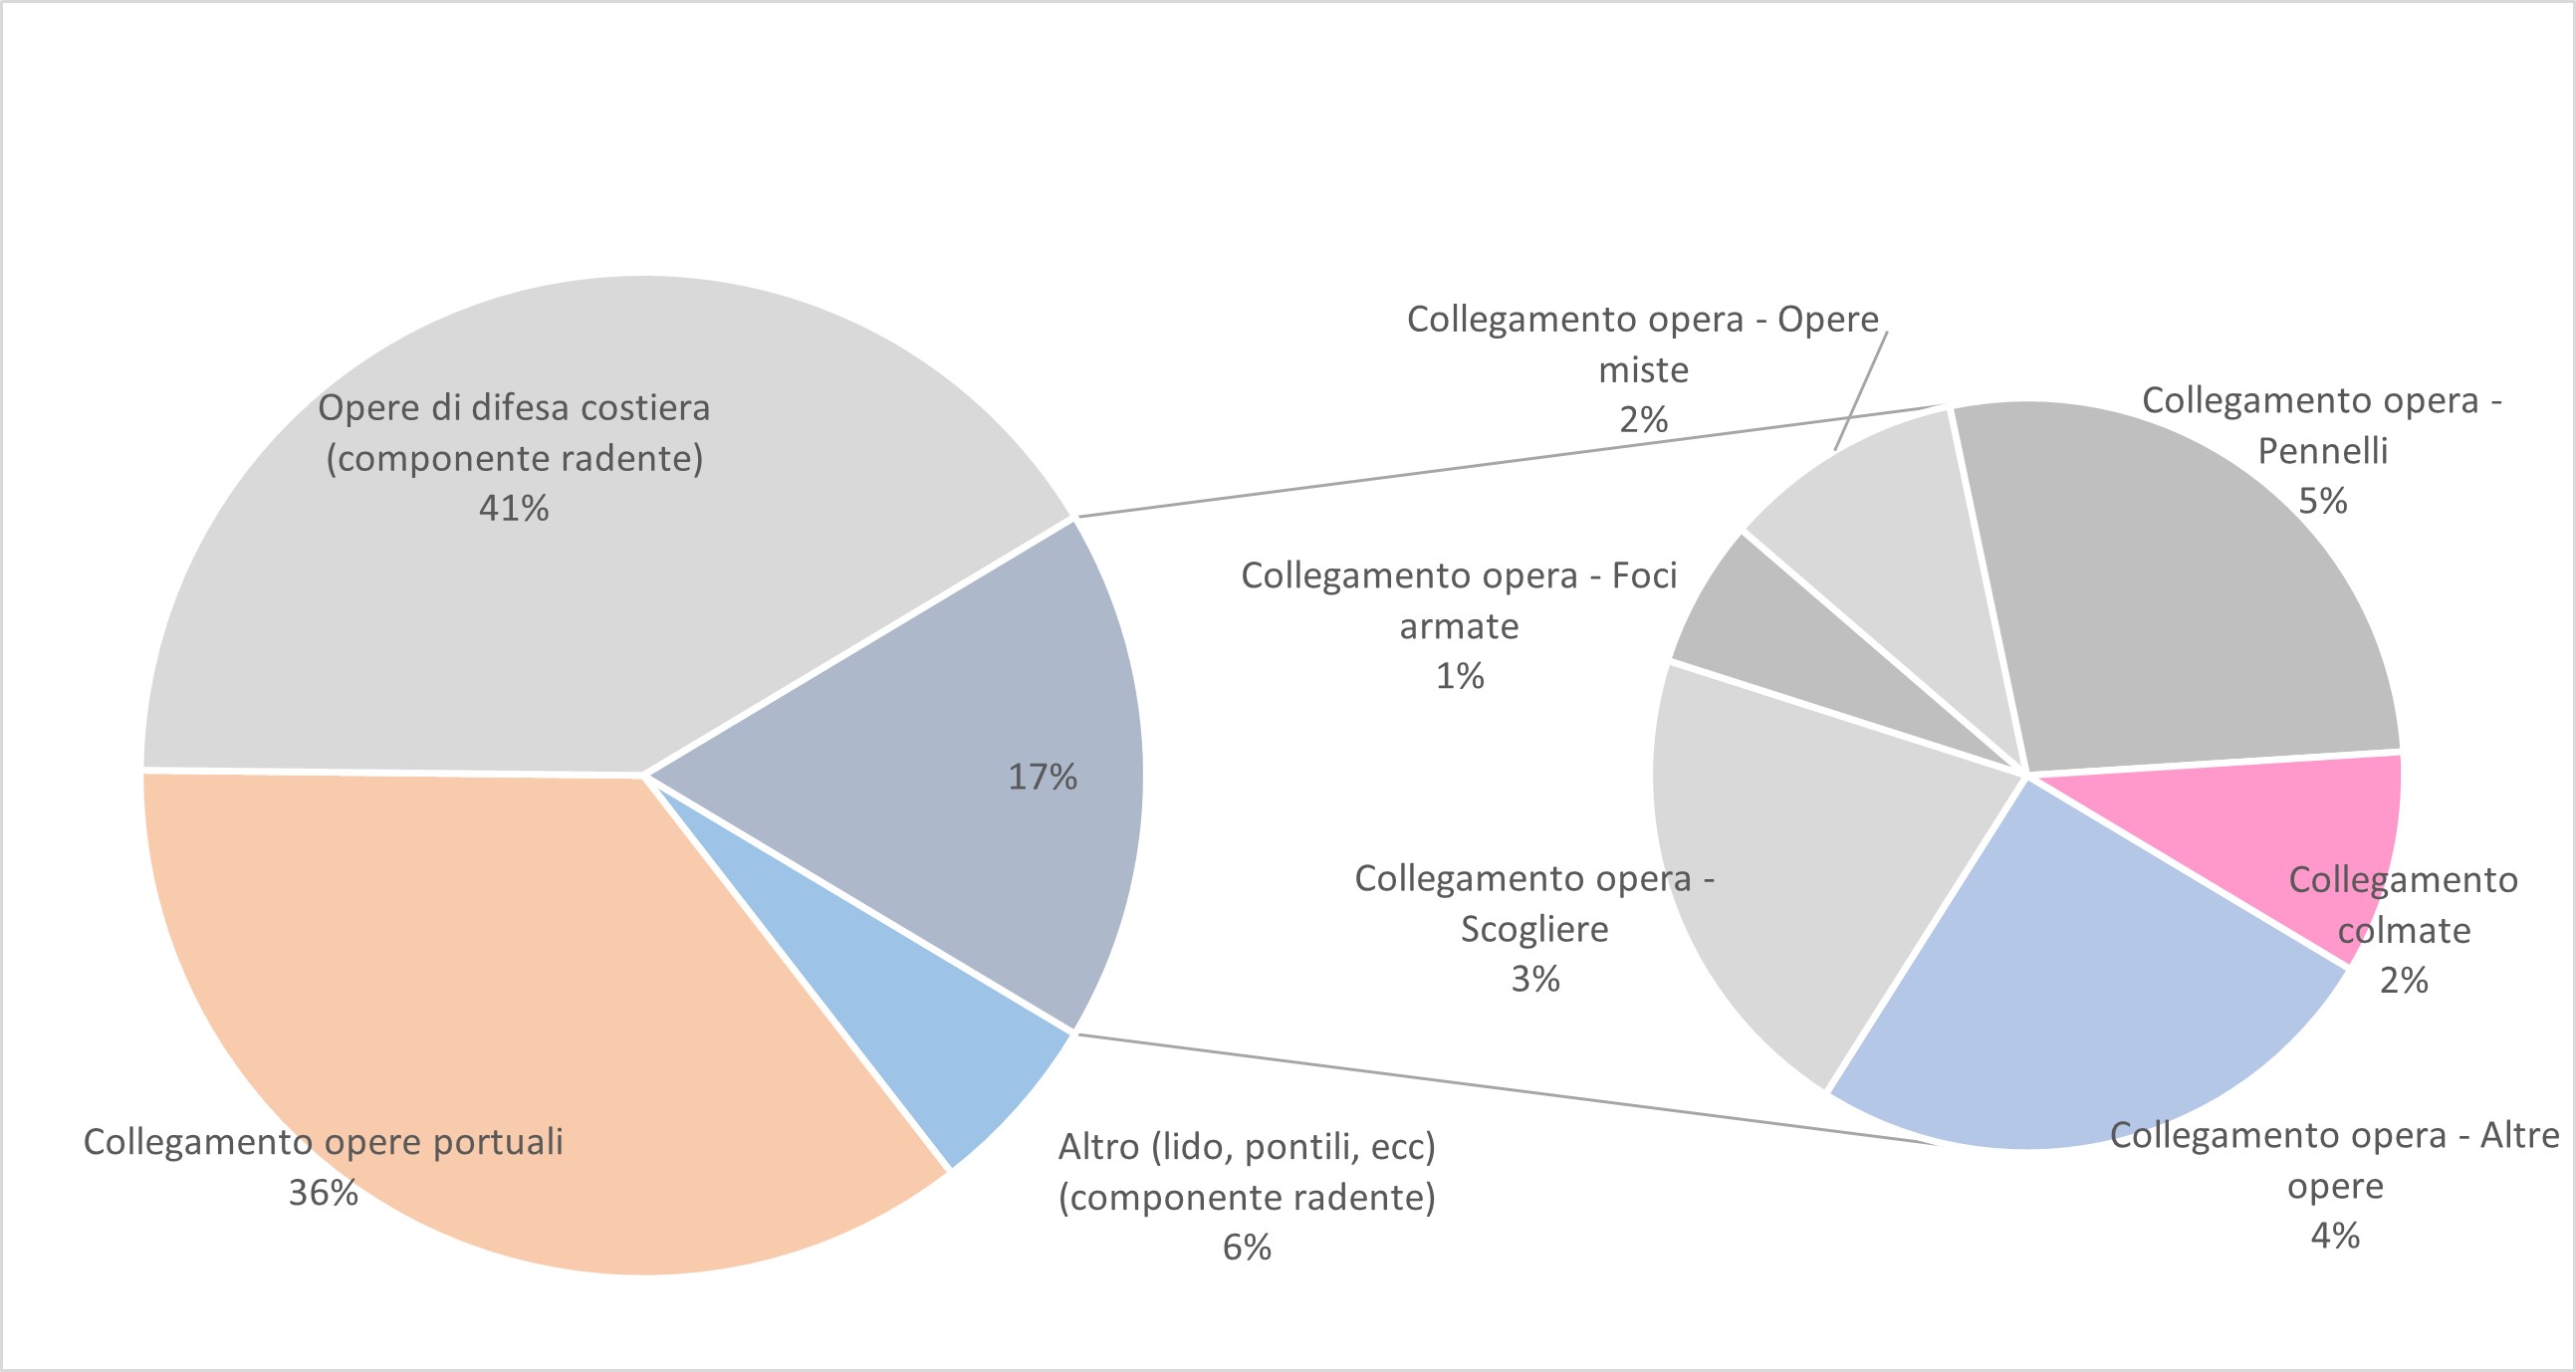
For a clearer understanding of the elaborate graphs it is considered appropriate, as already reported in the section “Description of the processing methodology”, to provide a more detailed description of the elements “port link” (Figure 1a) and “operational link” (Figure 1b) referring to the vision of their graphic representation. The same description applies to connections related to “coastal cunning”, i.e. areas of coastal seabed artificially subtracted from the sea but not linked to port functions. Figure 2 is represented the general “picture” of coastal artificialization at 2020, which highlights how the anthropogenic works built grazing on the coast and the port works constitute the largest component of coastal artificialization. In fact, the double cake graphic shows that mixed works, arms foci, cliffs, filled, brushes, filled and other works (e.g. piers), which develop at sea and only for a small stretch are connected to the coast, contribute to coastal artificialization only for 17% compared to the total of the works. As can be seen from Figure 4, the presence of grazing defense works (drop and wall) is predominant in almost all regions. Only in Tuscany, Lazio, Puglia, Basilicata and Sardinia, in fact, the port works, in terms of kilometers of occupied coast, are greater than the defense works grazing and other works. In 2020, Sicily is the region with the highest number of kilometers of artificialized coastline (122 km), followed by Liguria (82 km) and Sardinia (71 km). The lowest values of artificialized coastline are highlighted in Basilicata (1 km), Molise (4 km) and Veneto (10 km). Veneto, for example, shows the lowest values of artificialized coast and you can see the total lack of connections of port works, due to the fact that the basic data of the indicator do not take into account the works inside the lagoon areas. As for the presence of the other grazing works (Other, beaches and piers, etc.), Campania, Sicily and Sardinia are the regions with the highest values, while the total absence of this type of works in Emilia-Romagna, Abruzzo and Molise is reported. Also in this case, for Emilia-Romagna is worth the consideration that works attributable to “Other, beaches and piers, etc.” are present only in lagoon areas of the region. Examining Figure 5, the situation seems to be almost reversed: it is noted, in fact, how the highest values of coastal artificialization are recorded in Friuli-Venezia Giulia, Liguria and Campania, followed by Marche and Abruzzo. The only element that remains “constant” seems to be Liguria, which maintains its primacy both in an absolute way, and in relation to the extension of its coastline. It can also be noted for Friuli-Venezia Giulia, Liguria, Campania and Molise, the importance of the presence of the port works on the artificialization of the coast, in relation to the length of the regional coast. From the observation of Figure 6 it is possible to assess which is the region in which coastal artificialization appears to be growing and which work contributes to greater extent. As you can see, in fact, almost all the regions (except Veneto and Puglia) show increasing values of artificialization and, for example, for the regions of Sicily, Liguria and Sardinia, which in 2020 have the highest value of coastal artificialization (Figure 4), the works that most contribute to the increase are the port and coastal defense. For any region, there is no significant impact of other grazing works (Other, shores and piers, etc.) in the temporal variation of coastal artificialization.