Aree
GROUNDWATER RECHARGE
Data aggiornamento scheda:
The indicator evaluates the cumulative monthly and annual height of water (expressed in mm) that infiltrates deep into the ground following rainfall, compared to the surface of the national territory.
In 2025, total annual infiltration was estimated at 184.9 mm, corresponding to 55.8 billion cubic meters. This value was significantly lower than the average for the period 1951–2025, estimated at 215.7 mm (corresponding to 65.2 billion cubic meters), marking a negative anomaly of approximately –14.3%.
HYDROLOGICAL DROUGHT
Data aggiornamento scheda:
The maps of Standardized Precipitation Index (SPI) at 12 months provide a national and large-scale assessment of hydrological drought conditions, obtained using rainfall data collected and published by the regional hydro-meteorological services and those of the autonomous provinces and those of the abolished National Hydrographic and Mareographic Service (SIMN, now merged into ISPRA) of the Department for National Technical Services. The 12-month aggregation time step chosen for the SPI evaluation is the one that best describes the effects of drought (precipitation deficit) on river flow, reservoir recharge and the availability of water in aquifers.
In 2025, the 12-month SPI maps (SPI12) continued to highlight drought conditions for the Central-Southern territories and the major islands, even if these conditions, on an annual scale, were less severe than in previous years and very localized. In terms of SPI12, the months of January, September and October 2025 were those most characterized by drought conditions, from extreme to moderate, although the percentage of Italian territory affected by such conditions was just over 10%. Northern Italy was, however, characterized by situations of mostly severe (1.5 ≤ SPI < 2.0) and locally extreme humidity (SPI12 ≥ 2.0).
Central, Southern Italy and the major islands, due to the rainfall deficits and high temperatures also recorded in 2025, as well as the drought conditions already reported starting from the second half of 2023 and then in 2024, continued to have problems related to the use of water resources (water stress) with environmental and socio-economic impacts.
INTERNAL FLOW
Data aggiornamento scheda:
The indicator Internal flow provides the annual estimate, expressed in mm, of the quantity of renewable water resource that is naturally produced in a given area as a result of rainfall. The indicator is calculated for each year from 1951 to 2025.
In 2025 the value of the indicator at national level is 423.8 mm, corresponding to 128 billion cubic metres. The average value of the indicator compared to the national territory of the last thirty climatological years 1991–2020 is 442.6 mm, corresponding to 133.7 billion cubic meters, while the long-term average 1951–2025 (so-called LTAA‒ Long-Term Annual Average ) is 457.2 mm, corresponding to 138.1 billion cubic meters.
2025 was characterized by a negative anomaly of the renewable water resource both compared to the long-term average (–7.4%) and compared to the last thirty climatological years (–4.3%). The gap increases if the data is compared with the value of the indicator estimated in 2024, equal to 524.2 mm (–19.2%). At a national level, the availability of renewable water resources continues to show a statistically significant negative trend from 1951 to today.
PERCENTAGE OF ITALIAN TERRITORY SUBJECT TO PRECIPITATION DEFICIT AND SURPLUS
Data aggiornamento scheda:
The indicator provides an evaluation of humidity conditions ( precipitation surplus compared to climatology ) and drought ( precipitation deficit compared to climatology ) to which the national territory is subject, in terms of status and trends. For each month from 1952 to 2025, the percentage of Italian territory subject to deficit and/or surplus precipitation conditions is expressed using the Standardized Precipitation Index (SPI) relating to the aggregate precipitation on the 3 and 12 month time scale.
Overall on a national scale, 2025 was characterized by substantially average precipitation, where however Northern Italy recorded a surplus while Central Italy, the South and the major islands continued to be characterized by a precipitation deficit, although less burdensome than the previous year.
This determined maximum percentage values of the national territory characterized by "extreme drought" (SPI ≤ –2.0) equal to 0.86% and 0.5%, respectively for the cumulative precipitation over 3 months and that cumulative over 12 months. The maximum percentage of national territory characterized by "severe or moderate drought" (–2.0 < SPI ≤ –1.0) was, however, 31.6% on a time scale of 3 months and 12.2% on a time scale of 12 months. On the other hand, on the 3-month time scale, maximum values in the year of the percentage of the national territory characterized by "extreme humidity" (SPI ≥ 2.0) were 3.0%, while the maximum value relating to "severe or moderate humidity" (1.0 ≤ SPI < 2.0) was equal to 28.6%. On a 12-month time scale, the percentage of the country affected by “extreme humidity” reached a high of 10.4%, while the percentage with “severe or moderate humidity” reached a high of 30.6%.
POTENTIAL EVAPOTRANSPIRATION
Data aggiornamento scheda:
The indicator provides, for each month of the year, the evaluation, using the Thornthwaite method, of the cumulative monthly potential evapotranspiration water height on natural soil, expressed in mm, compared to the surface of the national territory.
In 2025, the estimated value of total annual potential evapotranspiration on natural soil was equal to 775.8 mm, deviating by +11% from the average value for the period 1951–2025, estimated at 695.9 mm.
PRECIPITATIONS
Data aggiornamento scheda:
The indicator provides the evaluation, expressed in mm, of the height of water, compared to the surface of the national territory, which falls to the ground (both in liquid and solid form) for each month and for the entire year.
The indicator relating to 2025 is compared, for each month of the year, with the corresponding average values for the period 1951–2025 obtained using the same methodology. In 2025, the value of total annual precipitation in Italy was 962.9 mm (290.9 billion cubic metres), 1% greater than the corresponding long-term average value (LTAA- Long-Term Annual Average ) and 2% compared to the annual average over the last thirty climatological years 1991–2020.
Going down to the regional and district level, the situation is very diversified, with Northern Italy being affected in 2025 by quantities of precipitation higher than the long-term averages. On the other hand, the precipitation anomaly compared to the LTAA was negative in the Center and South and the major islands.
REAL EVAPOTRANSPIRATION
Data aggiornamento scheda:
The indicator provides, for each month and for the entire year, the evaluation of the cumulative monthly and annual water height, expressed in mm, compared to the surface of the national territory which actually transfers into the atmosphere due to the phenomena of evaporation from liquid mirrors and from the ground and transpiration of vegetation and, therefore, does not contribute to the formation of the renewable water resource.
In 2025, the estimated value of the total annual real evapotranspiration was equal to 537.5 mm, with an anomaly of +8.9% compared to the average value of the period 1951–2025 estimated at 493.6 mm.
RUNOFF INDEX
Data aggiornamento scheda:
The indicator provides on an annual basis the evaluation, expressed as a percentage, of the relationship between the annual volume of runoff (surface runoff) and the annual volume of precipitation. This indicator aims to provide an evaluation of the quantity of water that is directly transformed into surface runoff compared to the total rainfall and to evaluate the long-term trend, also in relation to the possible impact due to climate change. The annual values of the indicator are also compared with the corresponding average value calculated over the entire period 1951–2025.
The analysis of the data for 2025 highlights an indicator value of 24.4%, remaining below the long-term historical average (25.2%). This finding marks a change in trend compared to 2024, the year in which an above-average value was recorded (26.2%). Despite this decline, the data still remains above the critical level of 2022, when the historical series had reached its second absolute minimum (18.5%).
STANDARDIZED HYDRO-CLIMATE BALANCE
Data aggiornamento scheda:
The maps of Standardized Precipitation-Evapotranspiration Index (SPEI) at 12 months provide a national and large-scale assessment of drought conditions and are obtained by analyzing the deviation of the hydrological variable hydro-climatic balance , consisting of the difference between precipitation and potential evapotranspiration, and its reference climatology.
In 2025, the 12-month SPEI maps (SPEI12) show drought conditions, from extreme to moderate, for the territories of central Italy and for the South and the major islands, but with a more limited extension compared to the previous year. The months from January to March 2025 were those most characterized by extreme drought conditions on the 12-month time scale (SPEI12 ≤ –2.0), due to the precipitation deficit found in the second half of 2024, in particular on southern Italy on the Adriatic side. The maximum extension of the hydro-climatic balance deficit was reached in January, with 8.4% of the Italian territory affected by extreme drought, which continued to reduce over the course of the year. The maximum extent of areas characterized by severe or moderate drought on the 12-month time scale (–2.0 < SPEI12 ≤ –1.0) was detected in October with 34.7% while the minimum value was recorded in November with 21.3%.
The intensity and persistence of these conditions in 2025 had effects on the availability of water resources in different areas of Italy, consequently causing environmental and socio-economic impacts linked to the use of water.
ASTRONOMICAL TIDE HEIGHT ALONG THE ITALIAN COASTS
Data aggiornamento scheda:
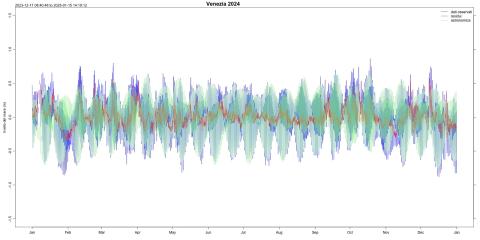
The tide is a periodic phenomenon of rising and falling of the sea surface due to the gravitational attraction exerted by the Moon, the Sun and other celestial bodies on the masses of water present on Earth and secondarily also due to meteorological disturbances. Data from the National Mareographic Network (ISPRA) were used to characterize the amplitude of the astronomical component of the tide signal along the Italian coasts. As is well known, the astronomical tide presents profound differences in the different Italian seas, reaching its maximum excursion in the Northern Adriatic and in the Venice Lagoon, being also strongly influenced by the configuration of the basin.
ASTRONOMICAL TIDE HEIGHT IN THE VENICE LAGOON
Data aggiornamento scheda:
Continuous monitoring over time of the variations in the astronomical tidal amplitude allows us to highlight the hydrodynamic and therefore morphological changes within the Venice Lagoon, which owes its survival to the maintenance of very delicate environmental balances. The amplitude of the tide in the lagoon is compared with that characteristic of the Gulf of Venice, belonging to the same area from a geological point of view, but free from the anthropic intervention that characterizes the transition environment considered. The trend in tidal height is now substantially stable in almost the entire lagoon, after the strong variations observed as a consequence of profound changes introduced to the lagoon morphology during the first decade of the century.
CLEAN COAST INDEX (CCI)
Data aggiornamento scheda:
Any solid material, manufactured or transformed by man, abandoned or lost in the marine and coastal environment, or which reaches the sea in any way, is defined as marine waste. Italy, with Legislative Decree no. 190/2010 transposing the Framework Directive on the Strategy for the Marine Environment, has been carrying out an intense monitoring program of marine waste since 2015, including beached waste. Twice a year, in spring and autumn, the coastal Regional Environmental Protection Agencies (ARPA) carry out solid waste monitoring in the sample areas of 69 reference beaches along the national coast. To evaluate the degree of beach cleanliness based on the density of waste in the monitored sample areas, the Clean Coast Index (CCI), an indicator developed and applied internationally, was calculated.
In 2024, the CCI was calculated for 66 beaches in spring and 69 in autumn. In spring, 80% of the beaches monitored were clean or very clean, compared to 8% dirty or very dirty. In autumn, 81% of beaches were clean or very clean, while 9% were dirty or very dirty. The rest of the beaches were quite clean. Compared to the previous year, the percentage of clean or very clean beaches increased in autumn (77% in 2023), while in spring it remained almost unchanged. In both spring and autumn there was a decrease in dirty and very dirty beaches, from 12% to 8% and from 12% to 9%, respectively.
MARINE STRATEGY MONITORING - ALTERATION OF HYDROGRAPHIC CONDITIONS
Data aggiornamento scheda:
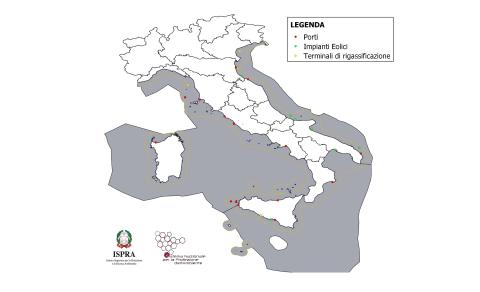
The monitoring envisaged by the Marine Strategy Framework Directive 2008/56/EC for Descriptor 7 takes into consideration the significant and permanent alterations of the hydrographic conditions due to coastal and marine infrastructures subject to national EIA, built or in the process of being designed/built since 2012. Currently the reference indicator for the D7C1 is related to the extension of coastal marine water bodies of each Sub-Region, defined pursuant to the Directive 2000/60/EC, which presents impacts due to permanent changes in hydrological conditions attributable to the presence of new infrastructures built starting from 2012 and subject to national EIA. The objective for this indicator is not to exceed 5% of the extent of coastal marine water bodies. In 2024 the goal was achieved.
MARINE STRATEGY MONITORING - CONTAMINANTS
Data aggiornamento scheda:
Progress towards achieving the good environmental status of marine waters depends on a series of key factors regulated in Directive 2008/56/EC (MSFD) and implemented in Italy through Legislative Decree 190/2010 (and subsequent amendments). One of the main factors is linked to contamination in waters and organisms and to the progressive elimination of pollution, ensuring that the presence of contaminants does not generate significant impacts or risks for the marine environment. Descriptor 8 of the Marine Strategy Framework Directive 2008/56/EC specifically requires the assessment of the presence of chemical contaminants (D8-C1) and their effects (D8-C2). This is accompanied by Descriptor 9 which provides for the evaluation of the level of contaminants in the edible tissues of fishery products compared to the limits established by Regulation (EU) 2023/915. In 2024, monitoring of the Marine Reporting Unit (MRU) West Mediterranean Sea (MWE). The data collected comes from the specific monitoring carried out by ISPRA and from the institutional monitoring of the experimental zooprophylactic institutes. The definitive evaluation, in relation to the judgement Good Environmental Status (GES), will be processed as soon as all the data produced by the regional agencies are available. With the data available to date, bioaccumulation has a problem linked to exceeding the regulated value of mercury, however from a health point of view a positive opinion is confirmed. This result is in line with what has already been highlighted in past years. For the sediment matrix there is a criticality linked to the presence of TBT and some metals.
MARINE STRATEGY MONITORING - EUTROPHICATION
Data aggiornamento scheda:
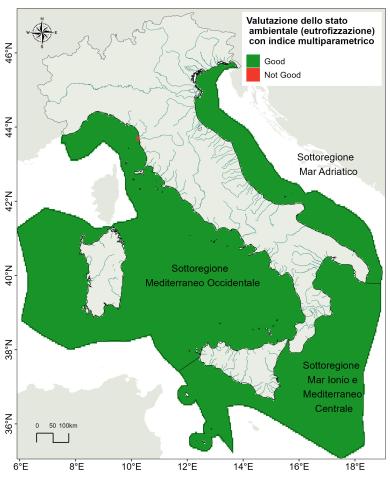
Eutrophication is a process caused by the enrichment of nutrients, in particular nitrogen and phosphorus compounds, which determines an increase in primary production and algal biomass with consequent alteration of benthic communities and, in general, a decrease in water quality. The release of nitrogen and phosphorus into the marine and coastal environment can derive from diffuse sources (river loads, main collectors of agricultural activities and civil discharges) and from point sources (discharges deriving from wastewater treatment plants, industrial and deriving from aquaculture activities).
The assessment of eutrophication of marine waters according to the Marine Strategy is carried out every six years using a combination of information on nutrient levels (concentrations in the marine environment), the primary effects of nutrient enrichment (chlorophyll 'a' concentration as an indicator of algal biomass) and the secondary effects of nutrient enrichment (impacts on organisms caused by hypoxia and/or anoxia phenomena in bottom waters) that are ecologically relevant.
The most recent assessment transmitted by Italy to the European Commission (October 2024) refers to the six-year period 2016-2021 and highlighted the achievement of Good Environmental Status. The analysis of 2022 monitoring data confirms this indication.
MARINE STRATEGY MONITORING - MICROWASTE IN THE SUPERFICIAL LAYER OF THE WATER COLUMN
Data aggiornamento scheda:
Since 2015, Italy, in implementation of the Marine Strategy Framework Directive (2008/56/EC), has implemented an extensive marine litter monitoring program, including microlitter present in the surface layer of the water column. The activity is conducted by the National System for Environmental Protection (SNPA), with the coordination of the Ministry of the Environment and Energy Security (MASE). Microwaste, particles of anthropic origin smaller than 5 mm, derive from both primary sources (industrial pellets, cosmetic microgranules, abrasives) and secondary sources (fragmentation of macrowaste). Their composition, quantity and distribution constitute a key parameter for assessing the good environmental status of marine waters. The processing of data collected from 2015 to 2024 highlights a stable median density of 0.04 microparticles/m² (approximately 40,000 microparticles/km²), with interannual and spatial variations linked to the different hydrodynamic conditions and anthropic pressures of the Italian marine subregions. In 2024 there is an increase in concentrations in the Adriatic Sea and a decrease in the Ionian Sea and the western Mediterranean. At Mediterranean level, the Barcelona Convention has defined a threshold value of 0.000845 microparticles/m² (845 microparticles/km²) for achieving good environmental status: the values found in Italian seas, although stable in recent years, are still significantly higher.
MARINE STRATEGY MONITORING - PHYSICAL LOSS
Data aggiornamento scheda:
Physical loss defines the seabed surface lost due to permanent changes to the substrate and/or morphology of the seabed induced by anthropogenic activities and/or works, such as coastal defense works, port infrastructures, wind farms, cables and pipelines, etc. It helps to define the level of integrity of the seabed (Descriptor 6), as defined pursuant to the Marine Strategy Framework Directive 2008/56/EC (MSFD) and Decision 2017/848/EC.
The "physical loss" indicator measures the extent and impact of the different types of works and/or activities on the seabed in total and by type of habitat. These data allow us to populate Criterion D6C1 (total physical loss) and Criterion D6C4 physical loss by habitat types ( Broad Habitat Types ), sensu MSFD.
In Italian seas the physical loss has values between 19-34 km 2, detected in the Ionian Sea and Central Mediterranean Sea MRU and in the Adriatic Sea MRU, respectively 19.9 km 2 and 34 km 2 in extension, and approximately 51 km 2 observed in the MRU western Mediterranean Sea.
MARINE STRATEGY MONITORING – BEACHED MARINE WASTE
Data aggiornamento scheda:
The Marine Strategy (Directive 2008/56/EC) represents an important governance tool for the sea system, promoting the adoption of strategies aimed at safeguarding the marine ecosystem aimed at achieving Good Environmental Status. Good Environmental Status is assessed on the basis of 11 qualitative descriptors and, among these, Descriptor 10 provides that the properties and quantities of marine waste do not cause damage to the coastal and marine environment. Since 2015, Italy has been implementing an extensive monitoring program for marine litter, including beached macro-litter. In 2024, the median of total marine waste stranded on Italian coasts was equal to 252 waste per 100 m, a value similar to that of the previous year (250 waste per 100 m). This is a density that confirms the decreasing trend of beached waste since monitoring was carried out, although still significantly higher than the threshold value of 20 waste per 100 m, established at European level as a requirement for achieving Good Environmental Status. As in previous years, single-use plastics are the most common beached waste, representing approximately 28% of the total, followed by smoking-related waste (mainly cigarette butts), equal to 9% of the waste recorded along the Italian coasts.
NITRATES IN GROUNDWATER
Data aggiornamento scheda:
The indicator provides the percentage of groundwater monitoring stations divided into quality classes according to the average concentration of nitrates detected over a four-year monitoring period 2020-2023.
The classes typically represent conditions ranging from a low concentration of nitrates (good quality water) to high levels of contamination (at risk or polluted water). At a national level, 69.1% of monitoring stations have average nitrate concentration values lower than 25 mg/l (good quality water); while 11.7% of the monitored stations recorded an average nitrate concentration greater than or equal to 50 mg/l (polluted water). Comparing the values of the four-year period 2020-2023 with the previous one (2016-2019), a decrease in the average concentration is highlighted in 38.8% of the stations, an increase in 26.9% and stability in 34.4%.
NITRATES IN SURFACE WATER
Data aggiornamento scheda:
The indicator provides the percentage of surface water monitoring stations divided into quality classes according to the average concentration of nitrates detected and in the four-year period 2020-2023, in order to provide an overview of the level of nitrate pollution. The classes typically represent conditions ranging from a low concentration of nitrates (good quality water) to high levels of contamination (at risk or polluted water). At a national level, 95.3% of monitoring stations have average nitrate concentration values lower than 25 mg/l (good quality water); while 0.6% of the monitored stations recorded an average nitrate concentration greater than or equal to 50 mg/l (polluted water). Comparing the values of the four-year period 2020-2023 with the previous one (2016-2019) shows a decrease in the average concentration in 22.4% of the stations, an increase in 20.6% and stability in 57% of the stations.
PRESSURE ON WATER BODIES
Data aggiornamento scheda:
The indicator provides a national-level picture of the types of pressures acting on surface and groundwater bodies. This information derives from the reporting of the 3rd Water Management Plans drawn up by the District Basin Authorities in accordance with the provisions of the Water Framework Directive 2000/60/EC (WFD) which requires an examination of the impact of human activities on the state of the waters to be carried out. From the analysis of the data it is observed that the main type of pressure that impacts both categories of water, surface and underground, is that of the diffuse type for agricultural use. Subsequently, surface water bodies are impacted by hydromorphological pressure while underground water bodies are impacted by withdrawals.
TIDE PROPAGATION DELAY IN THE VENICE LAGOON
Data aggiornamento scheda:
Continuous monitoring over time of the variations in the propagation delay of the astronomical tide allows us to highlight the hydrodynamic and therefore morphological changes within the Venice Lagoon, which owes its survival to the maintenance of very delicate environmental balances. The tidal propagation delays within the lagoon are calculated with respect to the Gulf of Venice, belonging to the same area from a geological point of view, but free from the anthropic intervention that characterizes the lagoon environment considered. The tidal propagation delays are greater the greater the distance of the observation point from the port inlet from which it is fed. The tidal wave takes approximately 35/40 minutes to enter the lagoon through the narrowings of the three port inlets, while it takes approximately three hours to reach the more internal and remote areas.
UPWELLING
Data aggiornamento scheda:
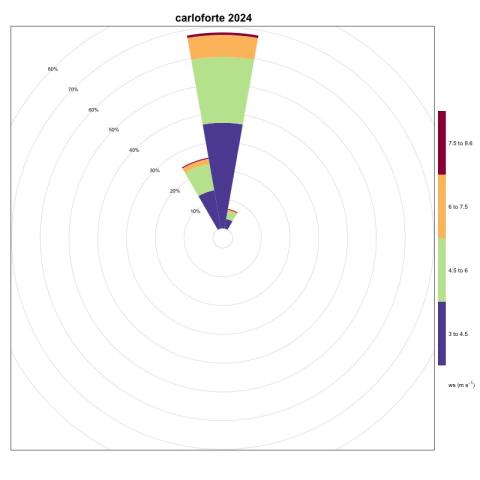
Upwelling is a physical phenomenon due to the action of wind and currents which can generate a rising current, oriented offshore and orthogonal to the coast.
This phenomenon has a notable impact on the local fish fauna and is therefore of great interest. The identification of the most favorable areas for the generation of this phenomenon was carried out using the wind speed and direction data provided by the National Mareographic Network (RMN) managed by ISPRA. These appropriately processed data allow us to identify the coastal areas that are most likely to be more exposed to the upwelling phenomenon such as, for example, the Carloforte area in Sardinia which is confirmed to be among the most favorable to the generation of this variable.
CLASSIFICATION OF BATHING WATER
Data aggiornamento scheda:
The quality of bathing water is essential for the protection of the health of citizens and plays an important role also in terms of the protection of the natural environment and the economic aspects in the tourism sector. For this reason, specific monitoring is carried out throughout the bathing season. With regard to the bathing season 2024, more than 31,600 samples of seawater and lake were collected and analyzed on a total of over 5,000 km of bathing coast. At municipal level the km of coast are divided into more or less extensive bathing waters, for a total of 5,506 bathing waters. The results of the analysis, in addition to guaranteeing the absence of hygienic health risks during the season, have also allowed to classify the waters. The classification was made using the results of the monitoring carried out during the 2024 bathing season and those of the previous three seasons (2023-2022-2021). At the national level, most of the waters are excellent in the classroom (91%), however, however, there are still critical issues due to the presence of water in the low class (1.1%) and not classifiable (1.1%), for which it is not possible to make a quality judgment because most are newly identified and have not completed the 4-year cycle of monitoring, necessary for classification. Even at the regional level, the percentage of water in the excellent and good classes is the highest.
INCREASE IN THE MEAN SEA LEVEL IN VENICE (ICLMM)
Data aggiornamento scheda:
The indicator measures the increase in the average sea level in Venice, being of fundamental importance for the studies and conservation interventions of the city of Venice, as well as the lagoons and high Adriatic coastal areas at risk of flooding. In Venice, the average sea level has increased since the beginning of the recordings: in the period 1872-2024 the level increases by an average of 2.6 mm / year, with a trend not always constant and uniform over time. In this regard, it is considered appropriate to highlight the rate for the last thirty years (1993-2024), where the average sea level rise is almost doubled (4.8 mm/year).
INLAND SURFACE WATERS – BIOLOGICAL QUALITY ELEMENTS IN LAKES
Data aggiornamento scheda:
The indicator derives from the application of the reference legislation for the determination of the ecological status of surface water within the meaning of Directive 2000/60/EC. From the data transmitted in the SoE WISE2 flow referring to 2023, it is noted that the EQB Fitoplankton was monitored at 151 stations and in 72% of them reached the "good or higher" ecological status. In the remaining 28% of the stations there is a state of lower quality than good.
INLAND SURFACE WATERS – BIOLOGICAL QUALITY ELEMENTS IN RIVERS
Data aggiornamento scheda:
The indicator derives from the application of the reference legislation for the determination of the ecological status of surface water within the meaning of Directive 2000/60/EC. For 2023, as part of the Soe WISE2 data stream, data on 694 monitoring stations for the EQB Macrobenthos were transmitted, which in 55% of them reached the "good or higher" ecological status. In the remaining 45% of the stations there is a state of lower quality than the good. For the EQB Diatomee in 2023, data from 591 monitoring stations were transmitted: in 74% of them there was a "good or higher" ecological status, the remaining 26% has an ecological status lower than the voucher.
LAGOON CLIMATOLOGY
Data aggiornamento scheda:
The weather variables observed in the Venice Lagoon (the average annual atmospheric pressures, the total annual rainfall, the number of rainy days and thermal anomalies) allow to photograph the climate changes taking place. During 2024, in the presence of an average annual pressure of 1,0155.9 mbar (below 0.3 mbar compared to the average of the reference period), 1,127 mm of rain were recorded (+34% compared to the average) over a period of 96 rainy days, while temperatures continue to show themselves in trend and continuous increase.
NUMBER OF HIGH WATER EVENTS
Data aggiornamento scheda:
The indicator shows the number of annual cases of tidal maximums, divided by height classes, detected at the station of Venice - Punta della Salute, representative of the historic city center. Monitoring the trend of the high and medium-high tide classes (above 80 cm compared to the ZMPS reference plane) allows you to control the pressure exerted both on the historic center of Venice (effects on the estate of the banks and buildings), and on the surrounding lagoon (environmental effects on the vegetation of the barenal habitats and on the greater erosion of the natural banks). In the last period, 2019 was an exceptional year as there were 28 cases of “high water”, i.e. exceeds of the threshold 110 cm on the ZMPS, record value of the entire historical series. As of 2020, the entry into operation of mobile barriers against flooding from high tide (model system "Mo.S.E.") has led to a differentiation in the number of cases of high water between the lagoon and the sea. 2024 recorded 12 cases of “high water” at sea and a single pass in Venice (on May 16, first case from 2021), thanks to the drive of the Mo.S.E. which defended the city.
Ostreopsis ovata concentration
Data aggiornamento scheda:
Ostreopsis cf. ovate it is a potentially toxic Bentonic microalga, now present in most of the Italian coastal regions with blooms that can give rise to human intoxication phenomena and toxic effects on benting marine organisms (states of suffering or mortality). The continuous expansion along the Italian coasts of Ostreopsis cf. ovate , of its blooms and the health, environmental and economic problems associated with it, has led to establish a microalga surveillance monitoring program since 2007. This activity has been carried out annually in the summer season by the regional environment agencies (ARPA). The data provided so far by the ARPA, collected and processed by Ispra have clarified the distribution and performance of the blooms at national and regional level. To date, the microalga has been found at least once in the monitoring campaigns carried out so far in 12 coastal regions out of 15. In 2024, the Ostreopsis CF. Ovata is present in 11 coastal regions or in 147/196 stations (75%), while it is absent in all samples taken along the Coste of Emilia-Romagna, Marche, Molise and Veneto.