Panel 1
Massimiliano BULTRINI, Simona BUSCEMI, Giorgio CATTANI, Alessandra GAETA, Federica NOBILE (Dipartimento di Epidemiologia del Servizio Sanitario Regionale-Regione Lazio ASL Roma 1), Maria Antonietta REATINI, Massimo STAFOGGIA (Dipartimento di Epidemiologia del Servizio Sanitario Regionale-Regione Lazio ASL Roma 1)
Estimates of the annual population weighted exposure (PWE) to ozone (O₃), aggregated at municipal level, were produced using an integrated approach combining measurements and statistical models. The data obtained, covering the period 2016–2023, allow comparison of PWE across all municipalities and provide a comprehensive picture of average exposure at national level.
In 2023, 100% of the population was exposed to levels above the WHO guideline value (60 µg/m³, expressed as the mean of the distribution of daily maximum 8-hour running averages over the period April–September).
The national mean PWE was 98 µg/m³ (minimum–maximum range: 55–124 µg/m³).
Over the observation period, no decreasing trend in exposure levels was detected.
The most widely acknowledged health assessments attribute a significant share of premature deaths and reductions in life expectancy to exposure to air pollutants (WHO, 2016; EEA, 2022; WHO, 2021).
Assessing population exposure and its spatial and temporal variability in the outdoor environment is a key step for epidemiological studies investigating the relationship between air pollution exposure and health effects (Caplin et al., 2019).
The indicator provides an estimate of the Population Weighted Exposure (PWE) to ozone (O₃) during the summer period, aggregated at municipal level. This allows for a comparison of the situation across different cities and provides a comprehensive overview of the average exposure at national level. It is representative of chronic population exposure and is useful for estimating the long-term health impacts.
Exposure values are compared with the reference values (guidelines and interim targets) set by the World Health Organization (WHO, 2021).
Estimate the average population exposure to the main airborne pollutants, assess exposure levels against WHO reference values, and evaluate the temporal trends in population exposure.
Legislative Decree No. 155 of 13 August 2010, as amended, implementing Directive 2008/50/EC and Directive 2004/107/EC.
WHO (2021), Global Air Quality Guidelines. Particulate matter (PM₁₀, PM₂.₅), ozone, nitrogen dioxide, sulfur dioxide and carbon monoxide. Geneva, World Health Organization, 2021.
A Clean Air Programme for Europe. Brussels, 18.12.2013 COM (2013) 918 final.
The Europe that protects: Clean air for all. Brussels, 17.5.2018 COM (2018) 330 final.
Pathway to a Healthy Planet for All – EU Action Plan: “Towards Zero Pollution for Air, Water and Soil”. Brussels, 12.5.2021 COM (2021) 400 final.
In revising its Air Quality Guidelines, the WHO produced quantitative risk estimates for a range of health outcomes associated with a 10 µg/m³ increase in the annual mean concentration of various pollutants.
In its assessments, the WHO does not establish a threshold value below which no risk occurs. However, for ozone, it identifies 60 µg/m³ as the lower limit of long-term exposure, calculated as the mean of daily maximum 8-hour running averages during the reference period (April to September, i.e. the warm season). This is defined as the Peak season ozone air quality guideline (AQG) level. The “peak season reference level” represents the lowest level at which increases in total mortality and cardiopulmonary mortality have been observed with a 95% confidence level.
The WHO has also defined interim targets (ITs), i.e. higher reference levels to be considered as intermediate objectives to be achieved step by step, through the implementation of air quality improvement policies. The interim targets for ozone proposed by the WHO are 70 µg/m³ (IT-2) and 100 µg/m³ (IT-1).
EU clean air programmes have established that the medium- to long-term objective is to align with the WHO Air Quality Guidelines, which are significantly more stringent than the standards set by EU air quality directives and are based on what is deemed necessary to ensure the protection of human health.
The Clean Air Policy Package and the Zero Pollution Action Plan aim to reduce the number of premature deaths linked to air pollution by more than half by 2030 compared with 2005.
Panel 2
Caplin A., Ghandehari M., Lim C., Glimcher P., Thurston G. (2019), Advancing environmental exposure assessment science to benefit society. Nature communication (2019) 10:1236. https://doi.org/10.1038/s41467-019-09155-4
EEA (2022), Health Risk Assessment of Air Pollution and the Impact of the New WHO Guidelines. Eionet Report – ETC/ATNI 2022/10.
Eurostat (2022), Sustainable development in the European Union — Monitoring report on progress towards the SDGs in an EU context — 2022 edition. (DOI): 10.2785/313289.
Stafoggia M, Bellander T, Bucci S et al. Estimation of daily PM10 and PM2.5 concentrations in Italy, 2013-2015, using a spatiotemporal land-use random-forest model. Environ Int 2019;124:170-79.
Stafoggia M, Cattani G, Ancona C, Ranzi A. La valutazione dell’esposizione della popolazione italiana all’inquinamento atmosferico nel periodo 2016-2019 per lo studio della relazione tra inquinamento atmosferico e COVID-19. Epidemiol Prev. 2020 Sep-Dec;44(5-6 Suppl 2):161-168. Italian. doi: 10.19191/EP20.5-6.S2.115. PMID: 33412807.
WHO (2016), Ambient air pollution: A global assessment of exposure and burden of disease. Geneva, World Health Organization, 2016.
WHO (2021), Global Air Quality Guidelines. Particulate matter (PM10, PM2.5), ozone, nitrogen dioxide, sulfur dioxide and carbon monoxide. Geneva, World Health Organization, 2021.
The population considered is the one distributed across the 2021 census sections, which represent the most recent territorial reference available.
The indicator expresses a municipality-level average of population exposure. It is well known that within a single municipality, there may be spatial variability in pollutant concentrations, with some areas experiencing higher levels than the municipal average or background concentrations. However, the assessment of local- or microscale-level exposure within individual municipalities falls outside the scope of this indicator.
It is important to note that areas with higher population density within a municipality are given greater weight in the calculation of the Population Weighted Exposure (PWE).
In any case, the exposure values obtained should not be compared with legal limit values: for the purpose of compliance assessment with legal thresholds, the highest value measured by individual air quality monitoring stations should be used instead.
Application of high-resolution spatiotemporal models, using spatiotemporal predictors, satellite data, and air quality monitoring data
Data quality assessment
DEP: Dipartimento di Epidemiologia del SSR Regione Lazio - ASL RME
ISPRA (Istituto Superiore per la Protezione e la Ricerca Ambientale)
ISTAT (Istituto Nazionale di Statistica) SNPA (Sistema Nazionale per la protezione dell’ambiente)
ISPRA – Database InfoARIA
ISTAT – www.demo.istat.it
National, Regional and Municipal level (7,901 out of 7,914 municipalities)
2016-2023
Indicator assessment
The model uses daily average concentrations measured at air quality monitoring stations across the national territory as the response variable, and a selection of spatial and temporal predictors as explanatory variables. Monitoring data are collected and stored by ISPRA in the InfoAria database, in accordance with Directive 2008/50/EC (and its national transposition by Legislative Decree No. 155/2010) and Decision 2011/850/EU.
A machine learning model—random forest—was developed to relate daily pollutant concentrations from monitoring stations to spatial predictors (such as population density, road network, land cover, altitude, artificial surfaces, etc.) and spatiotemporal predictors (dispersion modelling, meteorological data), in order to estimate daily mean O3 concentrations for each 1 km² grid cell across the Italian territory.
Based on the daily concentration estimates from the random forest model, the annual population-weighted exposure to O3 was calculated by weighting the concentration values in each grid cell by the population residing in that cell.
The “national average concentration value” is computed as the population-weighted mean of the estimated concentrations at the municipal level, using the resident population as weights.
Lastly, the percentage distribution of the resident population exposed to different O3 concentration classes is estimated.
In 2023, 100% of the population was exposed to levels above the WHO guideline value (60 µg/m³, calculated as the mean of daily maximum 8-hour running averages during the reference period from April to September). Ninety-nine percent of the population was exposed to concentrations exceeding Interim Target 2 (IT-2, 70 µg/m³), while 34% was exposed to levels above Interim Target 1 (IT-1, 100 µg/m³).
With regard to exceedances of IT-1, Lombardy and Veneto are the regions with the highest shares of exposed population, 96% and 83%, respectively, followed by Liguria (74%) and Emilia-Romagna (70%) (Figure 1 – Table 1).
The national average Population Weighted Exposure (PWE) was 98 µg/m³ (minimum–maximum range: 64–134 µg/m³) (Figure 2).
As shown in Figure 2, over the seven years considered, no decreasing trend in the average values of Population Weighted Exposure (PWE) has been observed. The national average has remained around 100 µg/m³ in all years analysed.
Although the trend has not been quantitatively assessed using statistical methods and refers to a relatively short period, it appears consistent with that observed over the last decade at air quality monitoring stations.
Between 2016 and 2023, 100% of the population continued to be exposed to ozone concentrations above the WHO guideline value. From 2017 to 2020, a reduction was recorded in the share of population exposed to levels above Interim Target 1 (IT-1), accompanied by an increase in the share of population exposed to concentrations between IT-1 and IT-2 (Figure 2).
Data
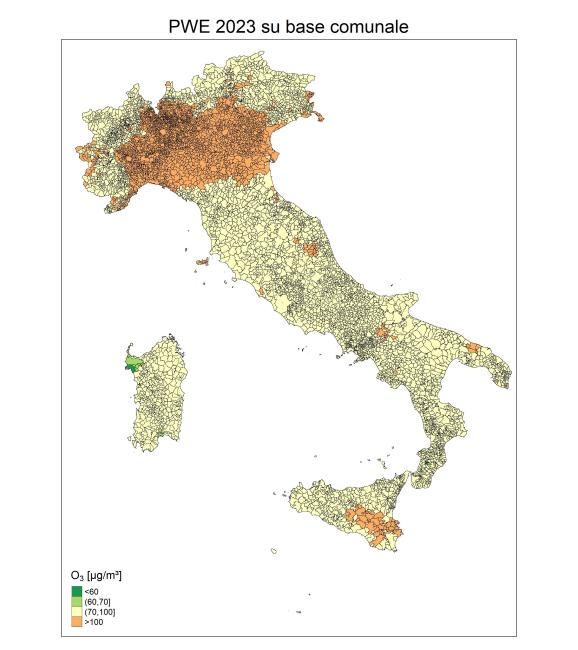
Figure 1: Population-Weighted Exposure to Ozono (O3) at Municipal Level (2023)
ISPRA processing based on data from the Epidemiology Department of the Lazio Regional Health Service
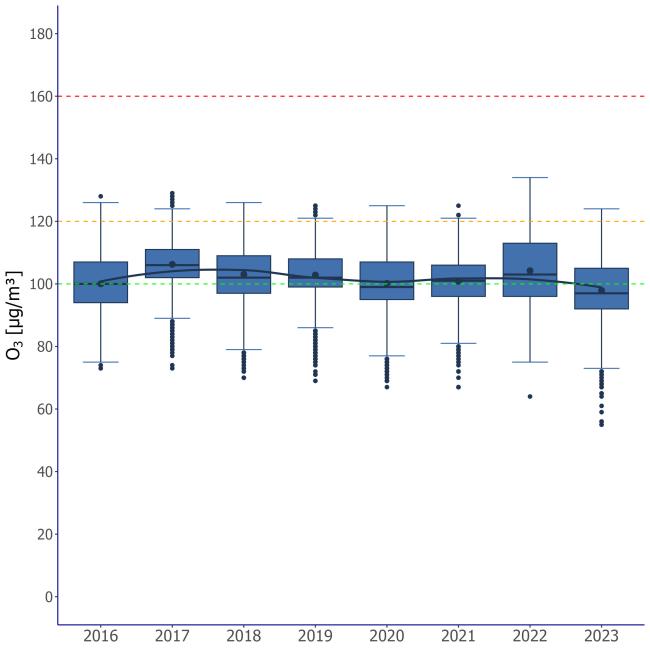
Figure 2: Annual distribution of Population-Weighted Exposure (PWE) to Ozono (O3) at Municipal Level
ISPRA processing based on data from the Epidemiology Department of the Lazio Regional Health Service
The box represents the interquartile range (IQR), which is the difference between the third quartile (Q3, 75th percentile) and the first quartile (Q1, 25th percentile) of the data. The line inside the box indicates the median (Q2, 50th percentile), while the dot represents the mean value.
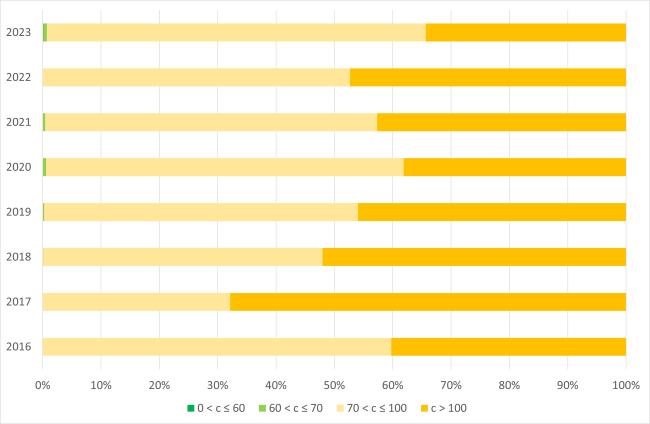
Figure 3: Percentage of Population Exposed to Ozono (O3) by exposure range and year
The four PWE classes correspond respectively to the WHO air quality guideline value and the two interim targets.
Table 1: O3 - Population-Weighted Exposure (PWE) by region: Percentage distribution by exposure range (2023)
ISPRA processing based on data from the Epidemiology Department of the Lazio Regional Health Service
PWE: Population Weighted Exposure
The four PWE classes correspond respectively to the WHO air quality guideline value and the two interim targets.
The indicator is consistent with those used at the European level by the EEA and at the global level by the World Health Organization (WHO) to monitor exposure. Moreover, it provides the basis (exposure assessment) for developing health risk assessments and burden of disease estimates, in line with the approaches adopted by these two international organisations.
With reference to the United Nations Sustainable Development Goals (SDGs), the methodological approach is consistent with that applied for the calculation of the indicator used to monitor progress towards Goal 11 (Make cities and human settlements inclusive, safe, resilient and sustainable), Target 11.6 (By 2030, reduce the adverse per capita environmental impact of cities, including by paying special attention to air quality and municipal and other waste management).
From a methodological perspective, the exposure estimate also represents the basis for developing one of the indicators used to monitor progress towards Goal 3 (Ensure healthy lives and promote well-being for all at all ages), Target 3.9 (By 2030, substantially reduce the number of deaths and illnesses from hazardous chemicals and air, water and soil pollution and contamination).