Giovanni Braca, Barbara Lastoria, Stefano Mariani, Francesca Piva, Robertino Tropeano
The 12-month Standardized Precipitation-Evapotranspiration Index (SPEI) maps provide a nationwide and large-scale assessment of drought conditions and are obtained by analyzing the deviation of the hydro-climatic balance hydrological variable—defined as the difference between precipitation and potential evapotranspiration—from its reference climatology.
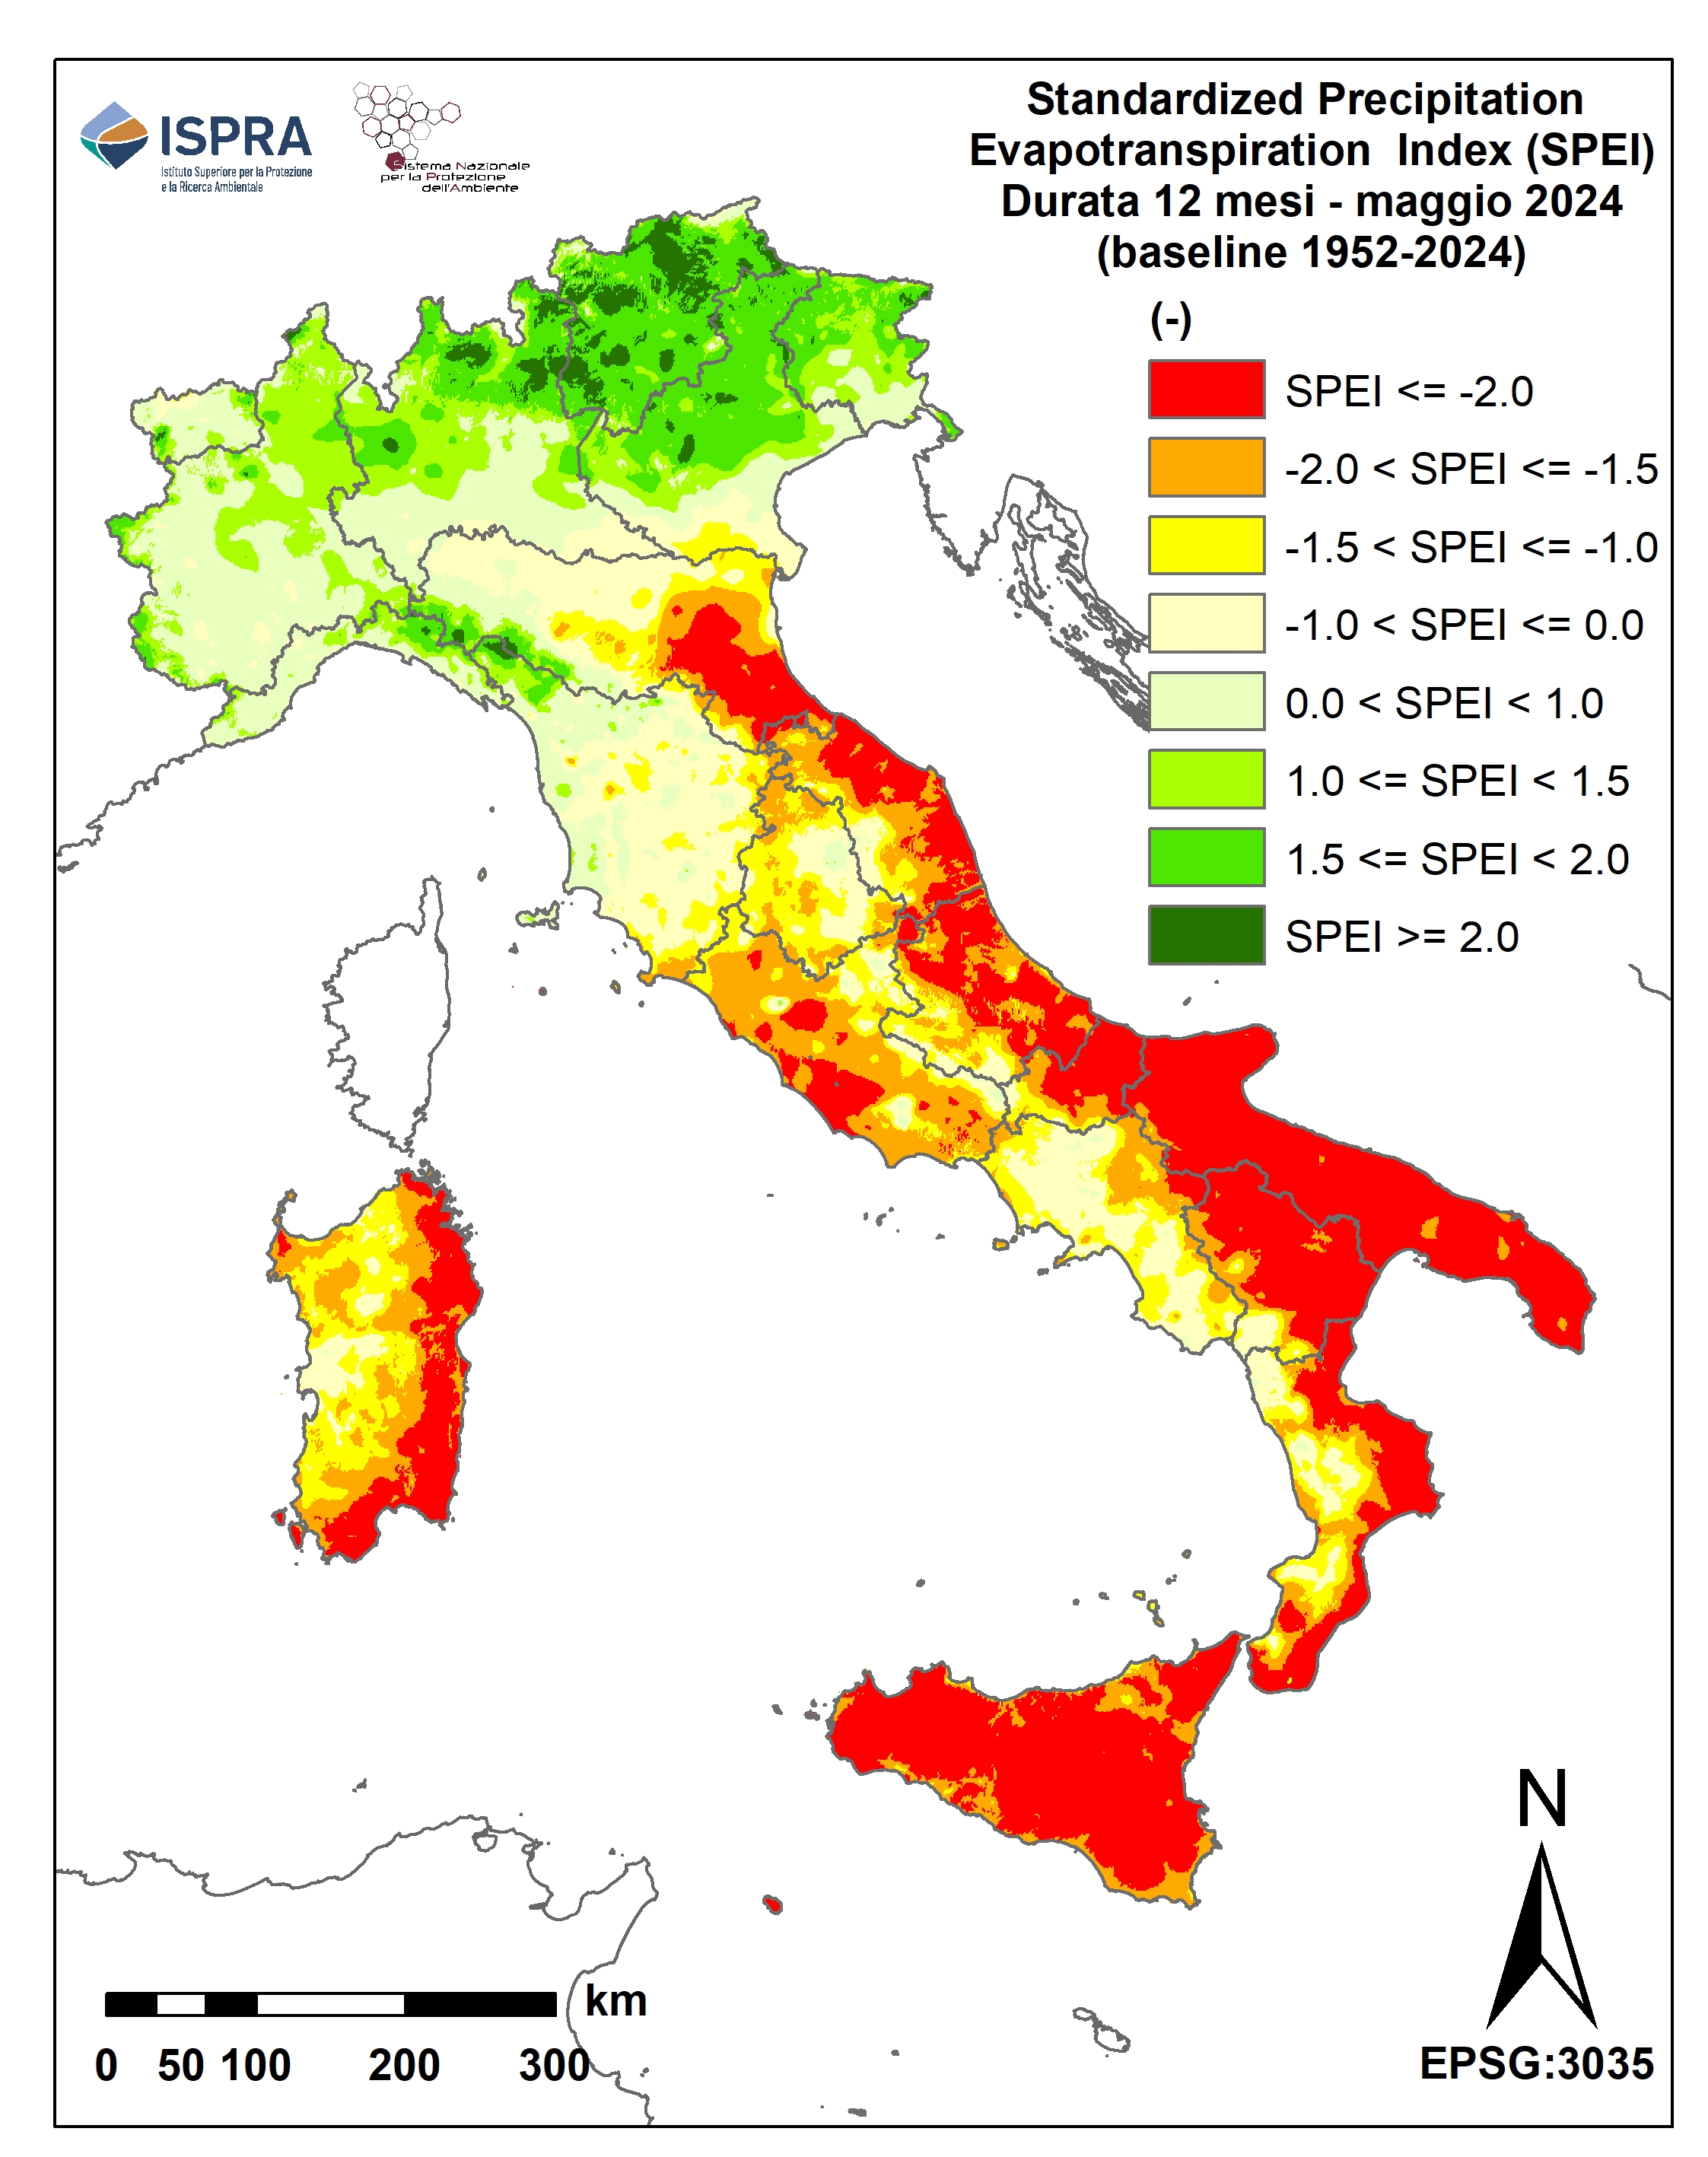
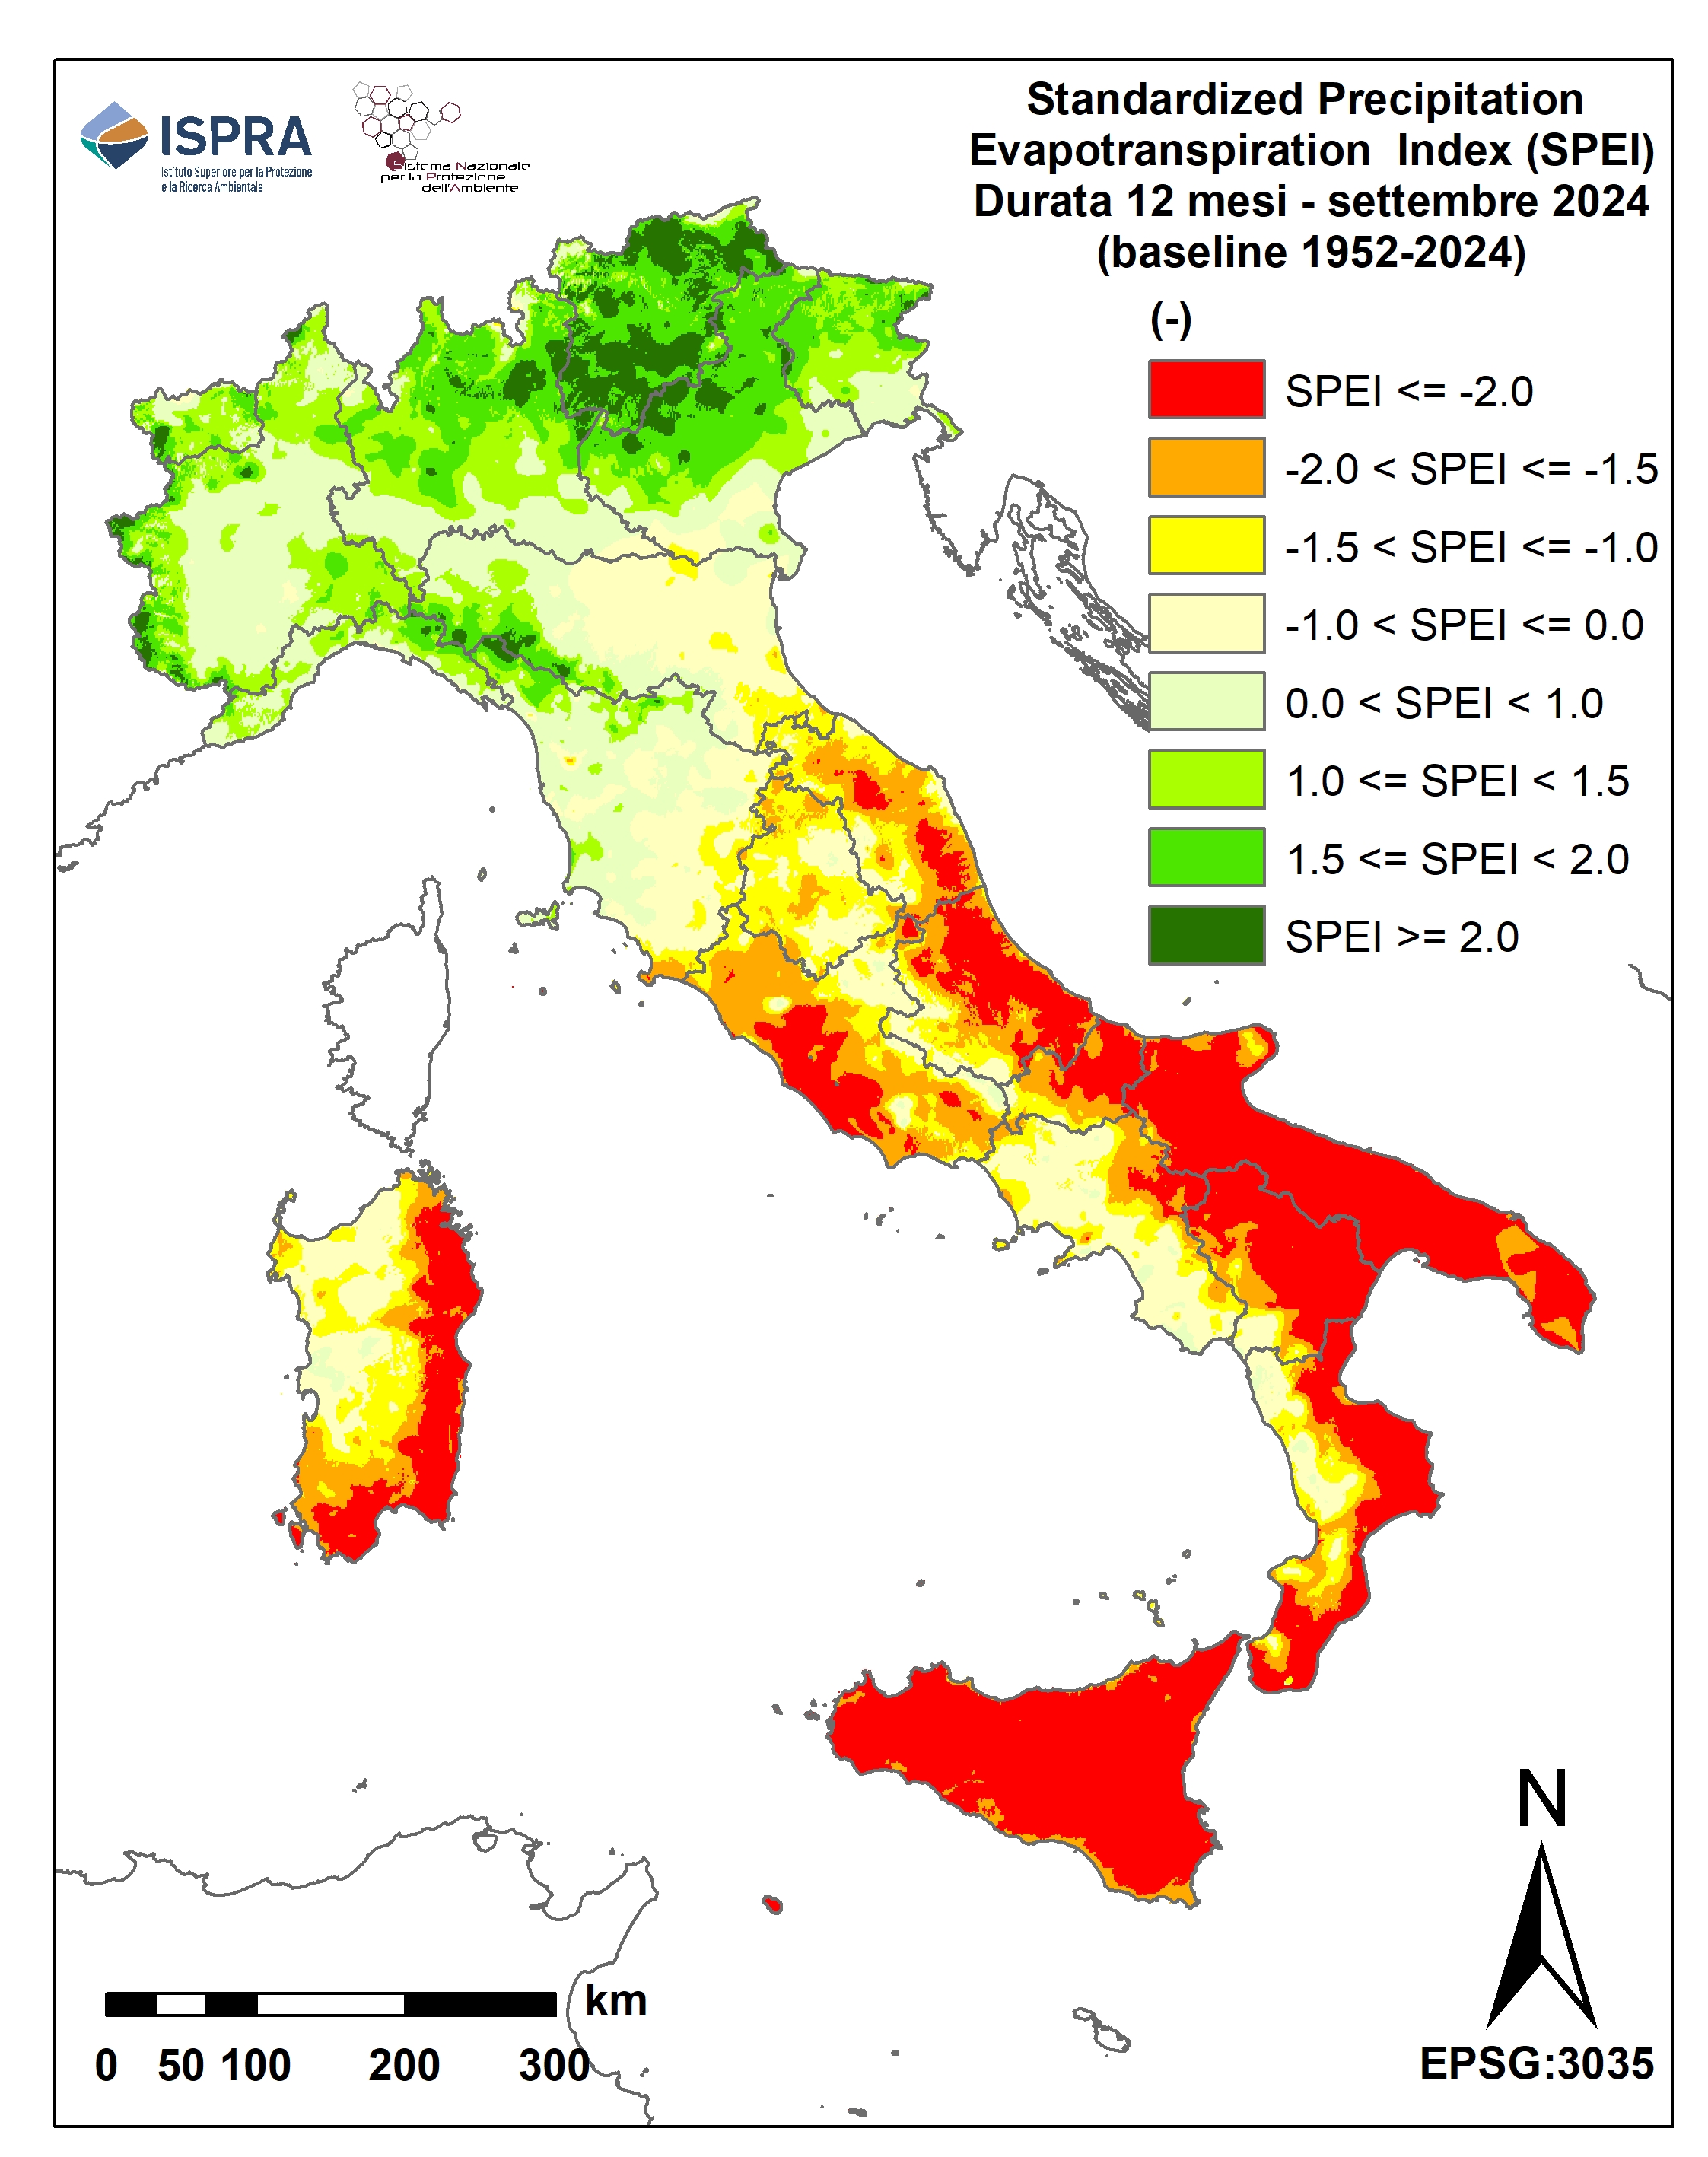
In 2024, the 12-month SPEI maps (SPEI12) highlight drought conditions, ranging from extreme to moderate, across central Italy, the South, and the major islands. The months from June to August 2024 were the most marked by extreme drought conditions on the 12-month timescale (SPEI12 ≤ –2.0), as a result of the precipitation deficit observed in the second half of 2023 and then in 2024, particularly in southern Italy, combined with the high temperatures that characterized all of 2024 (+1.33 °C anomaly in the average temperature compared to the 1991–2020 climatological mean).
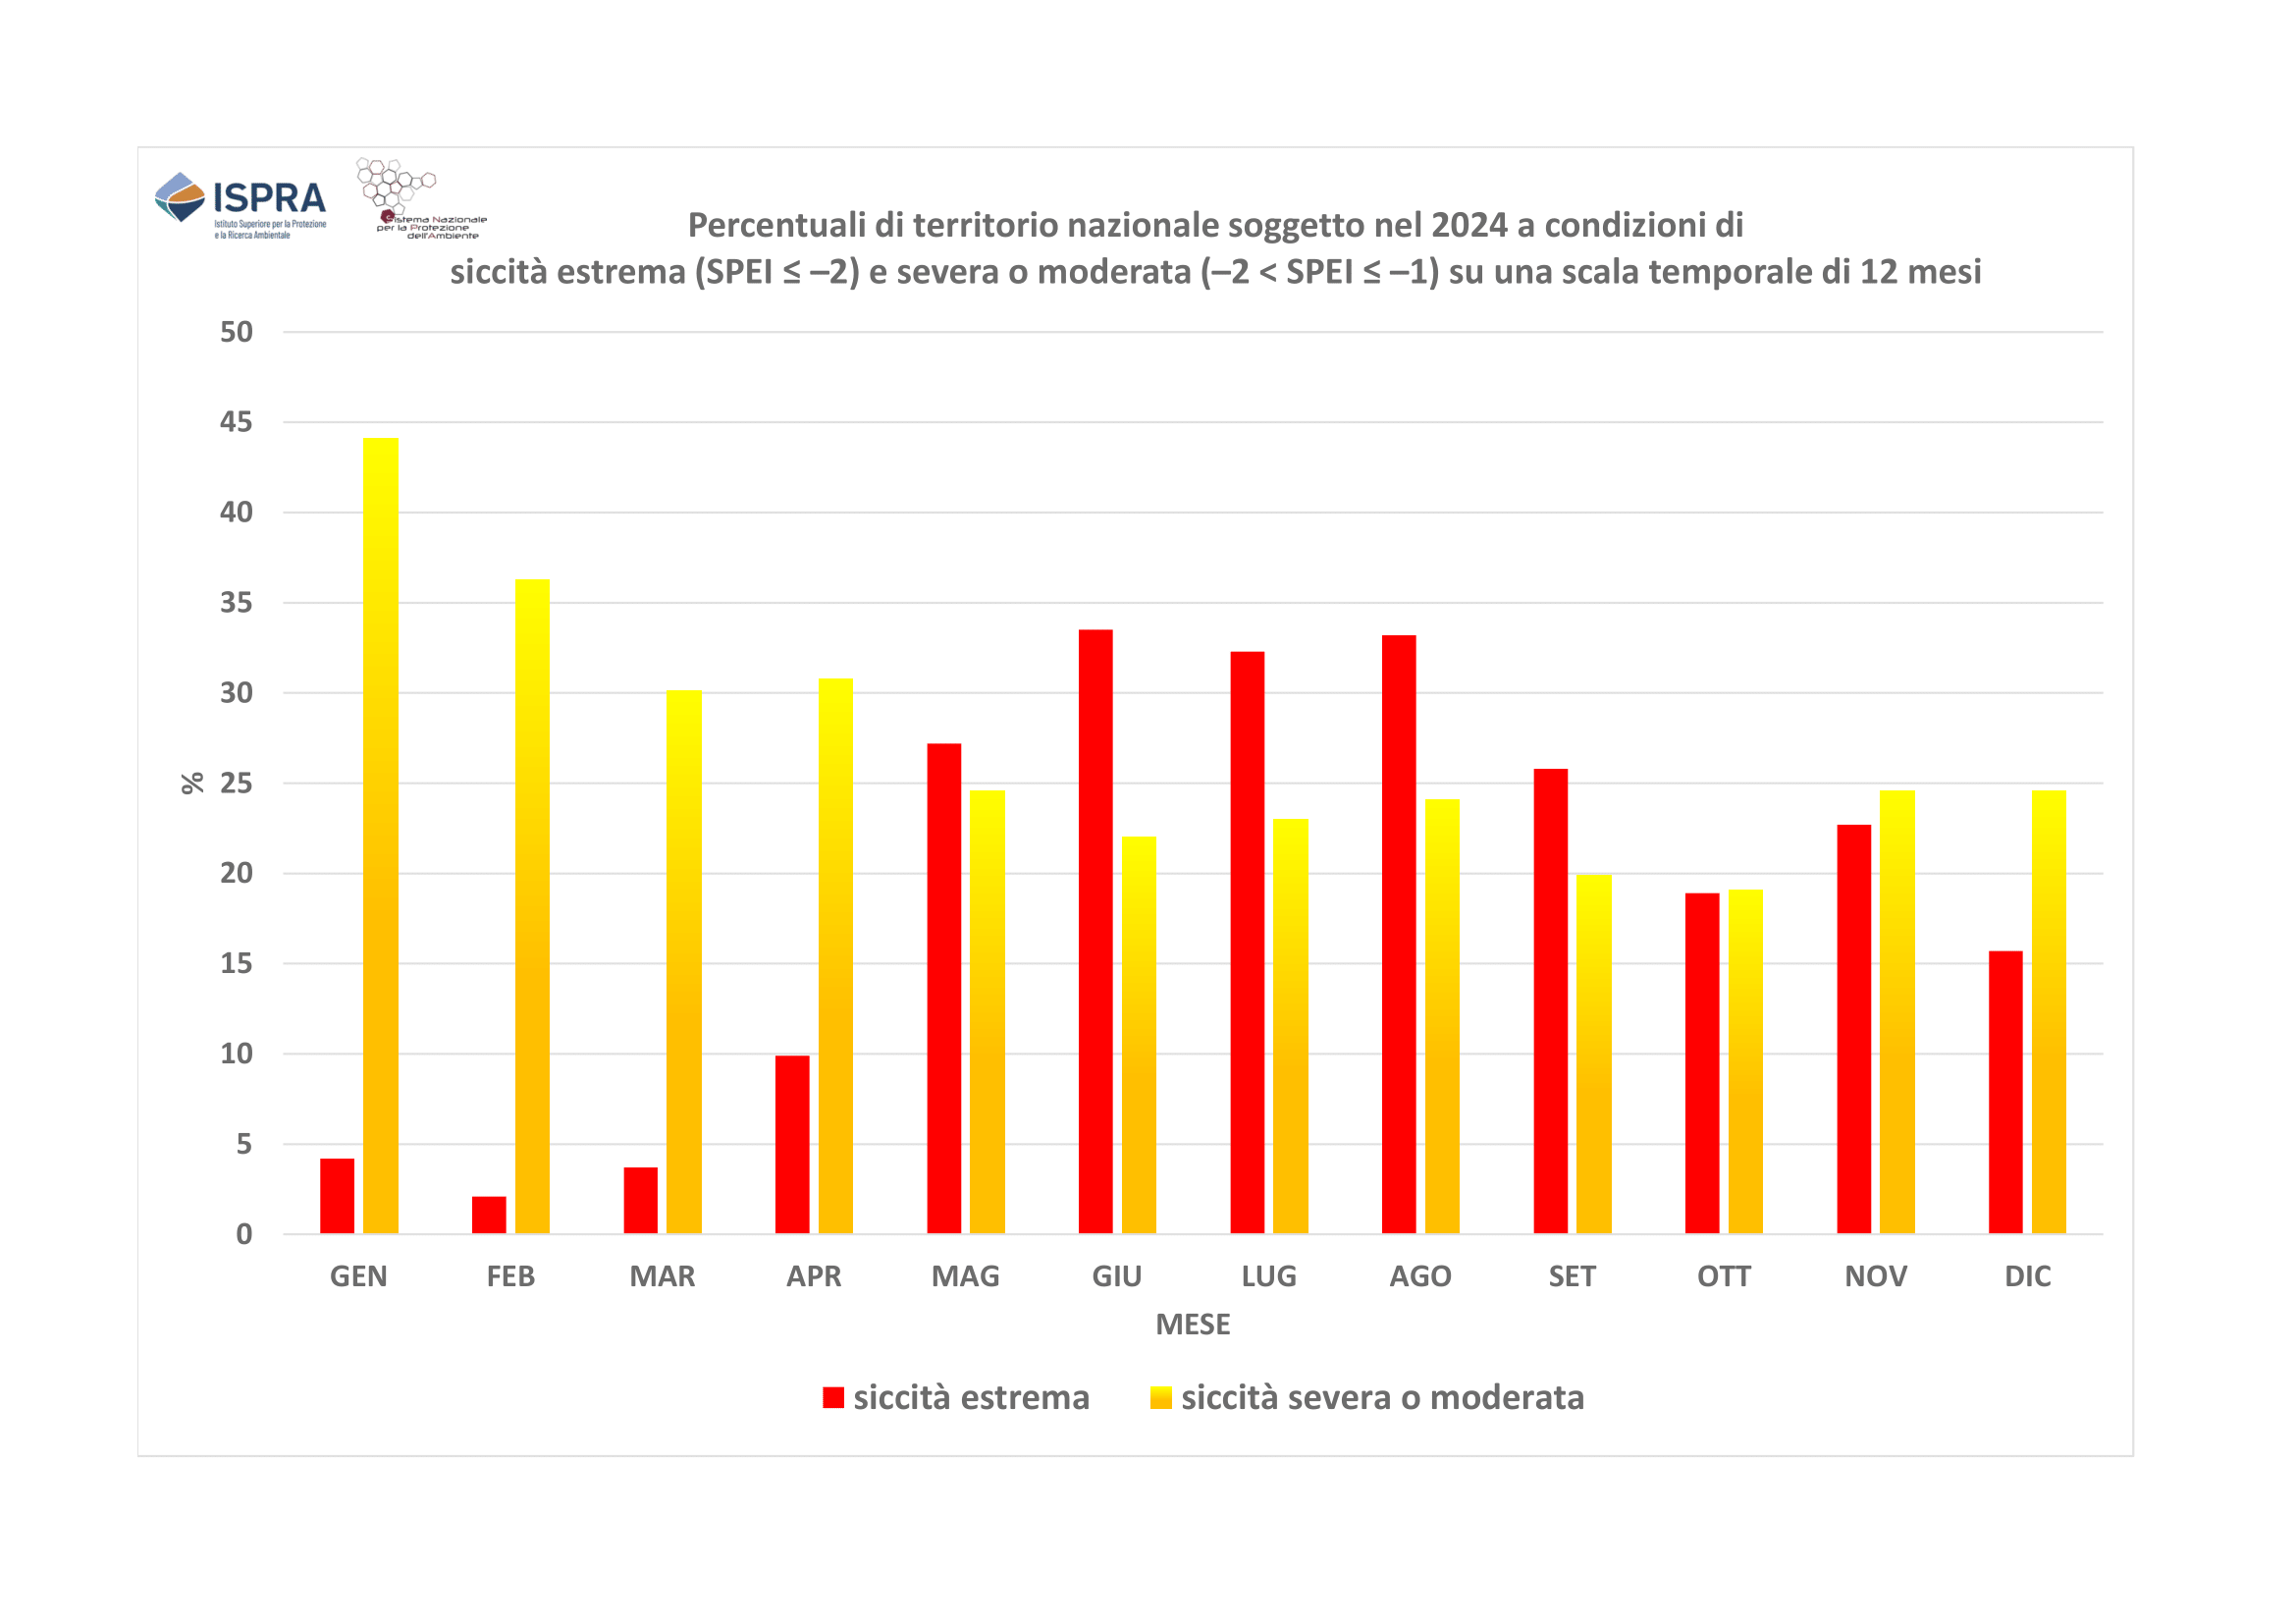
The maximum extent of the hydro-climatic balance deficit was reached in June, with 33.5% of the Italian territory affected by extreme drought. Early in the year, the percentage of areas experiencing severe or moderate drought on the 12-month timescale (–2.0 < SPEI12 ≤ –1.0) was significant: 44.1% in January, 36.3% in February, and around 30% in March and April.
The intensity and persistence of these conditions in 2024 affected water resource availability in various areas of Italy, consequently causing environmental and socio-economic impacts related to water use.
Drought is a natural and temporary weather condition in which there is a significant reduction in rainfall compared to climatic conditions of a certain place of interest. Therefore, it is not to be confused with the phenomenon of aridity, a term with which a permanent natural climatic condition is indicated in which the low amount of annual precipitation, associated with high temperatures, does not provide the soil with the necessary degree of humidity to promote the development of life.
There is no single definition of drought, although everyone is in agreement that drought is a temporary but frequent phenomenon, which can generate environmental, social and economic impacts. The drought phenomenon has different characteristics in the components of the hydrological cycle, which, in turn, produce different impacts on water systems, cultures and socio-economic and environmental systems. In relation to the effects produced, drought is generally classified into four categories:
meteorological drought in case of relative shortage of precipitation;
hydrological drought in the presence of a relatively low water supply in the soil, in waterways, or in aquifers;
agricultural drought in the event of a deficit in the water content to the soil that determines stress conditions in crop growth;
Socio-economic and environmental drought understood as the set of impacts that manifest themselves as an imbalance between the availability of the resource and the demand for economic activities, for social aspects and for the conservation of ecosystems.
The impact of drought on the environment is then linked to the severity and persistence of dry conditions. A shortage of prolonged rain for many months (6-12 months) will affect the flow rate of rivers; while for a longer period (one or two years) it will weigh on the availability of water in the aquifers.
The Standardized Precipitation-Evapotranspiration Index (SPEI) is one of the indices used nationally and internationally to quantify drought on a given time scale. Compared to the Standardized Precipitation Index (SPI), which considers precipitation (P) to be calculated in the calculation, the SPEI also takes into account potential evapotranspiration (ETP or PET) as a second element of the hydro-climatic balance (i.e., P. ETP). Therefore, the SPEI index also includes the effect of the evapotrapulative component in the monitoring of dry events, the impact of which has become increasingly relevant with the increase in temperatures due to climate change. High rates of evapotranspiration due to high temperatures can significantly affect the processes of soil-atmosphere interaction and therefore the mechanisms of formation of surface outflows, as well as infiltration and consequent recharging to the underground water bodies.
Positive values of the index show a higher hydro-climatic balance than the reference climatology, i.e. wet conditions, while negative values indicate a smaller hydro-climatic balance of climatology, i.e. more or less extreme dry conditions. This index is often used at regional and / or hydrographic district for the monitoring and detection of dry periods, using the rainfall and temperatures recorded by the regional rain showers and autonomous provinces for its calculation. In addition, it has been included both in Europe (from the “Water Scarcity & Drought” Expert Group of the Common Implementation Strategy for the Water Framework Directive 2000/60/EC) and international (from the World Meteorological Organization) as one of the tools for drought monitoring. Last but not least, the SPEI indicator has also been included in the National Guidelines that identify the common set of indicators to be adopted in the Permanent District Observatories for Water Uses (established in 2016 as a measure of Plan within the meaning of the Water Framework Directive 2000/60/EC and the body of the District Basin Authorities pursuant to D.L. 39/2023) in the monitoring of drought and water scarcity.
For each area under consideration, the calculation of the SPEI is based on the normalization of the probability distribution of the variable P (hydro-climate turmoil) aggregated on different time scales (e.g. 1, 3, 6, 12, 24 or 48 months). In doing so, regions with different climate regimes are comparable. In order to achieve a national-wide and large-scale assessment of hydrological drought conditions, 12-month SPEI maps are used, taking as precipitation and potential evapotran expansive data on the regular resolution grid 1 km of the BIGBANG hydrological budget model of ISPRA and as a climate reference the period 1952-2024 (reference baselines).
Quantify the drought conditions of a given place in terms of statistical deviation of the hydro-climatic balance (P) aggregated to a certain time scale with respect to the corresponding reference climatology. As a normalised index, it makes it possible to make regions with different climate regimes comparable. Consequently, dry climate regions and wetter climate regions are monitored in the same way in a single themed map.
The severity levels of wetness and drought events in terms of SPEI, associated with surplus and deficit in the hydro-climatic balance (P ‒ PET), are those defined in the literature: SPEI ≥ 2.0 extreme wetness; 1.5 ≤ SPEI < 2.0 severe wetness; 1.0 ≤ SPEI < 1.5 moderate wetness; –1.0 < SPEI < 1.0 normal; –1.5 < SPEI ≤ –1.0 moderate drought; –2.0 < SPEI ≤ –1.5 severe drought; SPEI ≤ –2.0 extreme drought.
The current Italian legislation does not establish specific environmental targets for the SPEI index. Nonetheless, the SPEI is included in the common set of indicators used to assess drought and water scarcity conditions by the permanent District Observatories for water use. It is noted that the Observatories, established in 2016 for each river basin district as a measure under the Water Management Plan, in accordance with the Water Framework Directive 2000/60/EC, are currently also bodies of the corresponding River Basin District Authority, pursuant to:
-
Legislative Decree No. 152/2006, titled "Environmental regulations" (Official Gazette General Series No. 88 of 14-04-2006 – Ordinary Supplement No. 96).
-
Decree-Law No. 39/2023, titled "Urgent provisions to address water scarcity and to strengthen and upgrade water infrastructure" (Official Gazette General Series No. 88 of 14-04-2023), converted with amendments by Law No. 68/2023 (Official Gazette General Series No. 136 of 13-06-2023), which established the permanent district observatories on water use at the river basin district authorities through a primary legislative act.
-
European Water Resilience Strategy, adopted by the European Commission on 4 June 2025.
- Ahmad, M. I., C. D. Sinclair, and A. Werritty, 1988: Log-logistic flood frequency analysis. J. Hydrol., 98, 205–224.
- Braca, G., Mariani, S., Lastoria, B., Tropeano, R., Casaioli, M., Piva, F., Marchetti, G., e Bussettini, M., 2024: Bilancio idrologico nazionale: stime BIGBANG e indicatori sulla risorsa idrica. Aggiornamento al 2023. Rapporti n. 401/2024, ISPRA, Roma. Disponibile online all’indirizzo: https://www.isprambiente.gov.it/it/pubblicazioni/rapporti/bilancio-idrologico-nazionale-stime-bigbang-e-indicatori-sulla-risorsa-idrica-aggiornamento-al-2023.
- Braca, G., Mariani, S., Lastoria, B., Piva, F., Archi, F., Botto, A., Casaioli, M., Forte, T., Marchetti, G., Peruzzi, C., Tropeano, R., Vendetti, C., e Bussettini, M., 2023: Bilancio idrologico nazionale: focus su siccità e disponibilità naturale della risorsa idrica rinnovabile. Aggiornamento al 2022. Rapporti n. 388/2023, Roma https://www.isprambiente.gov.it/it/pubblicazioni/rapporti/bilancio-idrologico-nazionale-focus-su-siccita-e-disponibilita-naturale-della-risorsa-idrica-rinnovabile-aggiornamento-al-2022.
- Braca, G., Bussettini, M., Lastoria, B., Mariani, S., e Piva, F., 2021: Il Bilancio Idrologico Gis BAsed a scala Nazionale su Griglia regolare – BIGBANG: metodologia e stime. Rapporto sulla disponibilità naturale della risorsa idrica. Rapporti n. 339/21, Roma. Disponibile online all’indirizzo: https://www.isprambiente.gov.it/it/pubblicazioni/rapporti/il-bilancio-idrologico-gis-based-a-scala-nazionale-su-griglia-regolare-bigbang.
- Edwards, D. C., and McKee, T. B., 1997: Characteristics of 20th century drought in the United States at multiple time scales. Climatology Rep. 97–2, Department of Atmospheric Science, Colorado State University, Fort Collins, Colorado, 155 pp.
- Mariani, S., Braca, G., Lastoria, B., Tropeano, R., Casaioli, M., Piva, F., Bussettini, M., 2024: “Il bilancio idrologico, la disponibilità di risorsa idrica e il bilancio idrico”, in Siccità, scarsità e crisi idriche, Emanuele Romano, Ivan Portoghese (a cura di), Habitat signa 1, 29-46. Roma: Cnr Edizioni. Disponibile online all’indirizzo: https://www.cnr.it/sites/default/files/public/media/attivita/editoria/SiccitaInterattivo_ver2.pdf.
- Mariani, S., e AA.VV., 2020: Note tecniche su crisi idriche, siccità e servizio idrico integrato – Manuale UTILITALIA. ISBN: 978 88 998 7903 7.
- Mariani, S., Braca, G., Romano, E., Lastoria, B. e Bussettini, M., 2018: Linee Guida sugli Indicatori di Siccità e Scarsità Idrica da utilizzare nelle Attività degli Osservatori Permanenti per gli Utilizzi Idrici, Pubblicazione progetto CReIAMO PA, 66 pp. Disponibile online all’indirizzo: http://www.isprambiente.gov.it/pre_meteo/idro/Osservatori/Linee%20Guida%20Pubblicazione%20Finale%20L6WP1_con%20copertina_ec.pdf.
- McKee, T. B., Doesken, N. J., and Kleist, J., 1993: The relationship of drought frequency and duration of time scales. Eighth Conference on Applied Climatology, American Meteorological Society, Jan 17–23, 1993, Anaheim CA, pp. 179–186.
- Panofsky, H. A., and Brier, G. W., 1958: Some applications of statistics to meteorology. Pennsylvania State University, University Park, 224 pp.
- Thom, H. C. S., 1966: Some methods of climatological analysis. WMO N. 199. Technical Note N. 81., Ginevra, 53 pp.
- Thornthwaite, C.W., 1948: An approach towards a rational classification of climate, Geogr. Rev., 38, 55–89.
- SNPA, 2024: Il clima in Italia nel 2023. Report SNPA n. 42/202. Disponibile online all’indirizzo: https://www.snpambiente.it/snpa/il-clima-in-italia-nel-2023/.
- Vicente-Serrano, S. M., Beguería, S., and López-Moreno, J. I., 2010: A Multiscalar Drought Index Sensitive to Global Warming: The Standardized Precipitation Evapotranspiration Index. J. Climate, 23, 1696–1718.
- WMO, 2016: Handbook of Drought Indicators and Indices, WMO-No. 1173, Gineva.
- WMO, 2012: Standardized Precipitation Index User Guide, WMO-No. 1090, Ginevra.
- WMO, 2009: Experts agree on a universal drought index to cope with climate risks. Press Release No. 872.
-
-
ISPRA
Regional hydro-meteorological services and autonomous provinces
The precipitation and temperature data used are mainly those collected and published by the regional and provincial structures to which, according to Article 92 of Legislative Decree no. 112 of 31 March 1998, the functions and tasks of the peripheral offices of the National Hydrographic and Tire Service (SIMN, now merged into ISPRA) of the Department for National Technical Services, were transferred. The precipitation data are collected directly from the regional structures and autonomous provinces, while for the temperature the maps produced under the SCIA system of ISPRA (http://www.scia.isprambiente.it) are used. The precipitation, temperature and evapotranspiration data on the regular grid of the 1 km resolution BIGBANG, which covers the entire national territory, are available on the Groupware portal of ISPRA (https://groupware.sinanet.isprambiente.it/bigbang-data/library/bigbang-90).
National
January–December 2024
The SPEI is a statistical indicator based on the comparison between the hydrological hydro-climate balance (BIC) variable, observed (or estimated) in a given place and in a given period t of months (where t is 12 months in the indicator published here) with the long-term distribution of the same variable for that particular aggregated place for the same period of t. The BIC hydrological variable is obtained as a difference between precipitation (P) and potential evapotranspiration (ETP or PET). In other words, if you want to calculate the 12-month SPEI at the end of June for a given year, the BIC variable will be compared in the period from July of the year before to June of the year under review with the long-term series of the BIC cumulated on the July-June period observed in past years (its reference climatology).
Operationally, for each month under review and for each box of the grating are considered the monthly precipitation data spatialized on the grid at 1 km of the BIGBANG and the monthly estimates of the potential evaporation produced on the same grid by the BIGBANG. The method of calculation used in the BIGBANG for evapotranspiration for the month i-th is Thornthwaite:
ETP 16 x bi x (10 Ti / I)"a
where Ti is the average monthly temperature and (bi, I, a) are coefficients that depend only on the monthly temperature, month of the year and the latitude.
Starting from the monthly series of P and ETP, the X series of the annual cumulative of the BIC hydrological variable is defined as BIC – ETP (the analysed random variable) which is interpolated with a 3-metric Logistic Log Log distribution (LL3) which is transformed into a Standardized N(0,1) distribution. The three parameters of the LL3 distribution are estimated by the probability-weighted moment method (PWM).
The transformation retains the cumulative probability, in the sense that the probability of the random variable X (the variable BIC accumulated over 12 months in the specific case) of being below a certain value in the LL3 distribution is equal to the probability of the normally distributed transformed variable to be below the transform of that value.
Since the SPEI is distributed according to a normal probability function, both dry periods and damp periods can be monitored. Negative values of SPEI correspond to drier periods compared to climatology, i.e. they indicate a hydro-climatic budget deficit (drought), while positive values of SPEI correspond to more humid periods, i.e. they indicate a surplus of the hydro-climate budget. The greater the distance from climatology (i.e. from the reference regime), the greater the severity of the event. In addition, the normalization that underlies this index allows to represent in the same way and on a same map areas prone to different climatologies.
During 2024, extreme to moderate drought conditions affected large areas of the South and the major islands as well as, in a lesser way, Central Italy. Humidity conditions, i.e. precipitation surplus compared to the average reference values, have characterized Northern Italy.
On a 12-month time scale, the standardized hydro-climatic budget indicator highlighted, in terms of affected areas, a worsening of the situation from May 2024..
-
| Data |
|---|
Thumbnail
Headline
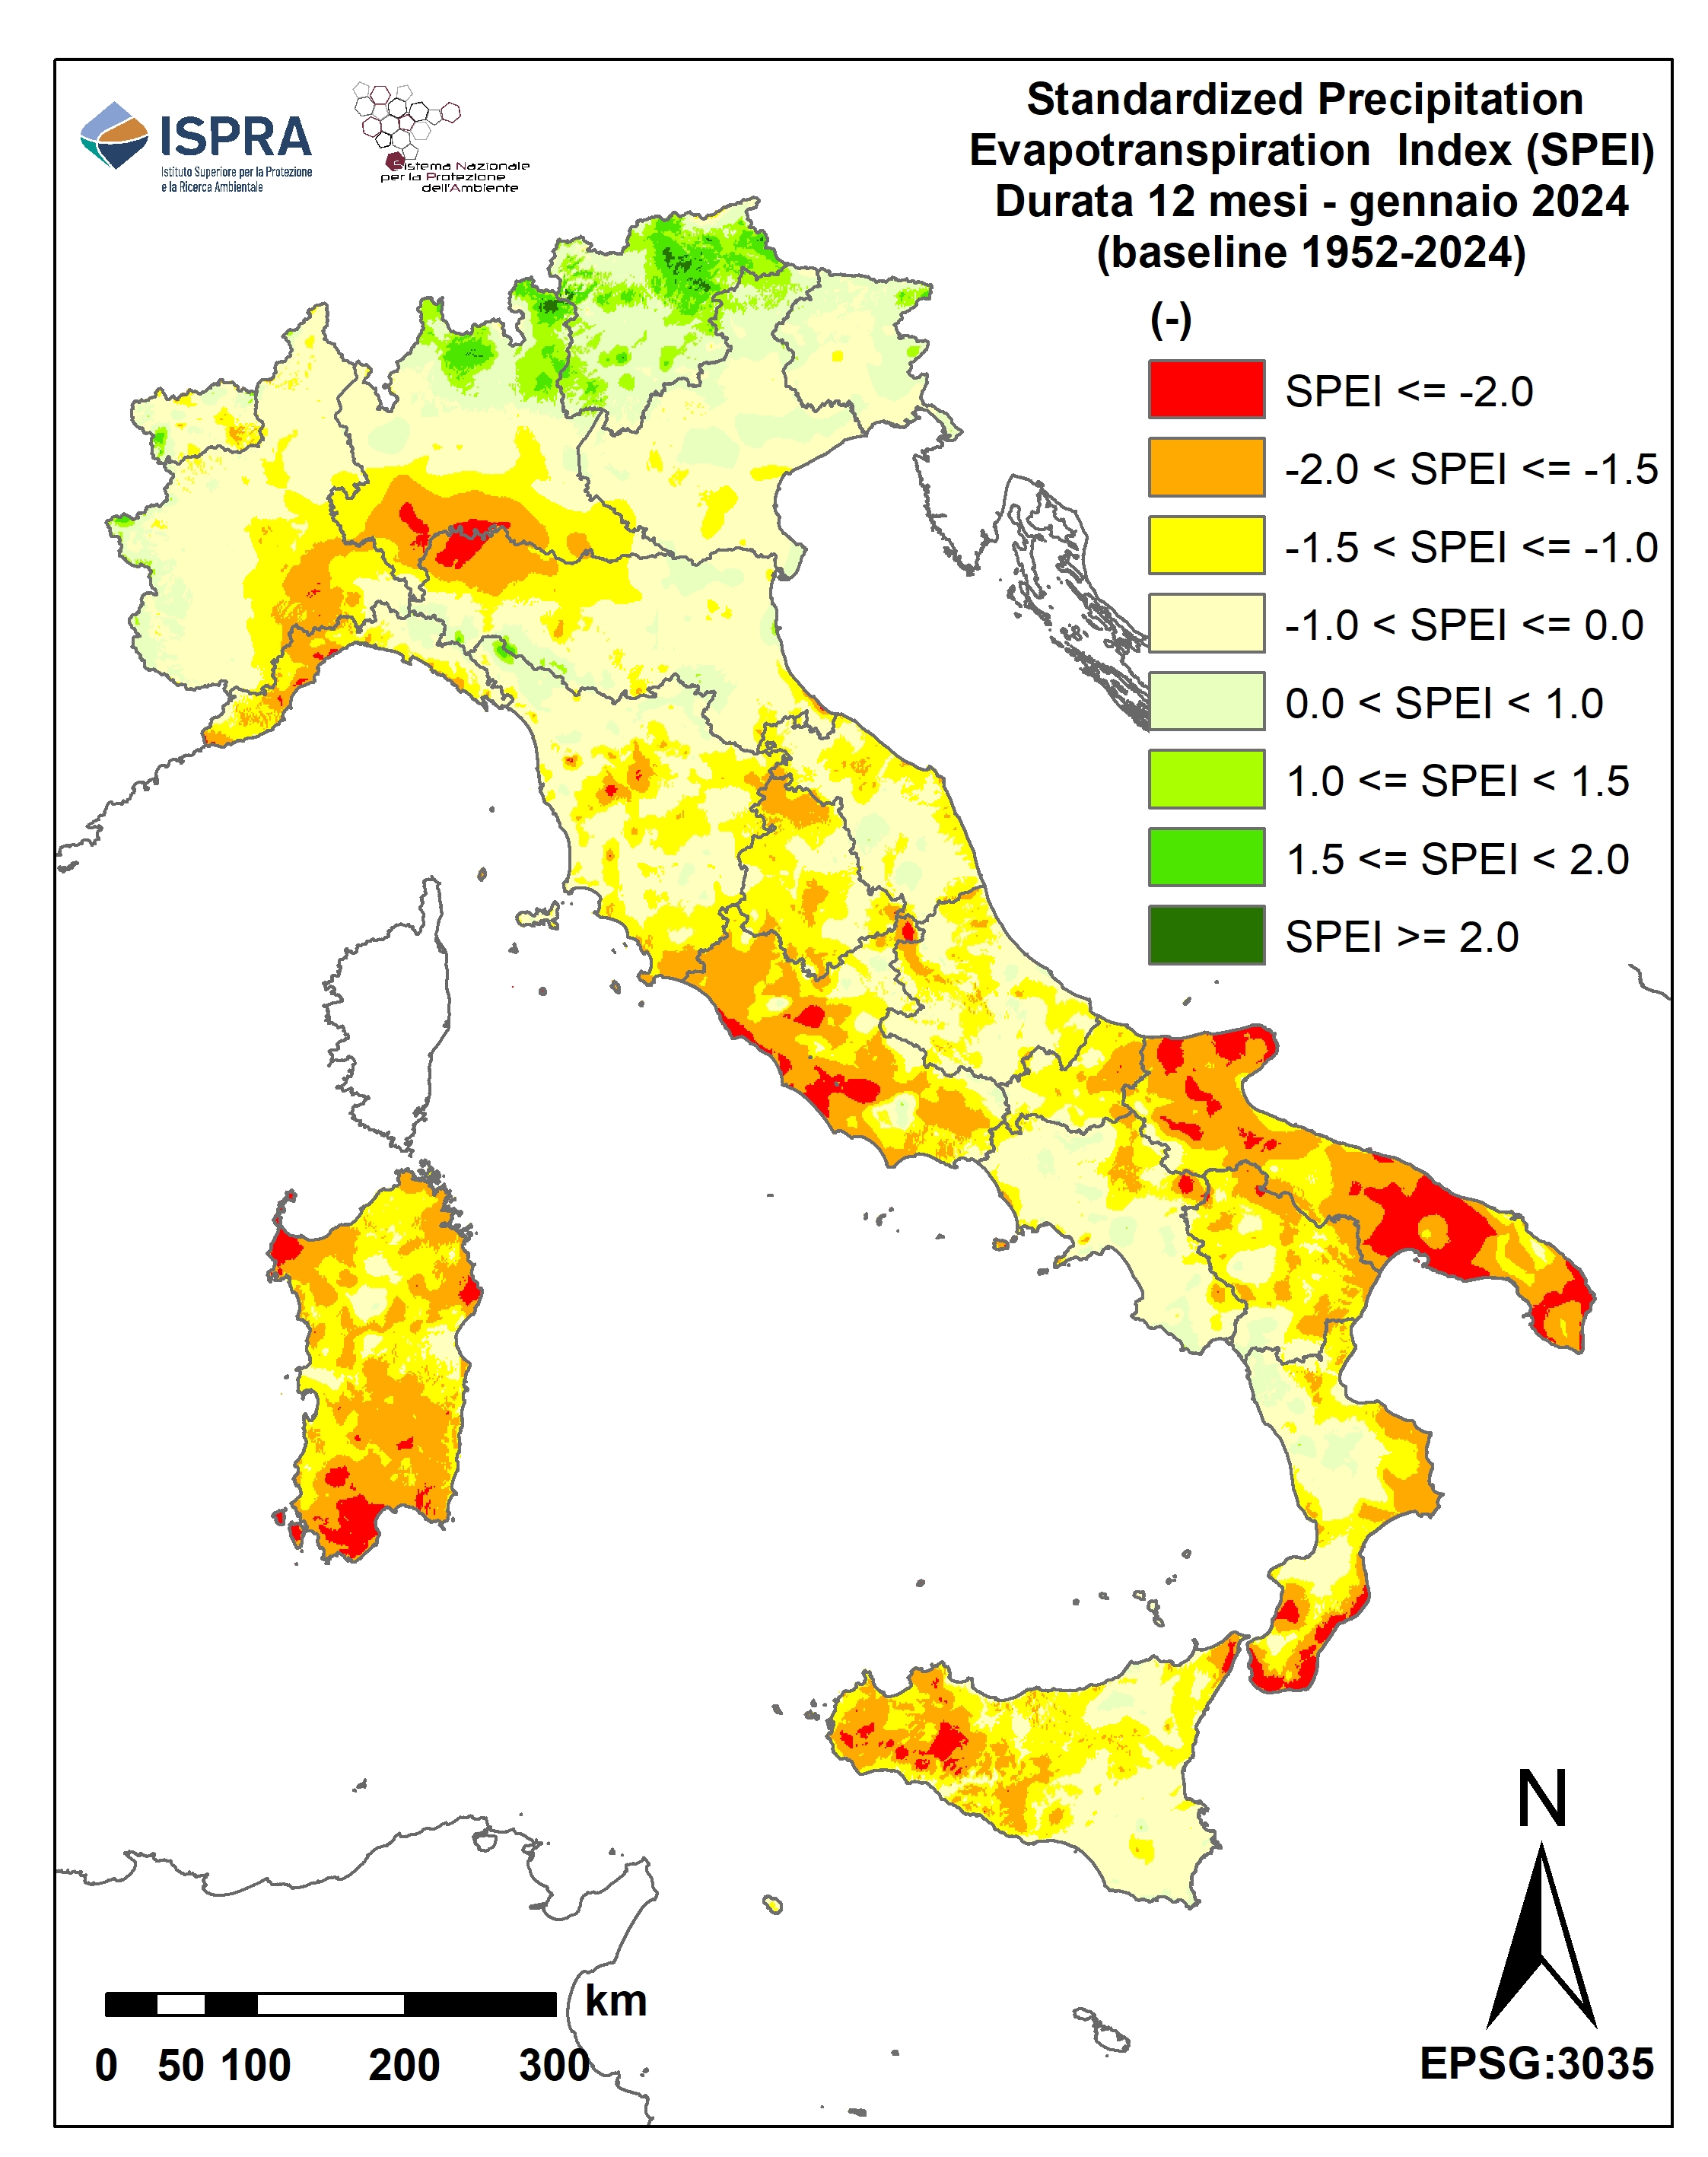
Figure 1: SPEI at 12 months - January 2024 Data source
ISPRA elaboration on data from regional hydro-meteorological offices and autonomous provinces and on historical data of the Suppressed SIMN Data legend
|
Thumbnail
Headline
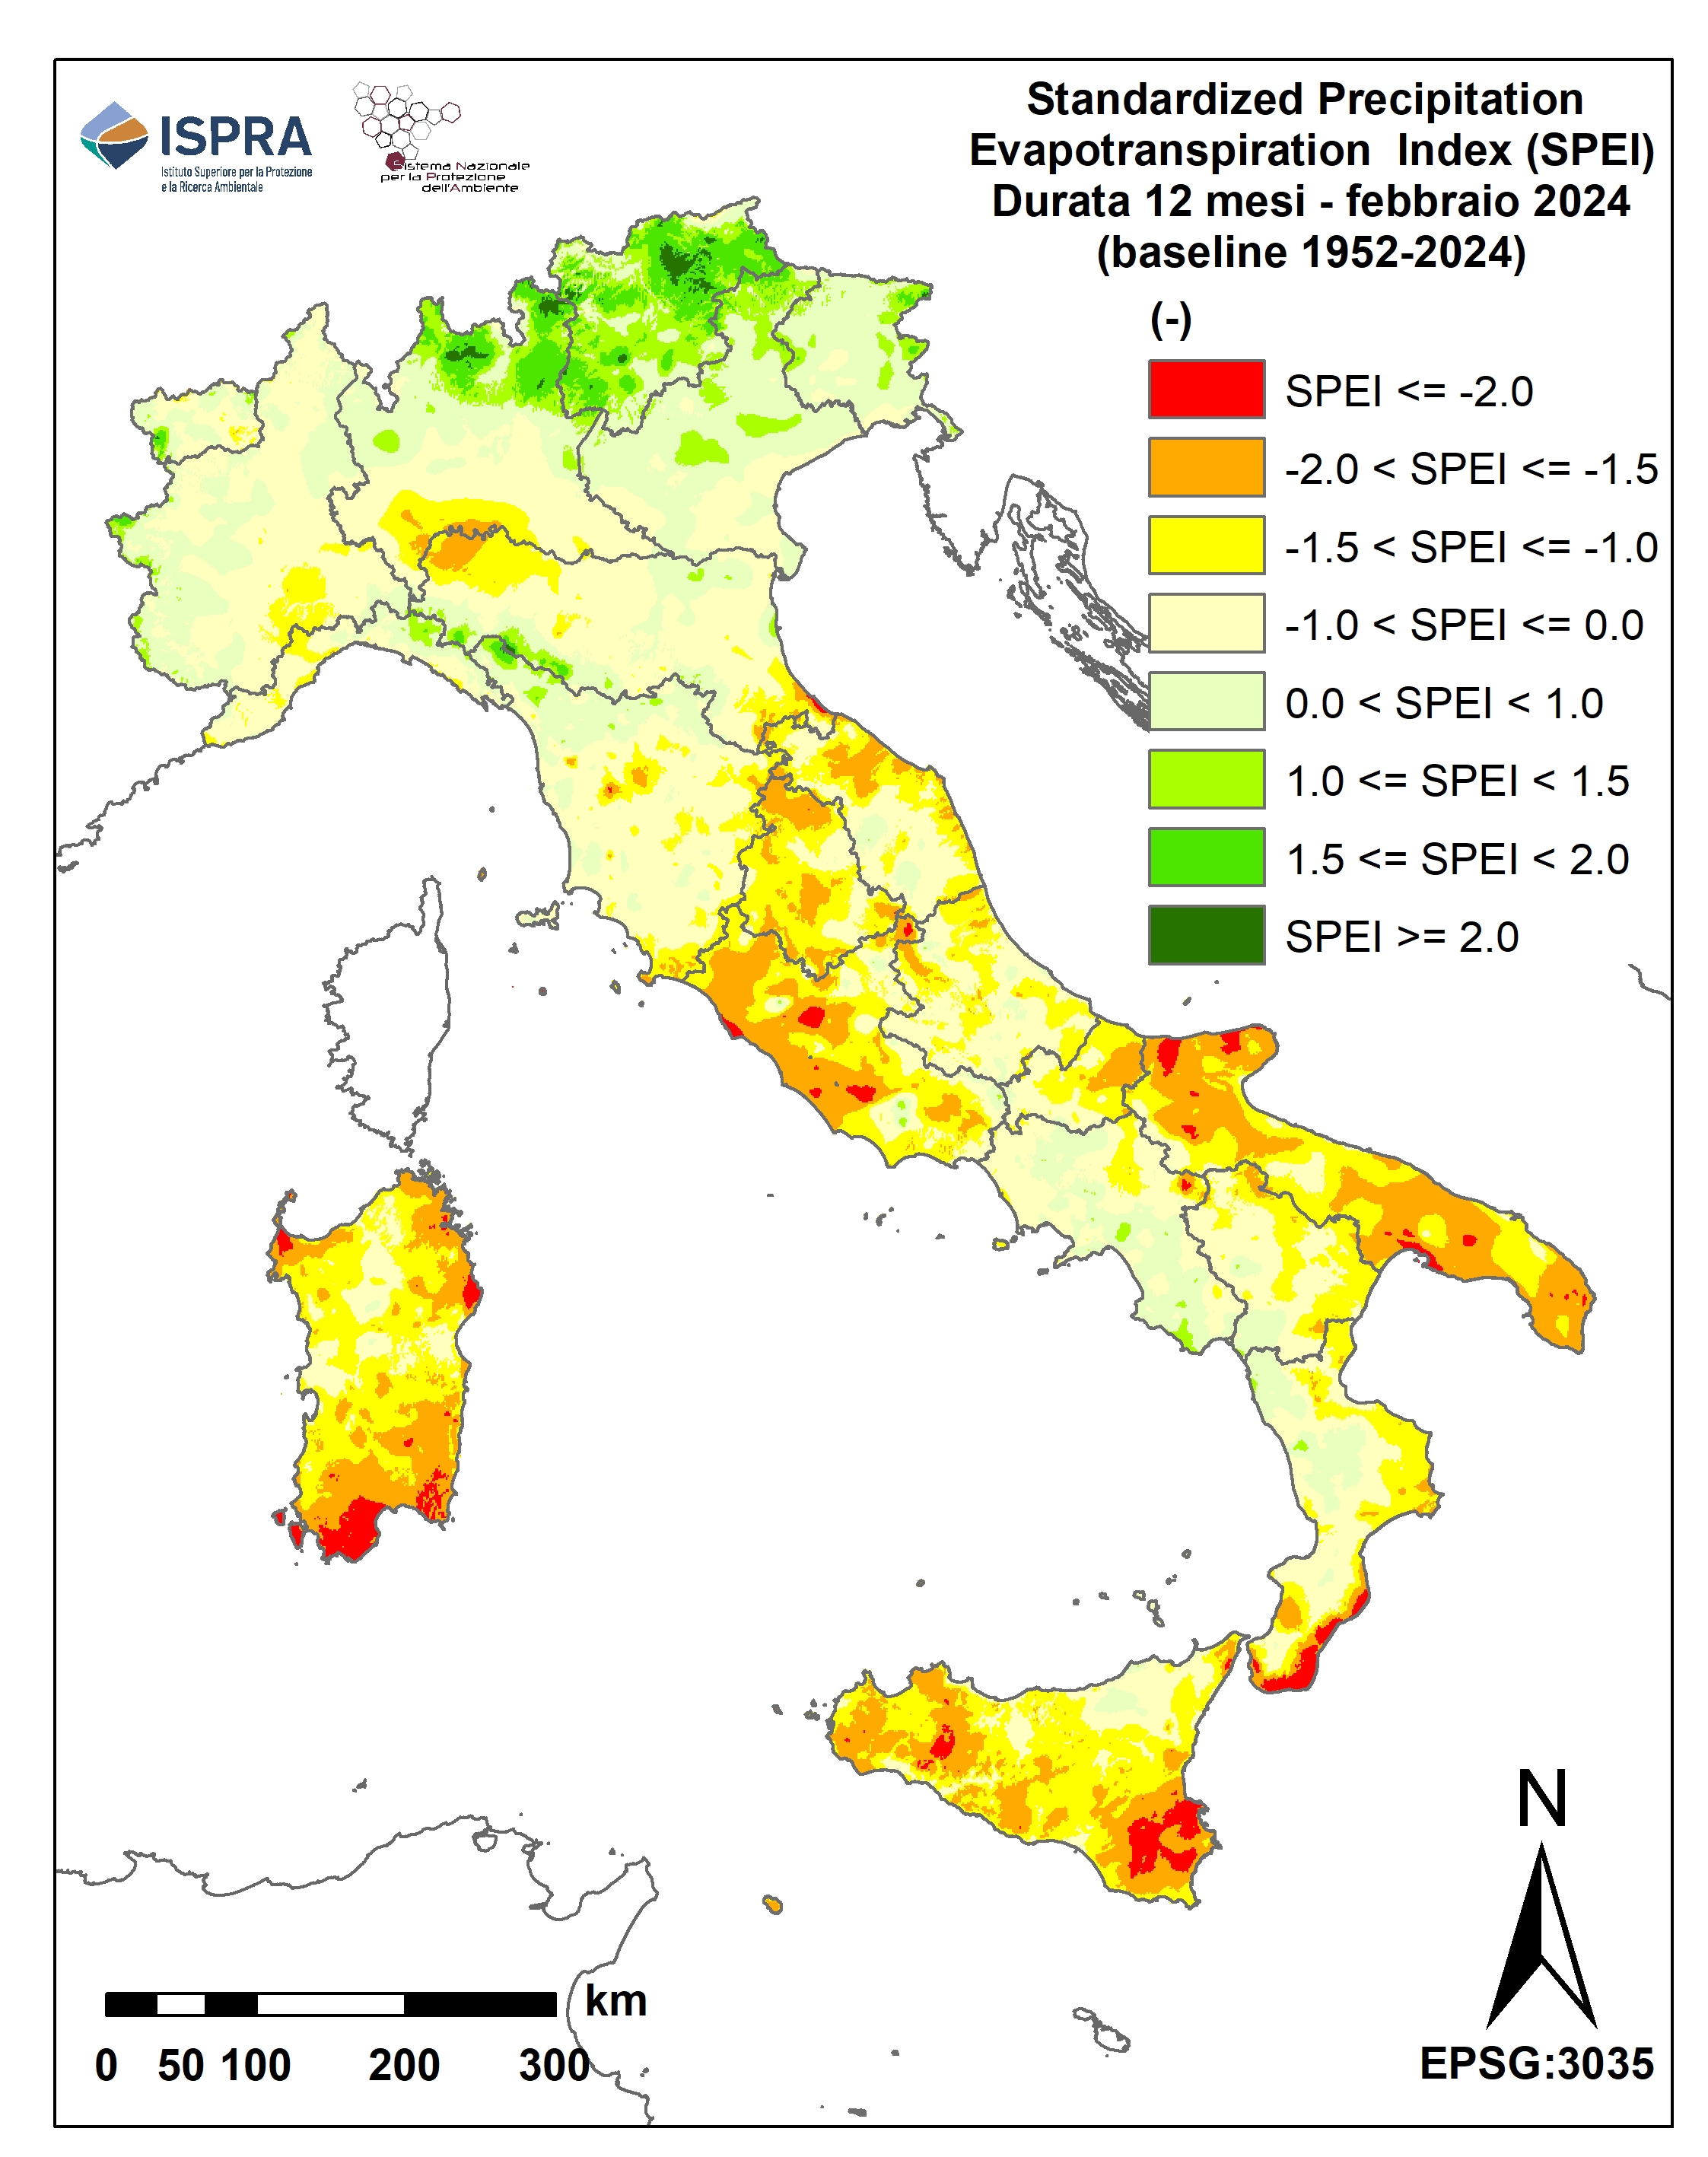
Figure 2: SPEI at 12 months - February 2024 Data source
ISPRA elaboration on data from regional hydro-meteorological offices and autonomous provinces and on historical data of the Suppressed SIMN Data legend
|
Thumbnail
Headline
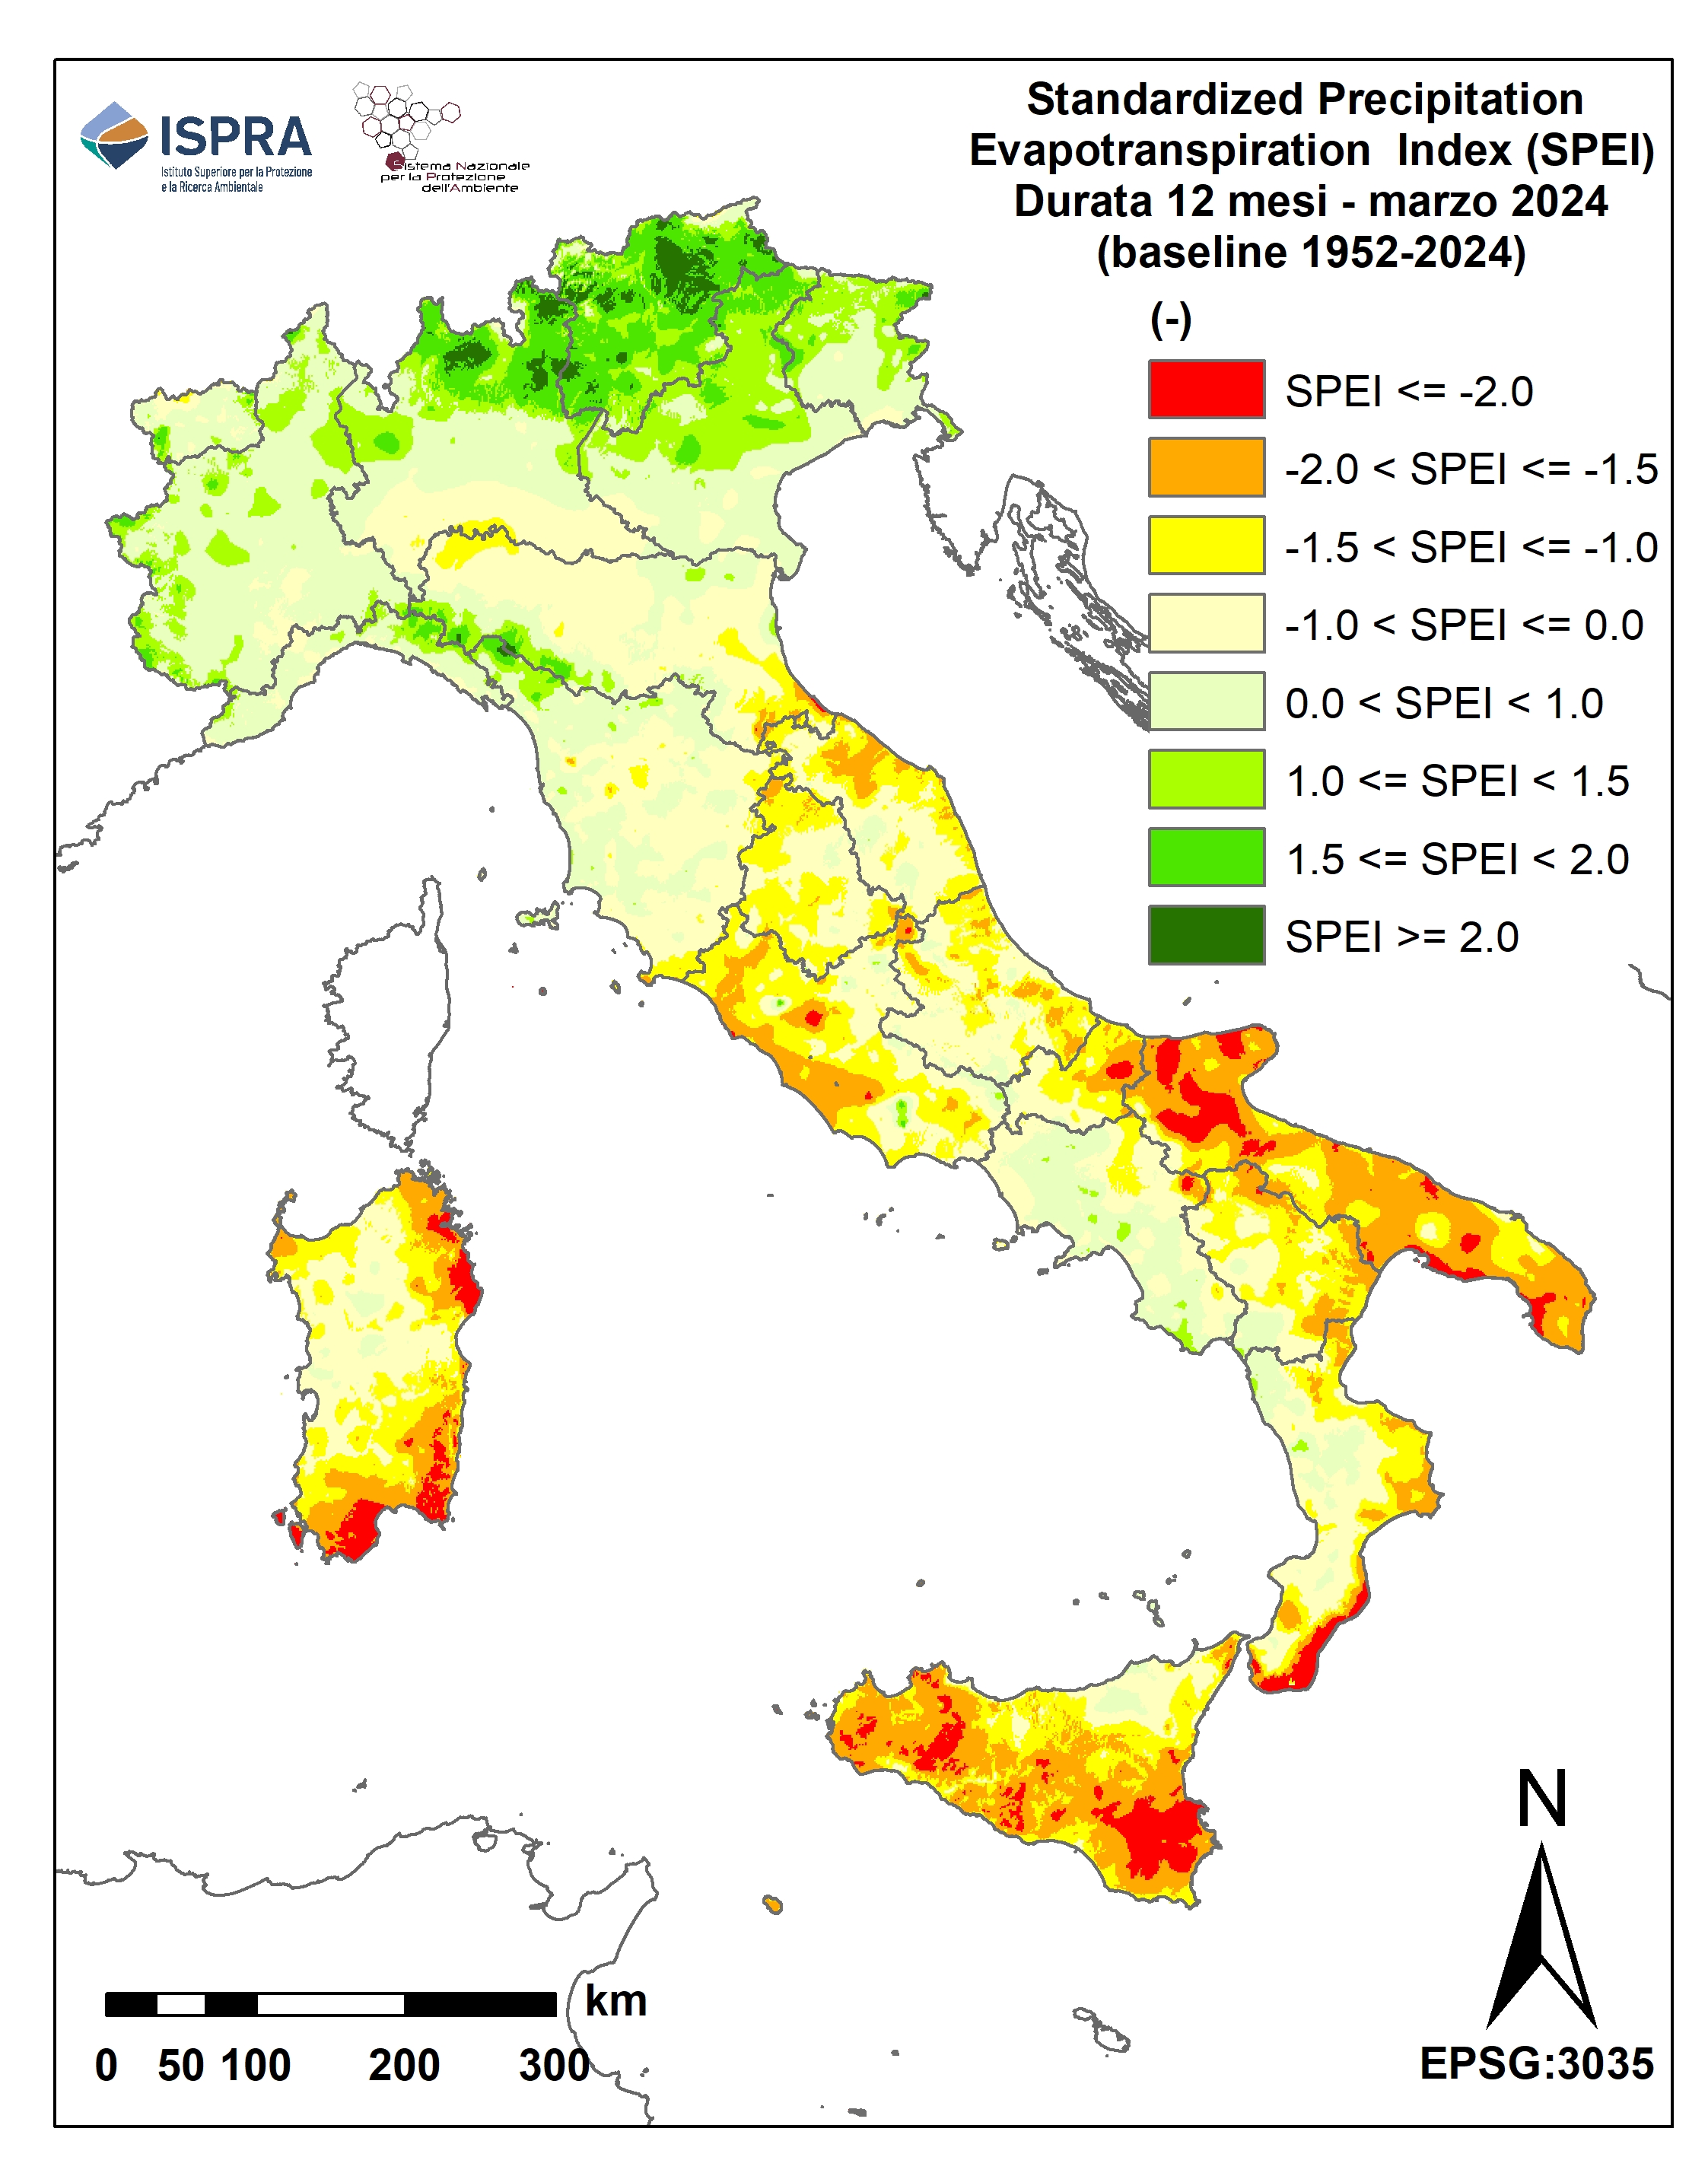
Figure 3: SPEI at 12 months - March 2024 Data source
ISPRA elaboration on data from regional hydro-meteorological offices and autonomous provinces and on historical data of the Suppressed SIMN Data legend
|
Thumbnail
Headline
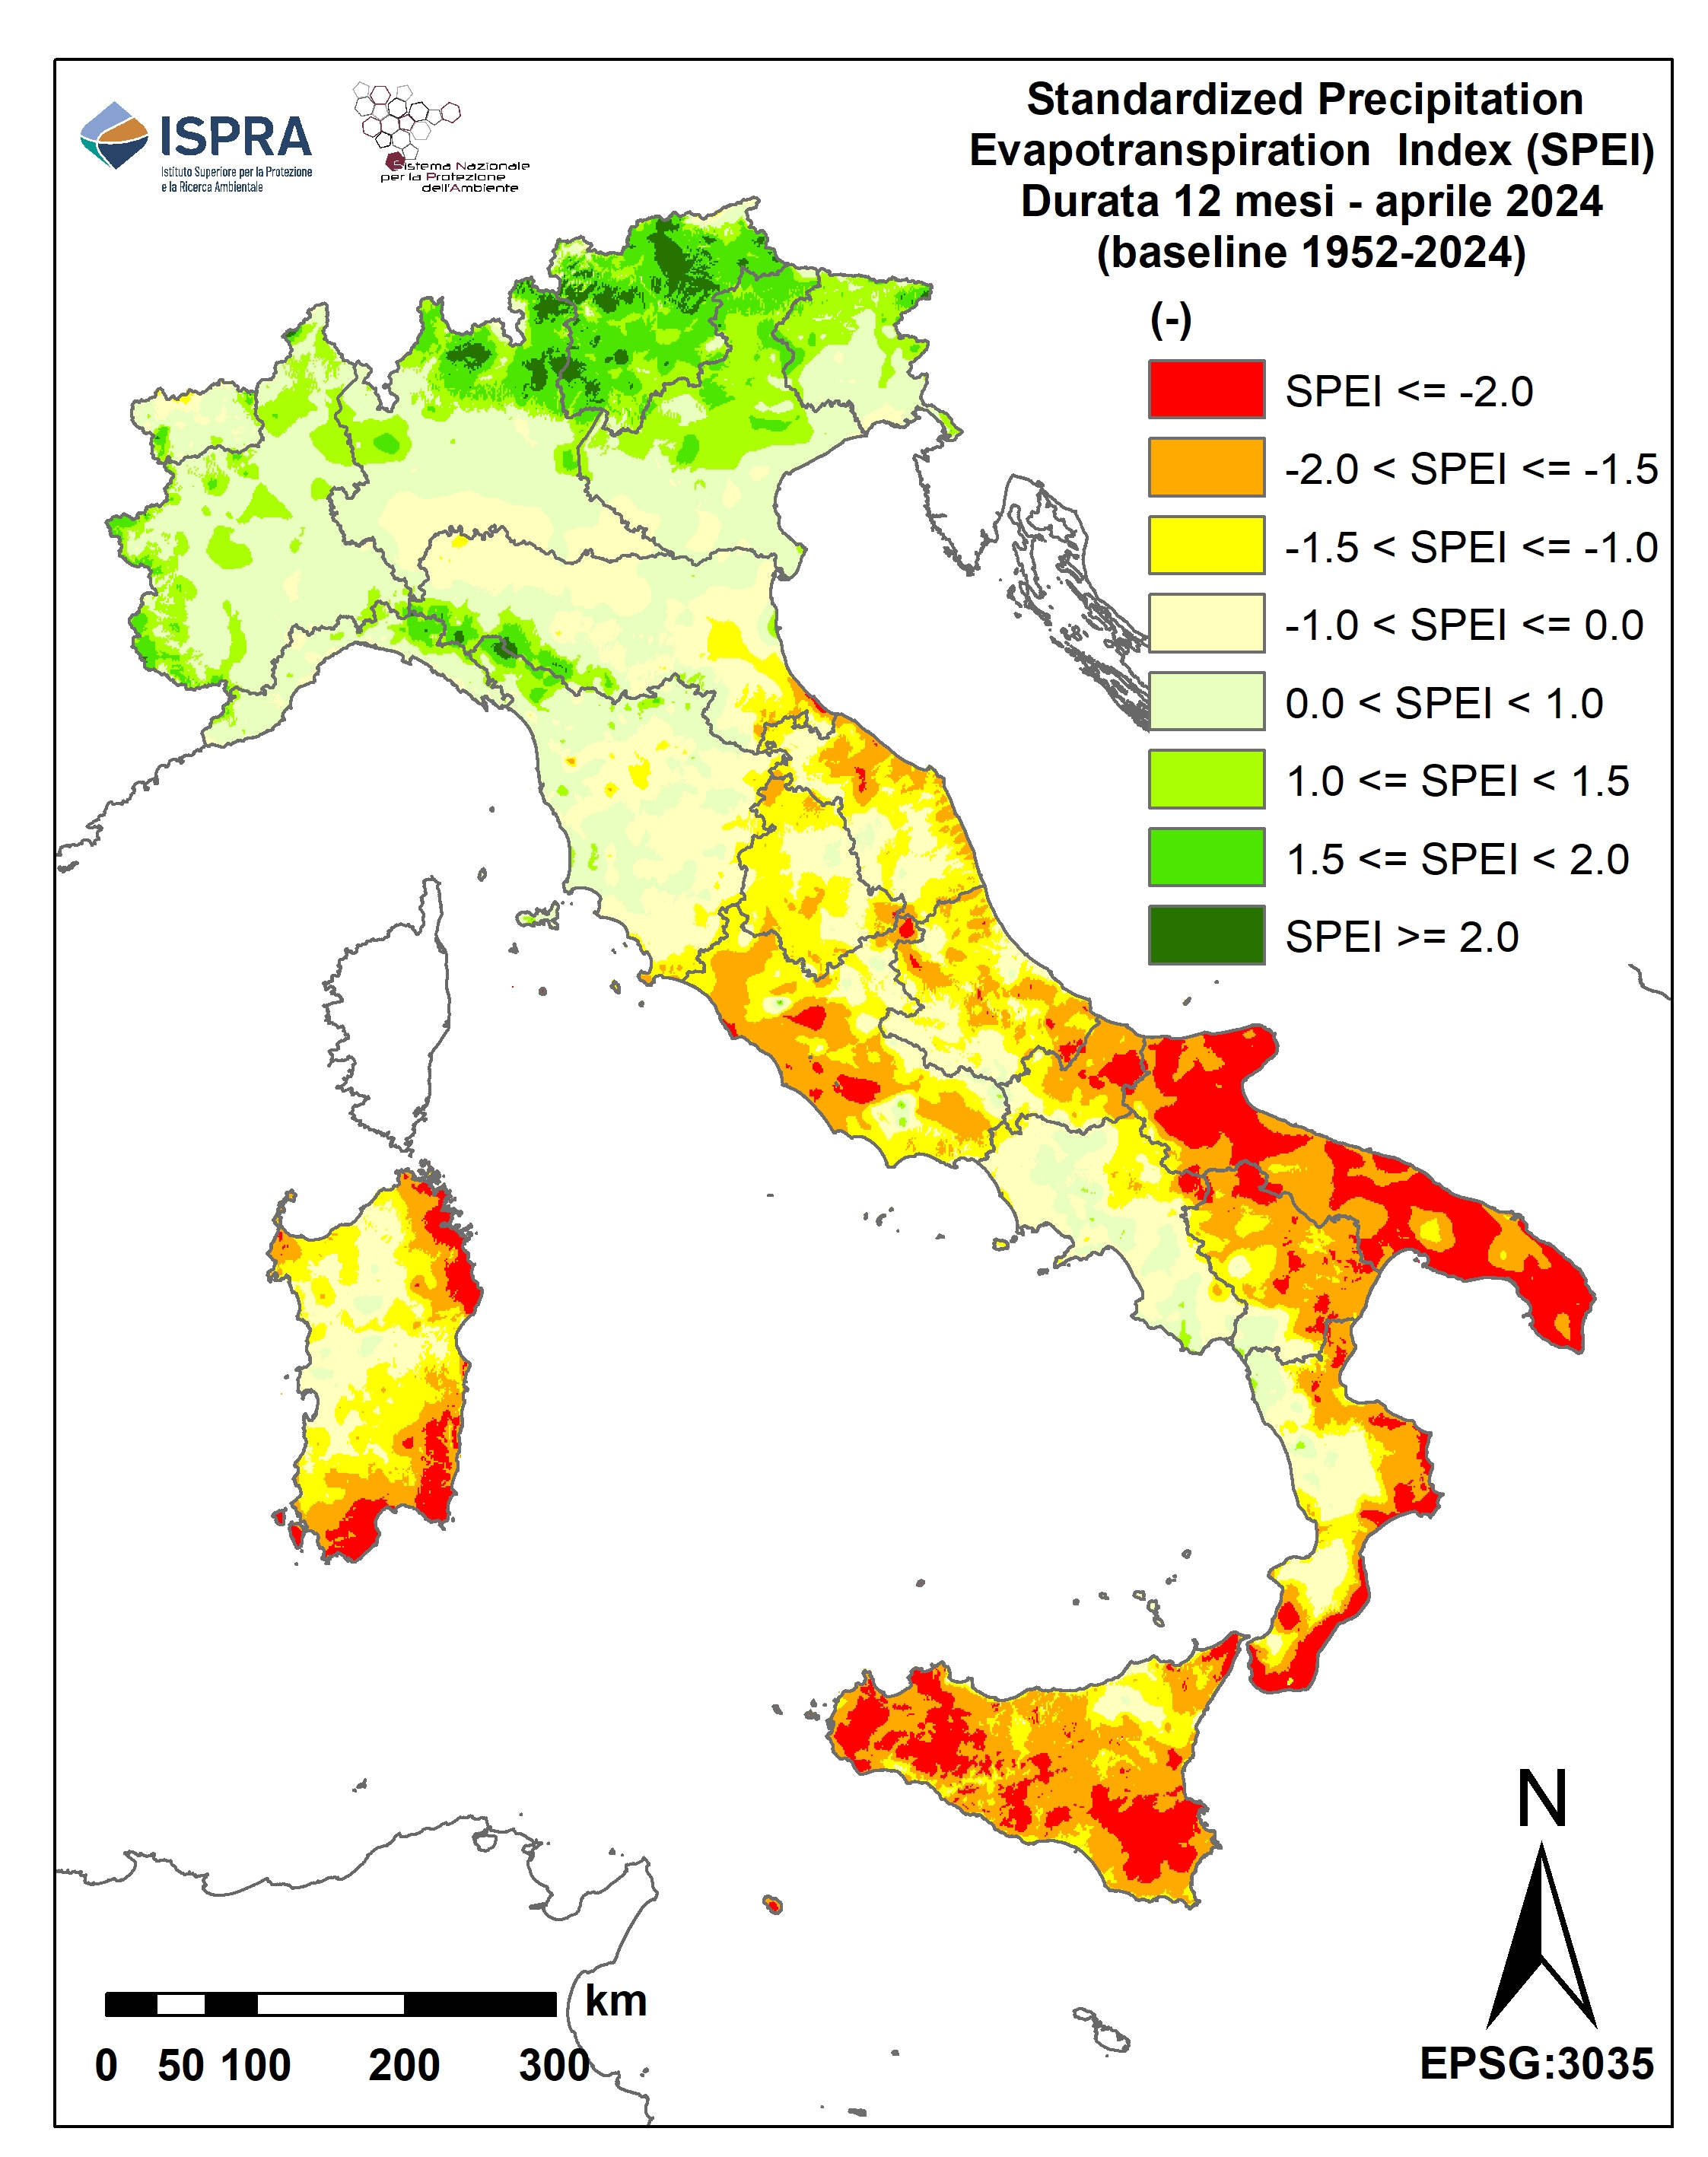
Figure 4: SPEI at 12 months - April 2024 Data source
ISPRA elaboration on data from regional hydro-meteorological offices and autonomous provinces and on historical data of the Suppressed SIMN Data legend
|
Thumbnail
Headline
Figure 5: SPEI at 12 months - May 2024 Data source
ISPRA elaboration on data from regional hydro-meteorological offices and autonomous provinces and on historical data of the Suppressed SIMN Data legend
|
Thumbnail
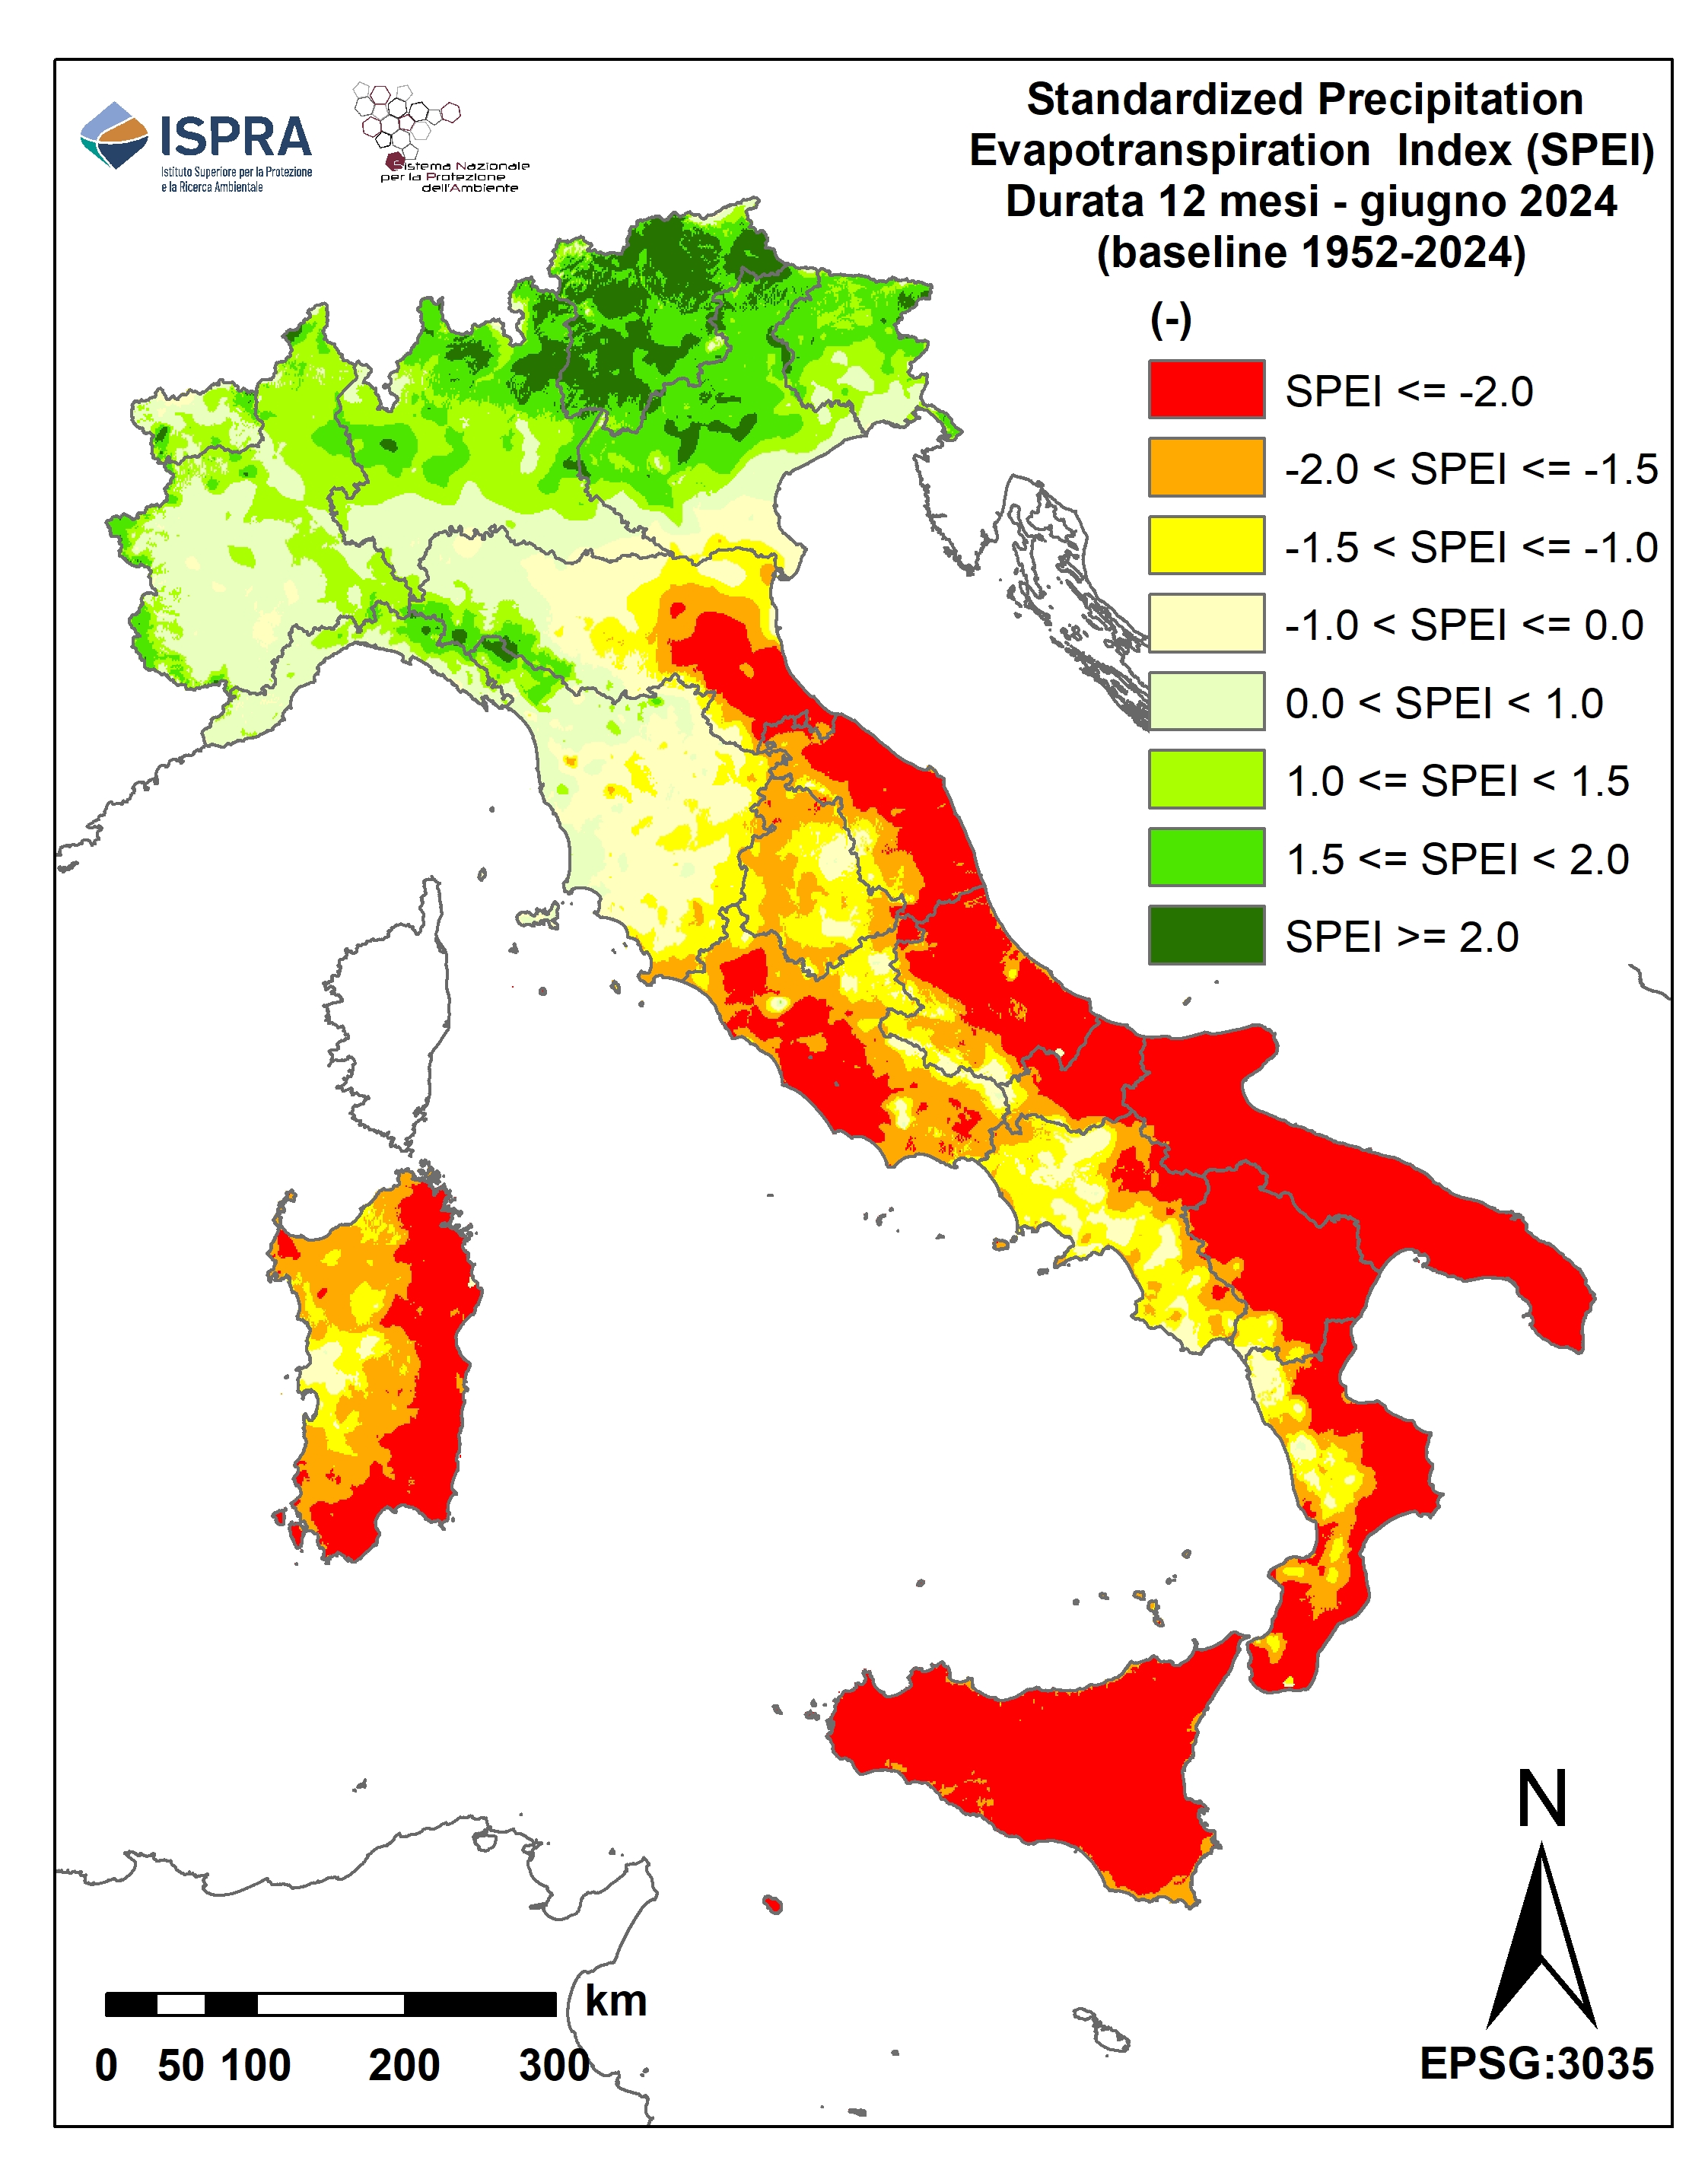
Headline
Figure 6: SPEI at 12 months - June 2024 Data source
ISPRA elaboration on data from regional hydro-meteorological offices and autonomous provinces and on historical data of the Suppressed SIMN Data legend
|
Thumbnail

Headline
Figure 7: SPEI at 12 months - July 2024 Data source
ISPRA elaboration on data from regional hydro-meteorological offices and autonomous provinces and on historical data of the Suppressed SIMN Data legend
|
Thumbnail
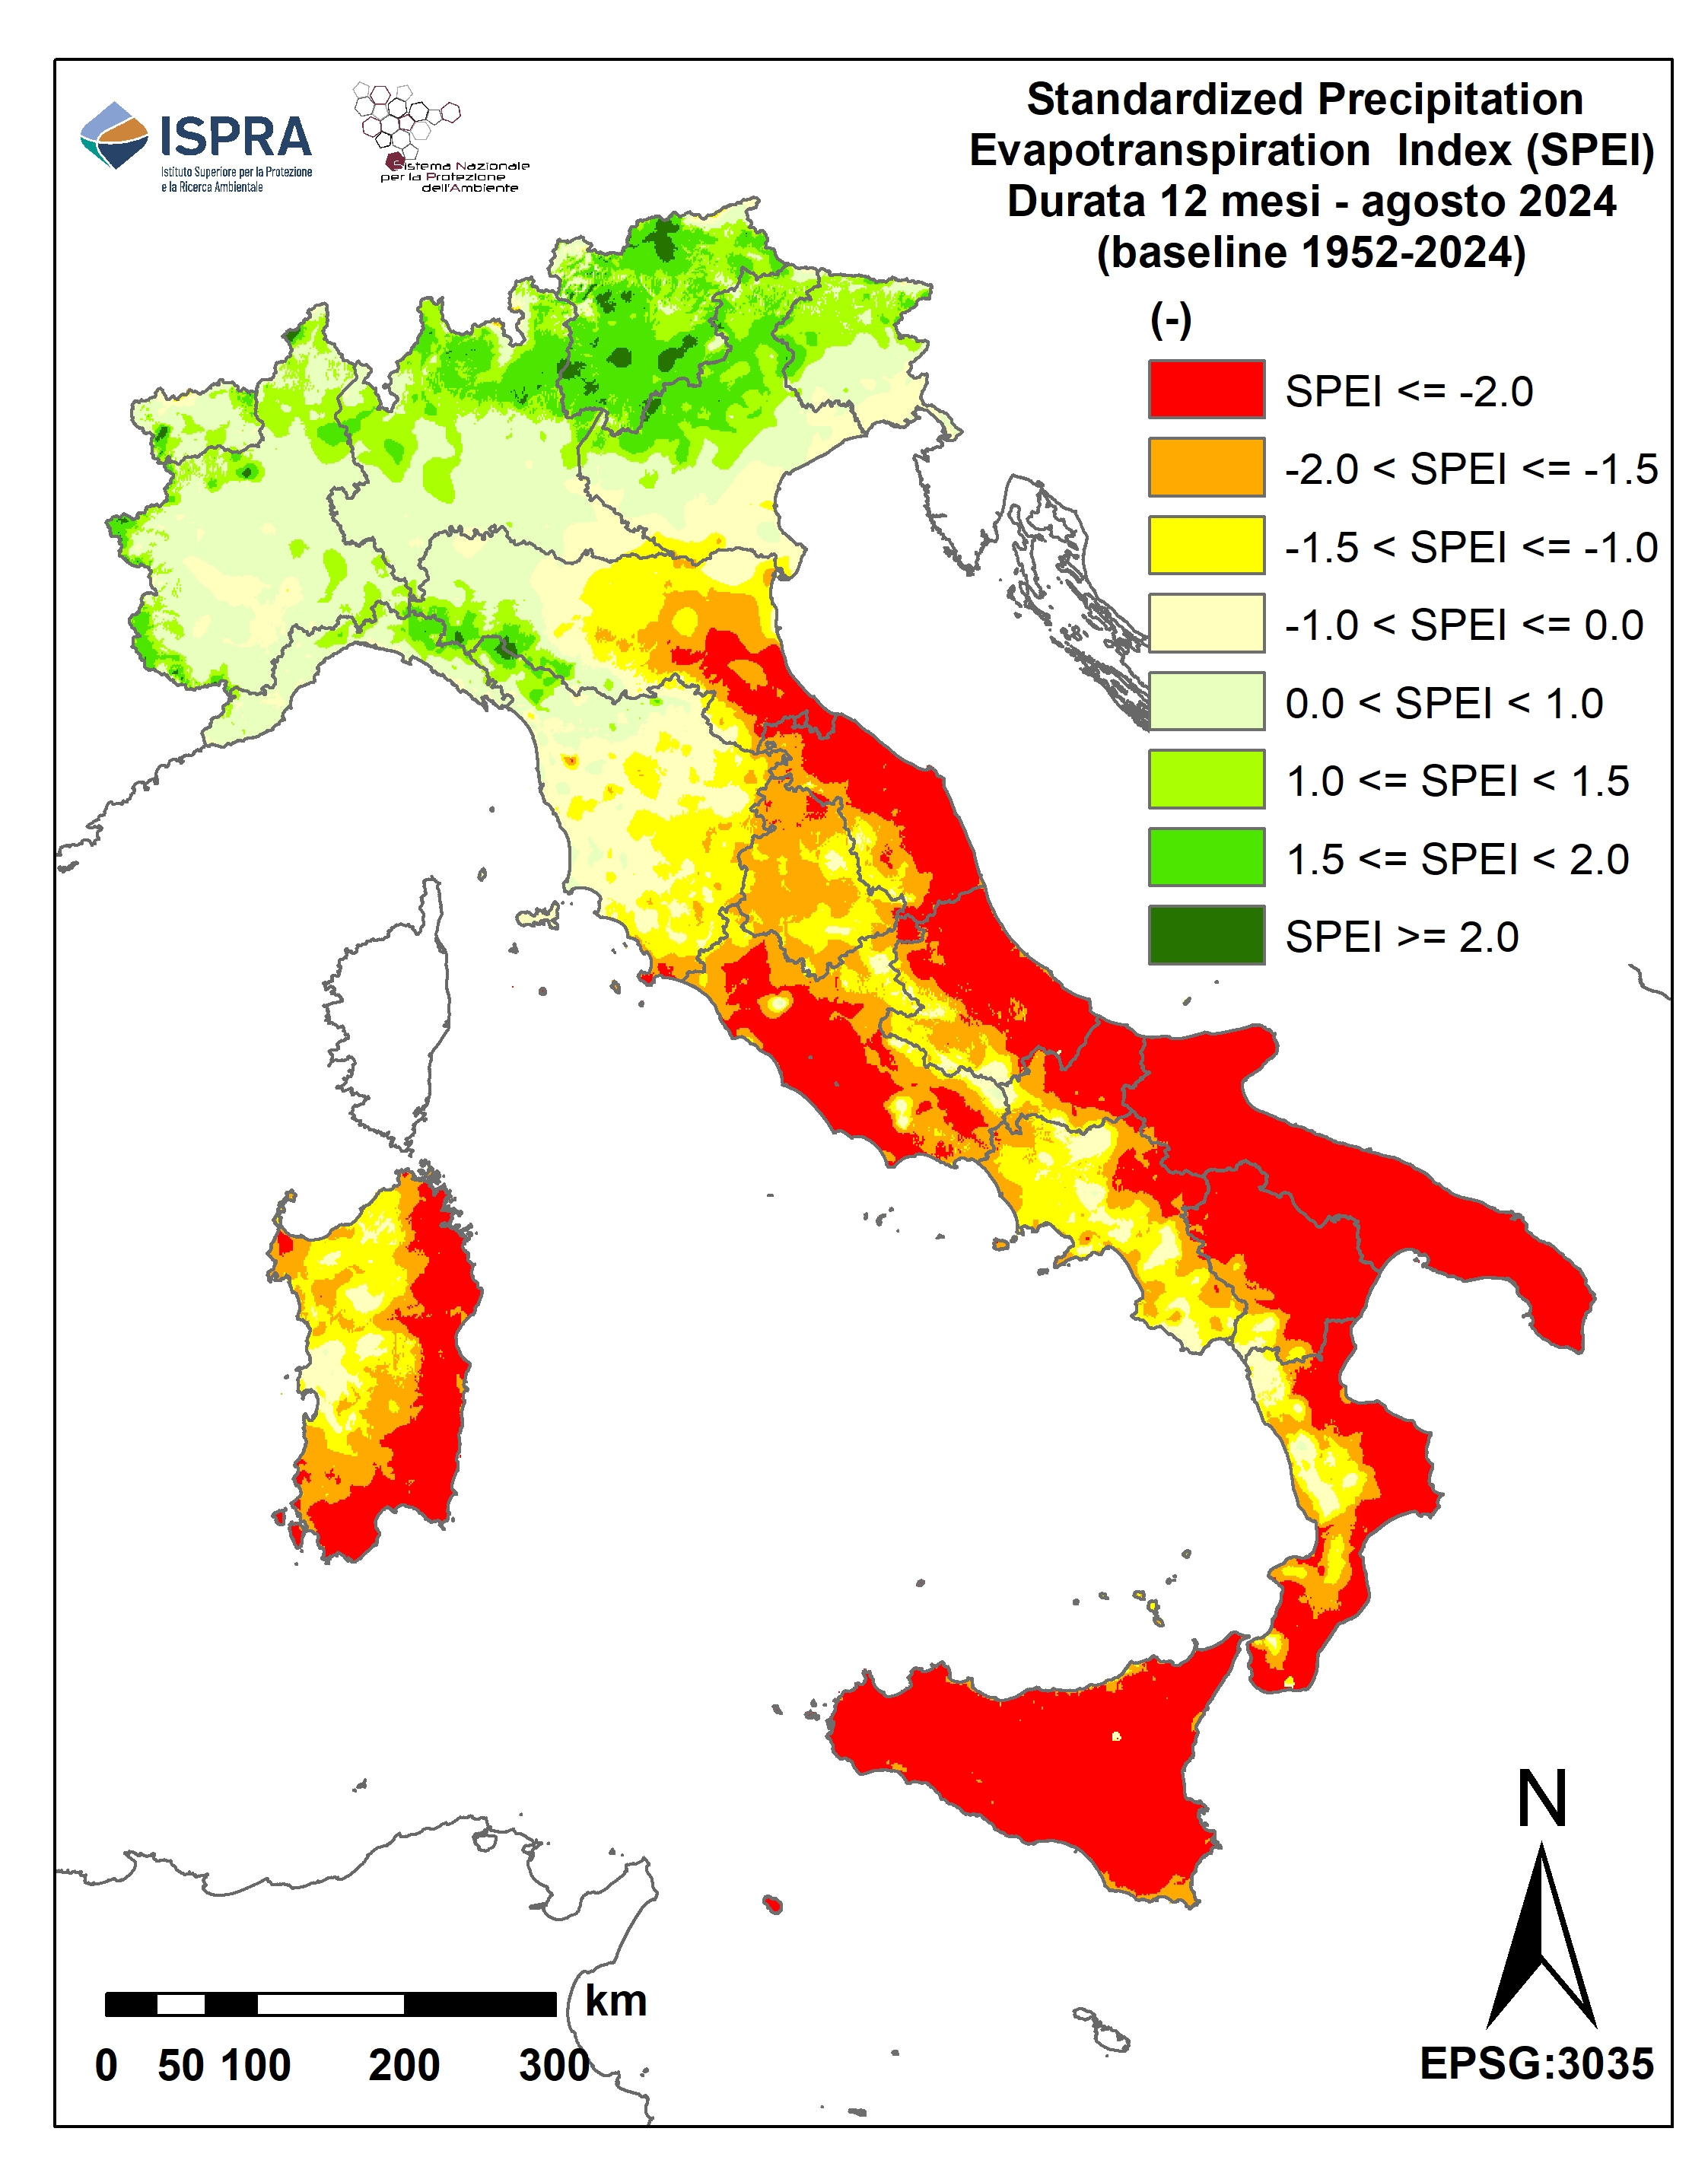
Headline
Figure 8: SPEI at 12 months - August 2024 Data source
ISPRA elaboration on data from regional hydro-meteorological offices and autonomous provinces and on historical data of the Suppressed SIMN Data legend
|
Thumbnail
Headline
Figure 9: SPEI at 12 months - September 2024 Data source
ISPRA elaboration on data from regional hydro-meteorological offices and autonomous provinces and on historical data of the Suppressed SIMN Data legend
|
Thumbnail
Headline
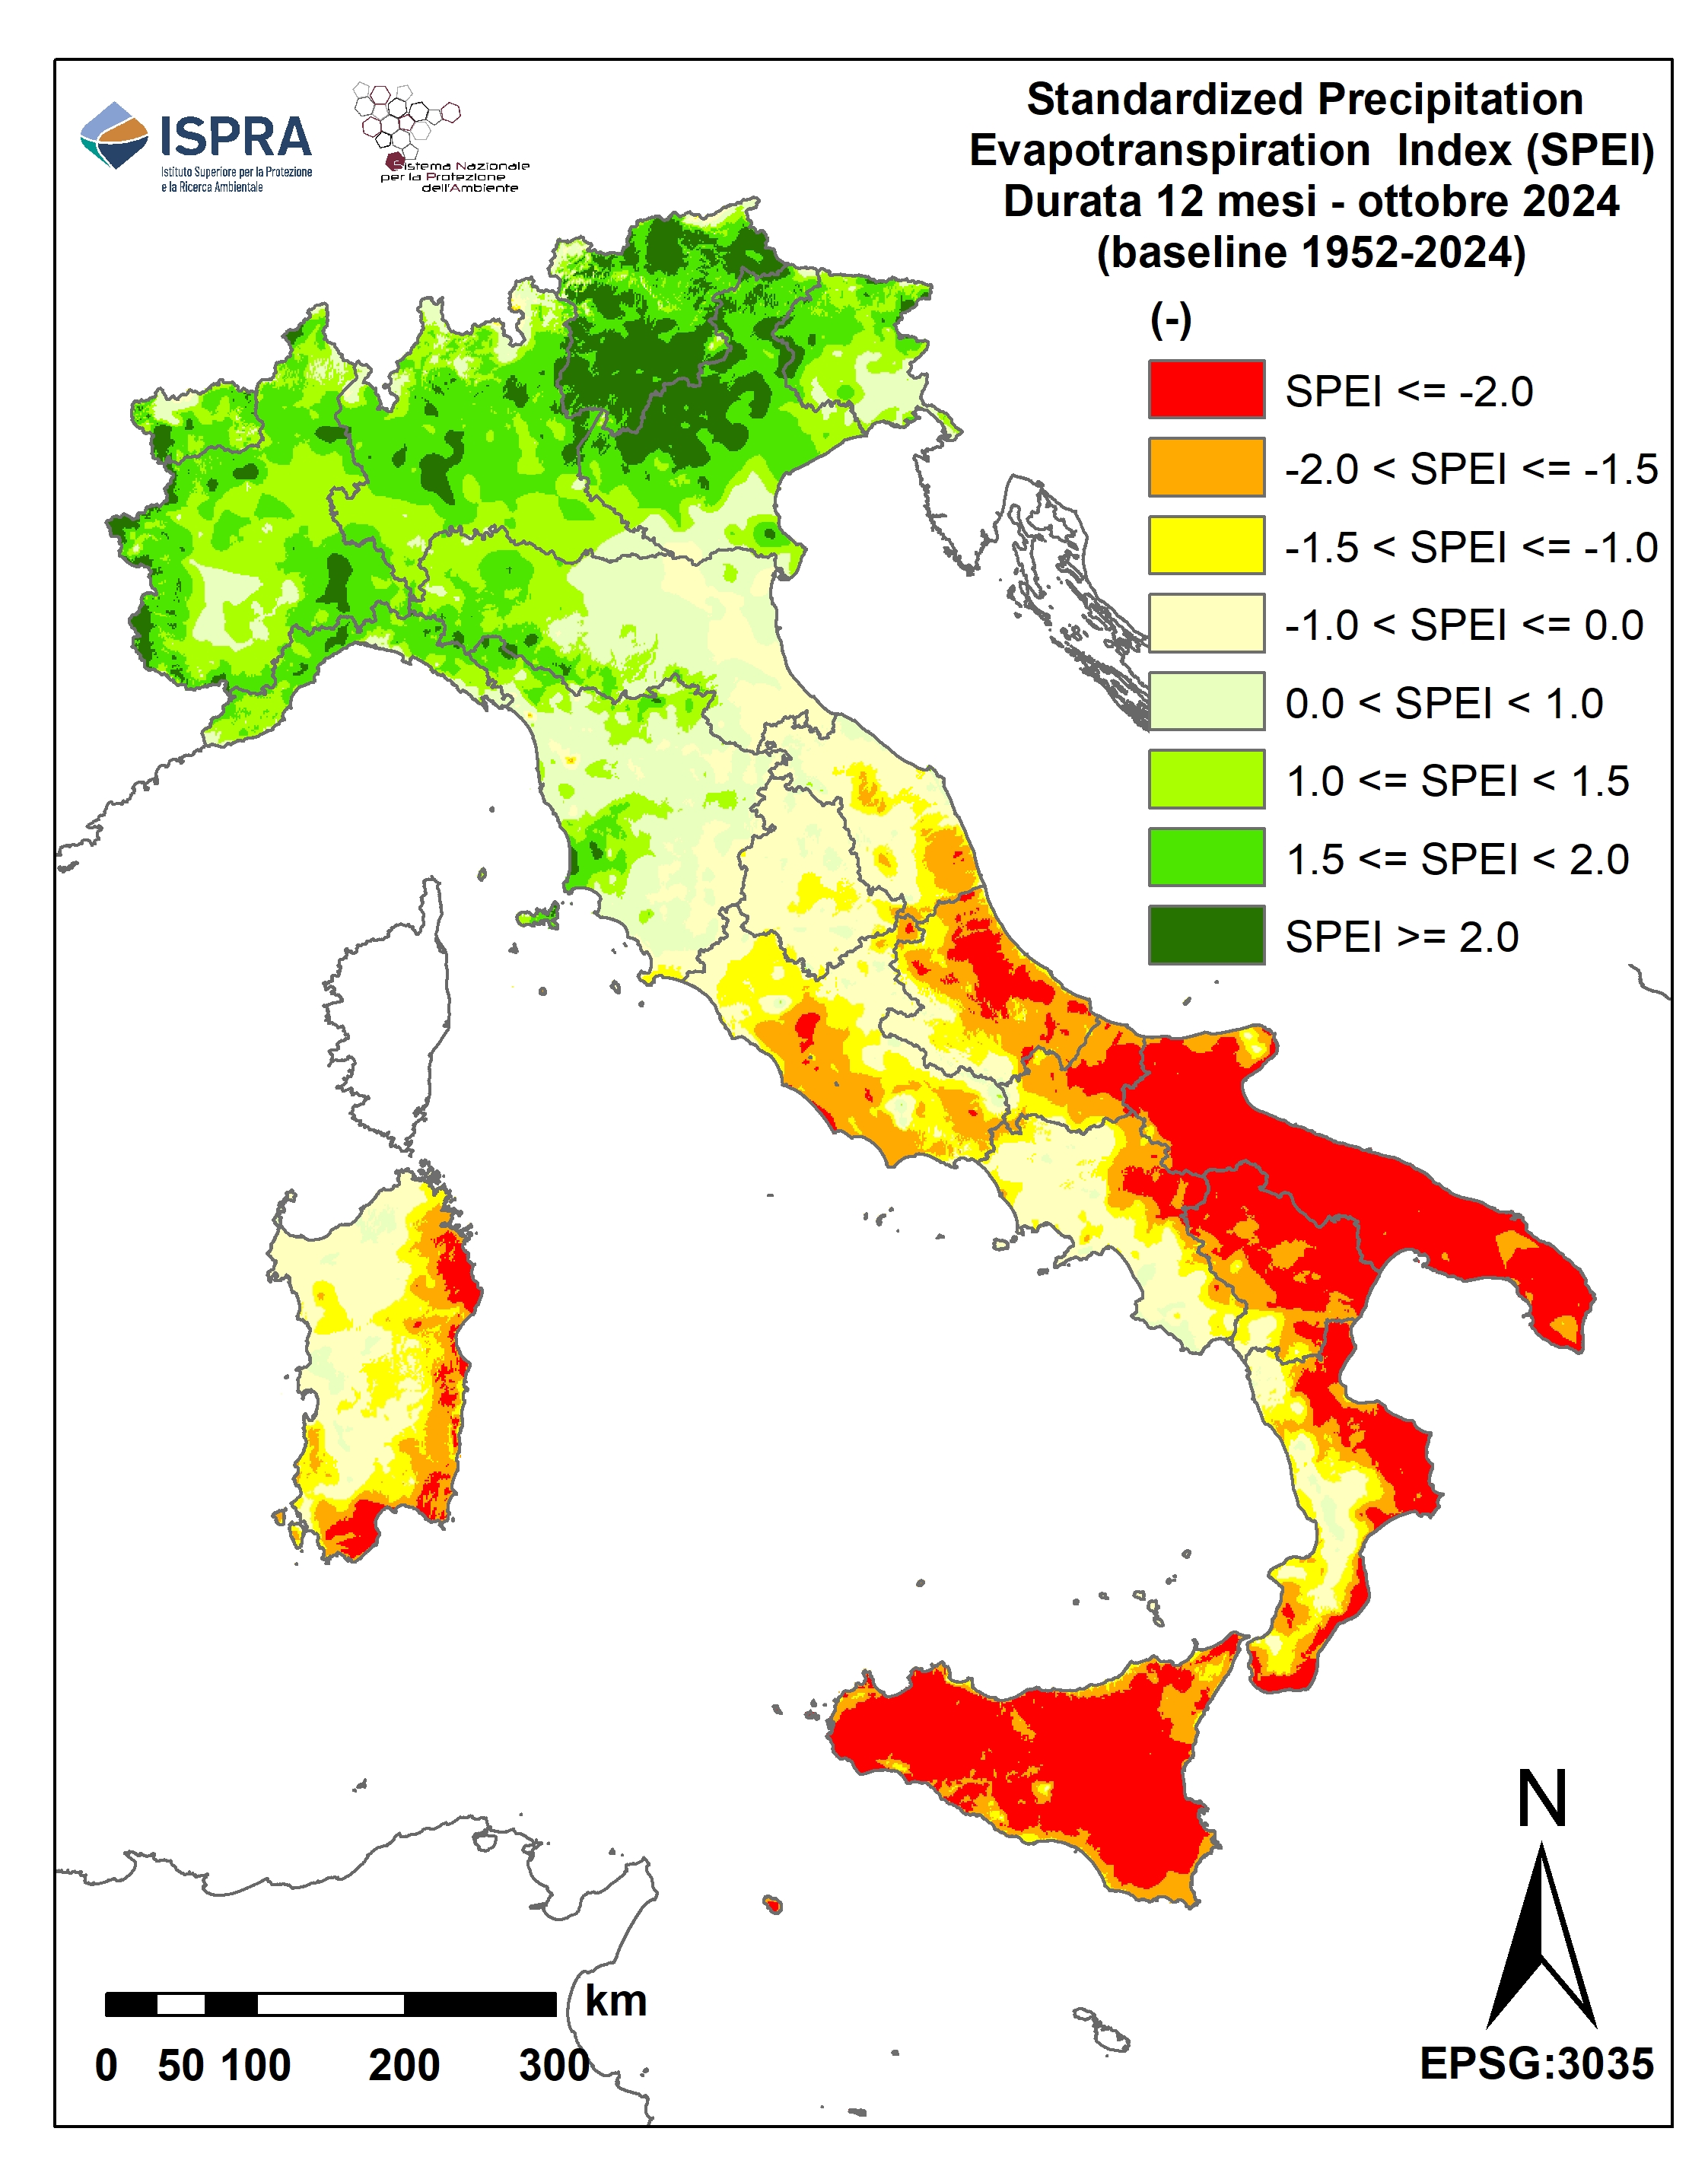
Figure 10: SPEI at 12 months - October 2024 Data source
ISPRA elaboration on data from regional hydro-meteorological offices and autonomous provinces and on historical data of the Suppressed SIMN Data legend
|
Thumbnail
Headline
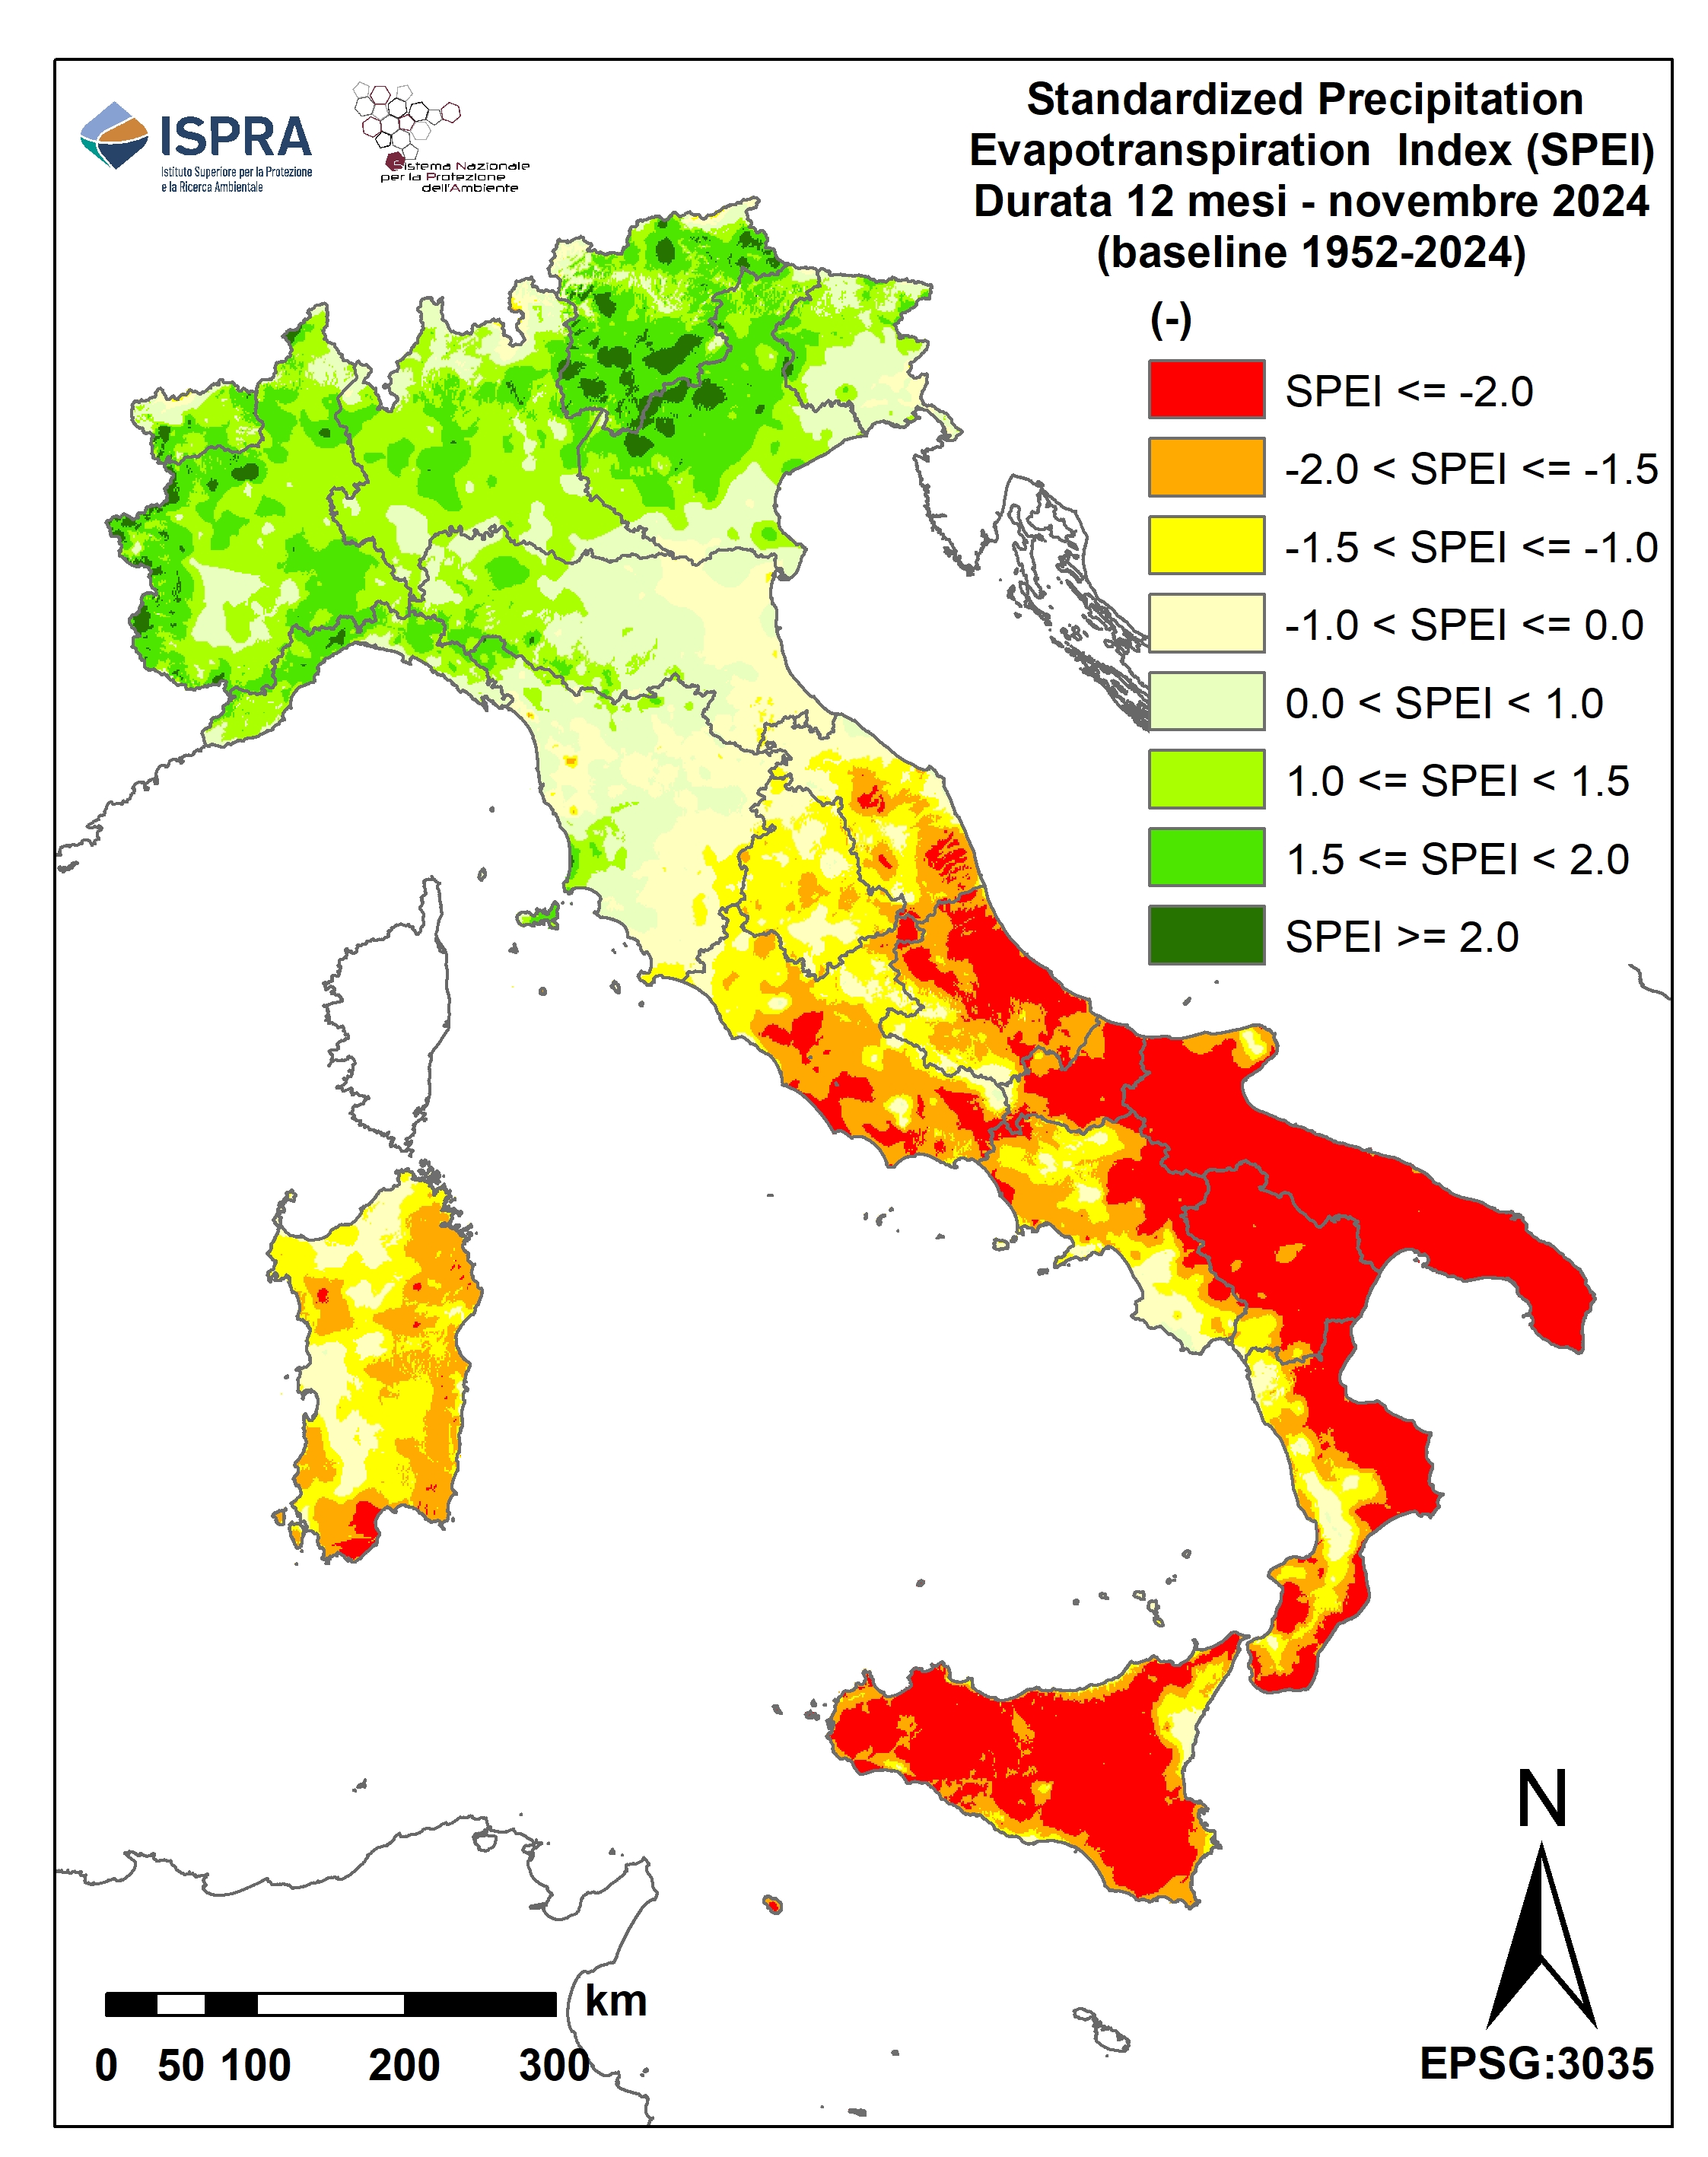
Figure 11: SPEI at 12 months - November 2024 Data source
ISPRA elaboration on data from regional hydro-meteorological offices and autonomous provinces and on historical data of the Suppressed SIMN Data legend
|
Thumbnail
Headline
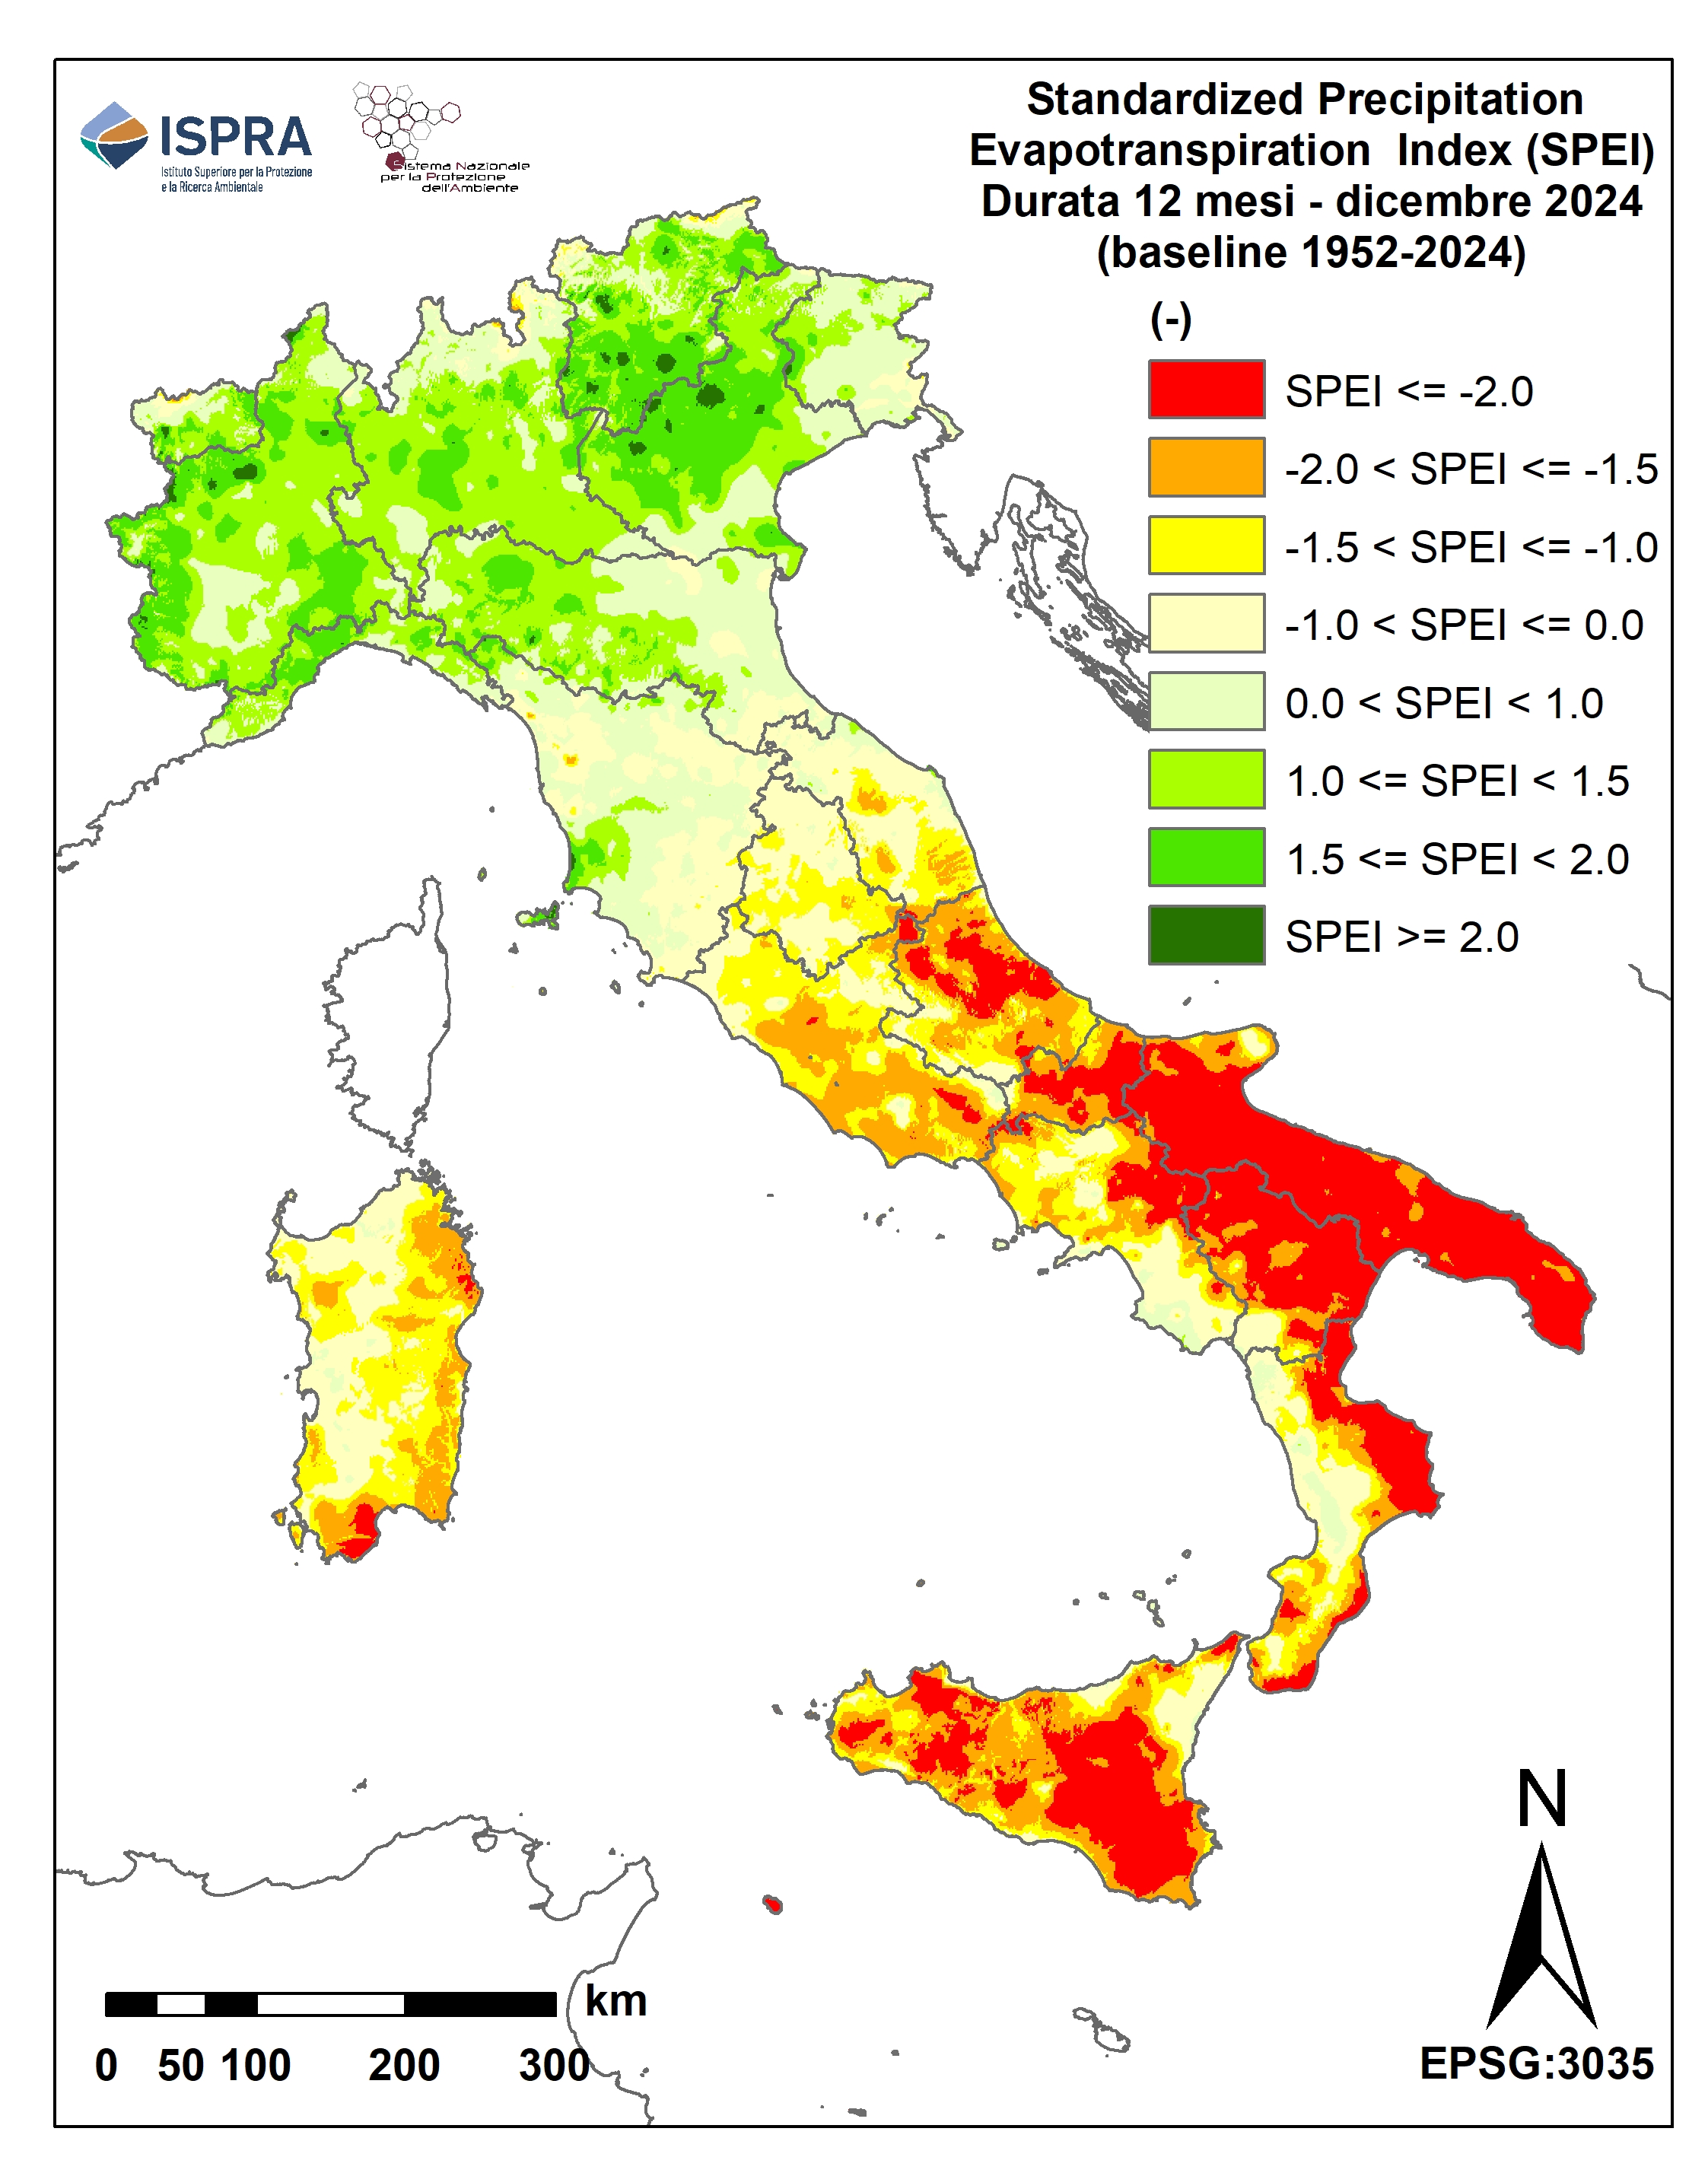
Figure 12: SPEI at 12 months - December 2024 Data source
ISPRA elaboration on data from regional hydro-meteorological offices and autonomous provinces and on historical data of the Suppressed SIMN Data legend
|
Thumbnail
Headline
Figure 13: Percentages of national territory subject in 2024 to extreme drought conditions and severe or moderate drought on a 12-month time scale Data source
ISPRA elaboration on data from regional hydro-meteorological offices and autonomous provinces and on historical data of the Suppressed SIMN Data legend
|
Headline
Dati per Figura 13: Percentuali di territorio nazionale soggetto nel 2024 a condizioni di siccità estrema e siccità severa o moderata su una scala temporale di 12 mesi |
In 2024, the maps of SPEI at 12 months (SPEI12) showed conditional of drought, from extreme to moderate, in several areas of Central Italy, the South and the major islands, while the North was affected by conditions of humidity, also from extreme to moderate (Figure 1–12). This situation was determined by the access of precipitation that involved northern Italy, while the remaining part of the national territory suffered a considerable precipitation deficit (see the indicator "Precipitations" present in the Environmental Theme "Water Resources and Balance" of Environmental Indicators Database). Moreover, in terms of the hydro-climatic budget, the distinction between the North involved in a rainfall surplus and the rest of the national territory in drought conditions is even more evident, as well as being the percentage of areas affected by extreme drought assessed through the SPEI index, compared to that assessed through the SPI (see the indicator "hydrological drought" present in the Environmental Theme "Water Resources and Balance" of the Environmental Indicators Database). This is due to the combined effect of the reduction in precipitation and the increase in the evapotranspiration quota for the observed high temperatures (in 2024, the average annual temperature at national scale marked +1.33 degrees Celsius compared to 1991-2020).
On the 12-month aggregation scale, the months of June, July and August (Figure 6–8) are those in which there was a greater extent of the areas in extreme drought (SPEI12 –2.0) of the order of 32–33% (Figure 13). In the same months, again based on the SPEI index, the percentage of national territory affected by severe to moderate drought (–2.0 SPEI12 – 1.0) was of the order of 22–24% (Figure 13). On average, on an annual scale, almost 50% of Italy (mainly South and major islands) was affected by extreme to moderate drought due to the combined effect of the reduction in precipitation and the increase in the share of evatrapulispiration. This has led to a reduction in the natural availability of renewable water resources in these territories (see the "Internal flow" indicator present in the Environmental Theme"Water Resources and Balance" of the Environmental Indicators Database), with consequent socio-economic and environmental impacts.
The drought and water severity conditions that in 2024 have afflicted the national territory in a diversified way have been continuously monitored and analyzed by the permanent district observatories for water uses, organ of each District Basin Authority (pursuant to Legislative Decree no. 39/2023). During the year, the Observatories of the river districts of Northern Italy (Eastern Alps, Po River and Northern Apennines) have seen a substantial normal situation confirm, that is, an uncritical scenario of water severity. On the other hand, the Observatories of the river districts of the Central Apennines, the South Apennines, Sardinia, and especially that of Sicily have recorded conditions of water severity from high to medium (https://www.isprambiente.gov.it/pre-meteo/idro/SeverIdrica.html/), with the need to adopt appropriate measures and governance actions due to the level of water severity. In some cases (Sicily, areas of Basilicata served by the water scheme of the Basento-Camastra, and some Calabrian territories of the provinces of Reggio Calabria, Crotone and Cosenza), it has come to the declaration of a state of emergency for serious water deficit by the Council of Ministers.
For a detailed evaluation of the drought 2024, also for time scales of less than 12 months, please refer to the consultation of the hydrological and / or drought bulletins issued monthly at regional level by the offices responsible for the hydro-meteorological monitoring (federates within the National Table for the Services of Operational Hydrology: https://www.isprambiente.gov.it/pre-meteo/idro.