Panel 1
Irma Lupica
The indicator measures the amount of special waste treated in production plants, present on the national territory, in total or partial replacement of traditional fuels. In 2023, about 1.9 million tons of special waste were recovered in coinciding systems. Compared to 2022, the recovered quantities show a slight increase (852 tons, +0.05%). The regional system framework shows that most special waste, corresponding to 77.1% of the total, is recovered in the northern regions; The regions of the Center follow with 12.6% and those of the South with 10.3%.
Pressure and response indicator that measures the quantities of special waste treated in production plants in total or partial replacement of traditional fuels.
The indicator allows you to evaluate the quantities of waste that are used in total or partial replacement of traditional fuels in production plants on the national territory. It allows to carry out comparisons between regions/provinces/municipalities and provides information to support environmental policy decisions.
The regulatory reference regarding coinciding is Directive 2010/75/EU of the European Parliament and of the Council of 24 November 2010 relating to industrial emissions (integrated prevention and reduction of pollution), implemented by the national legislation in title III-bis of part IV of Legislative Decree 152/06 (environmental code). This directive fully regulates the incineration and coincidence of hazardous and non -dangerous waste starting from the construction of the systems, also including the different stages of the incineration activity from the moment of reception of waste up to the disposal of the residues. In particular, the decree called specific provisions on: issue limit values; sampling, analysis and evaluation methods of pollutants deriving from the incineration and coincidence of waste; General technical criteria and standards concerning the construction, functional and management characteristics of incineration and coinciding systems, with particular reference to the needs of ensuring integrated protection of the environment against emissions caused by these systems; temporal criteria for adaptation to the new provisions of existing systems.
Panel 2
ISPRA - Special waste report 2025
No limitation
None
Data quality assessment
Single model of environmental declaration MUD ISPRA - Waste cadastre (http://www. catasto-rifiuti. isprambiente. it).
National, regional
2010-2023
Indicator assessment
The indicator measures the amount of special waste coincided in partial or total replacement of traditional fuels. The information is provided disaggregated with respect to the different types of refusal, i. e. Special dangerous waste and special non -hazardous waste and divided between the different regional contexts. The information base consists of the data contained in the single model of environmental declaration communicated by the subjects identified by article 189 paragraph 3 of Legislative Decree 152/2006, to the Chambers of Commerce, Industry, Crafts and Territorially competent agriculture.
In 2023, approximately 1.9 million tonnes of special waste were recovered in co-incineration plants. Compared to 2022, the quantities recovered showed a slight increase of 852 tonnes (+0.05%) (Table 1). The national plant infrastructure comprised 301 operational facilities; of these, 253 treated quantities of waste exceeding 100 tonnes per year, while the remaining 48 used small amounts of waste exclusively for the recovery of thermal/electric energy functional to their own production cycle (Table 2).
The quantity of special waste sent for energy recovery in 2023 showed a decrease of 18.5% compared to 2010, corresponding to 419 thousand tonnes, outlining a downward trend (Table 3).
Data
Table 1: Quantity of special waste used as an energy source (R1) in Italy, by region
ISPRA
Table 3: Quantity of special waste used as an energy source (R1) in Italy
ISPRA
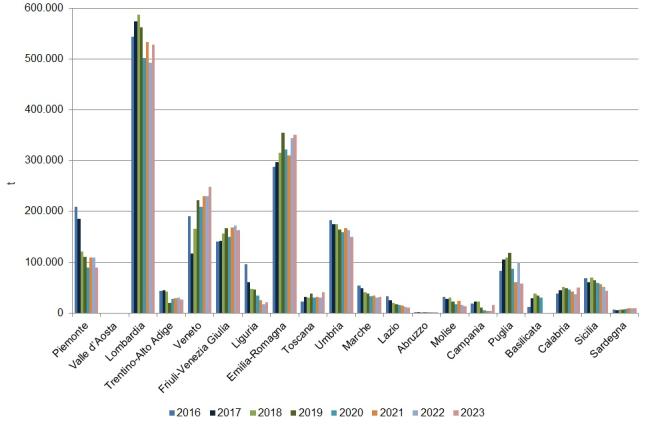
Figure 1: Quantity of special waste used as an energy source (R1)
ISPRA
The regional overview shows that most of the special waste was recovered in the northern regions (77.1% of the total), followed by the central regions with 12.6% and the southern regions with 10.3%. The regional comparison for the 2022–2023 period highlights the most significant increases in the quantities of co-incinerated waste in Lombardy (+35 thousand tonnes, +7.0%), Veneto (+17 thousand tonnes, +7.5%), Calabria (over +13 thousand tonnes, +36.7%), Campania (over +11 thousand tonnes), Tuscany (about +11 thousand tonnes, +34.7%), Emilia-Romagna (about +8 thousand tonnes, +2.3%), Liguria (almost +4 thousand tonnes, +22.9%), and Marche (+700 tonnes, +2.3%).
Conversely, a decrease in the quantities recovered for energy purposes was observed in Piedmont (over -19 thousand tonnes, -17.8%), Umbria (-13 thousand tonnes, -8.1%), Molise (over -3 thousand tonnes, -20.5%), Sicily (over -7 thousand tonnes, -14.2%), Trentino-Alto Adige (over -3 thousand tonnes, -11%), Apulia (over -42 thousand tonnes, -42.4%), and Lazio (over -1 thousand tonnes, -11.2%). Data for Sardinia and Abruzzo remained essentially stable, showing slight decreases of about -400 and -250 tonnes, respectively (Figure 1).