Angelo Santini, Fabio Tatti
National municipal waste (MW) generation in 2023 amounts to approximately 29.3 million tonnes, marking a 0.7% increase (approximately +218,000 tonnes) compared to 2022.
The indicator measures the total amount of municipal waste generated in Italy, broken down at the regional level.
To measure the total and per capita quantity of municipal waste generated.
Assessment of the implementation and effectiveness of legislative and technical measures related to municipal waste, particularly concerning the provisions outlined in Part IV of Legislative Decree No. 152/2006 and related regulations, including the National Waste Prevention Program, Regional Waste Prevention Programs, the National Waste Management Program, and Regional Waste Management Plans.
ISPRA - Rapporto Rifiuti Urbani (various editions)
ISPRA
Data on municipal waste generation at the national level, as well as disaggregated by macro-geographical area, region, province, and municipality, are freely available and downloadable from the website www.catasto-rifiuti.isprambiente.it.
National, regional
1995-2023
On May 26, 2016, the Ministry of Environment issued a specific decree providing guidelines for calculating the percentage of separate waste collection. This decree introduced changes to the accounting methods for municipal waste production and separate collection, adopting a methodological approach different from that previously used by ISPRA (up to 2015).
Notably, the decree includes certain waste streams from removal activities conducted in residential buildings in the collection data. Previously, ISPRA excluded these flows from municipal waste counts as they were classified as special waste under existing regulations. Additionally, the decree mandates that street-sweeping waste sent for recovery and the entire volume of multi-material collection (including non-recyclable fractions) be included in separate collection figures. Under the previous methodology, these were counted as undifferentiated waste, contributing to total MW production but not to separate collection.
The data are sourced from ISPRA analyses based on information reported by ARPA/APPA (regional and provincial environmental agencies), regional and provincial authorities, local waste observatories, and the annual database of the Environmental Declaration Form (MUD).
At the municipal level, data collection and processing are carried out unless data are available only in aggregated form (e.g., by territorial district, mountain community, consortium, or municipal union). For municipalities lacking direct data sources, municipal waste generation estimates follow a standardized methodology, which involves: grouping municipalities within each province by population size (<5,000; 5,000-14,999; 15,000-29,999; 30,000-49,999; 50,000-149,999; ≥150,000 inhabitants) and determining the average per capita waste production for each group; estimating total waste production for municipalities without direct data by multiplying the per capita production average of the corresponding group by the municipality’s resident population; estimating the amount of undifferentiated municipal waste as the difference between total MW production and separate collection figures for the given municipality.
For separate collection data, in cases where direct information is unavailable, figures from the previous year for the same municipality are used.
Municipal waste (MW) generation recorded a 0.7% increase (approximately +218,000 tonnes) between 2022 and 2023. Overall, the fluctuating trend in waste generation can be attributed to a range of factors—often acting in combination—including the introduction of new regulatory measures, public health emergencies, or socio-economic events, such as the COVID-19 pandemic in 2020 and the international crisis in 2022. Consequently, the status of the indicator can be classified as moderate.
A long-term analysis reveals that municipal waste generation consistently exceeded 32 million tonnes between 2007 and 2010. This was followed by a sharp decline during 2011–2012, coinciding with a contraction in gross domestic product and household consumption. From 2013 to 2015, waste generation stabilized below 30 million tonnes. Subsequently, with the exception of 2017, annual figures rose again, surpassing 30.1 million tonnes, before declining slightly in 2019 and more markedly in 2020. In the most recent three-year period, waste generation has shown a fluctuating pattern, with modest increases in 2021 and 2023 and a slight decrease in 2022. Overall, the trend can be considered relatively stable (Table 1).
| Allegati |
|---|
Titolo
Table 1: Total and per capita municipal waste generation Fonte
ISPRA Legenda
The population used for the per capita calculation refers to the resident population as of December 31 of each year. |
Thumbnail

Titolo
Figure 1: Per capita municipal waste generation Fonte
ISPRA elaboration based on ISPRA and Istat data |
Thumbnail
Titolo
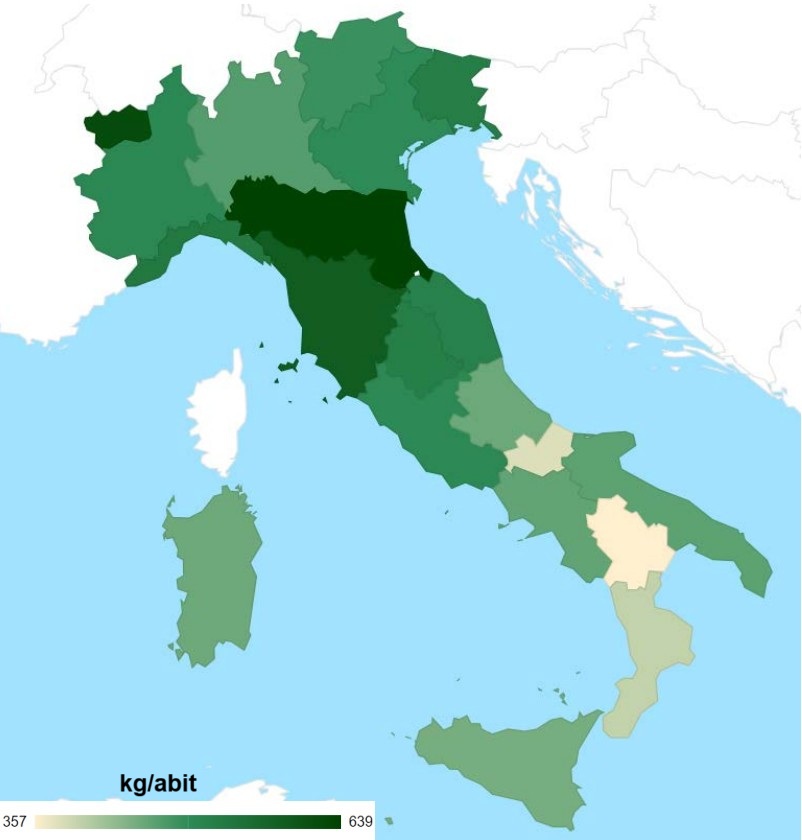
Figure 2: Per capita municipal waste generation by region Fonte
ISPRA elaboration based on ISPRA and Istat data |
In 2023, all Northern Italian regions—except for Liguria, which experienced a slight decrease—recorded increases in municipal waste generation. Notable rises were observed in Friuli-Venezia Giulia (+6.3%), Veneto (+4.5%), and Lombardy (+2.3%). In the Central regions, overall municipal waste generation remained largely stable compared to 2022: slight increases were noted in Umbria (+0.9%), Marche (+0.4%), and Lazio (+0.2%), while a marginal decline occurred in Tuscany (-0.3%) (Table 1).
In Southern Italy, a general decrease in waste production was recorded, with the exception of Molise (+1.3%) and Abruzzo (+0.3%).
Regarding per capita waste generation, since 2012 the national figure has generally remained below 500 kilograms per inhabitant per year, except for 2012, 2018, 2019, and 2021. By contrast, the 2004–2011 period recorded significantly higher values, ranging between approximately 530 and 550 kilograms per capita (Figure 1).
In 2023, as in previous years, the highest per capita waste generation was observed in Emilia-Romagna at 639 kilograms per inhabitant per year—an increase of 6 kilograms compared to 2022. This was followed by Aosta Valley at 620 kilograms (+4 kg) and Tuscany at 586 kilograms, which showed a slight decrease of 4 kilograms.
In total, ten regions exceeded the national average of 496 kilograms per inhabitant: in addition to the three mentioned above, these include Liguria, Friuli-Venezia Giulia, Umbria, Marche, Piedmont, Lazio, and Veneto. The lowest per capita generation values were recorded in Basilicata (approximately 357 kg), Molise (approximately 380 kg), and Calabria (approximately 398 kg) (Table 1, Figure 2).