Angelo Santini, Fabio Tatti
In 2024, compared to the 2.3% increase recorded for the production of urban waste, the Italian economy recorded, compared to 2023, a growth in Gross Domestic Product and Final Consumption Expenditure on the national territory, equal, for both socio-economic indicators, to 0.7%.
The indicator measures the total quantity of municipal waste generated in Italy in relation to GDP, chain-linked volumes with reference year 2020, and to household final consumption expenditure, chain-linked volumes with reference year 2020.
To measure the total quantity of waste generated and the correlation between waste generation and socio-economic indicators.
Directive 2008/98/EC; Legislative Decree No. 152/2006; Legislative Decree No. 205/2010; Decree of the Ministry of the Environment, Land and Sea Protection of 26 May 2016 laying down “Guidelines for calculating the separate collection rate of municipal waste”.
The National Waste Prevention Programme, provided for by Article 180, paragraph 1-bis, of Legislative Decree No. 152/2006 and issued by MASE through the Directorial Decree of 7 October 2013, identifies municipal waste generation per unit of GDP as one of the parameters to be monitored for assessing the effectiveness of the measures undertaken. For this parameter, a reduction target of 5%, measured against 2010 values, was set to be achieved by 2020.
ISPRA - Rapporto Rifiuti Urbani, various editions.
ISPRA, Italian Institute for Environmental Protection and Research.
Istat, Italian National Institute of Statistics.
Data on waste generation at national, macro-geographical area, regional, provincial and municipal level are freely accessible and downloadable from www.catasto-rifiuti.isprambiente.it, while data on economic indicators can be obtained from Istat (http://dati.istat.it/).
National
2002-2024
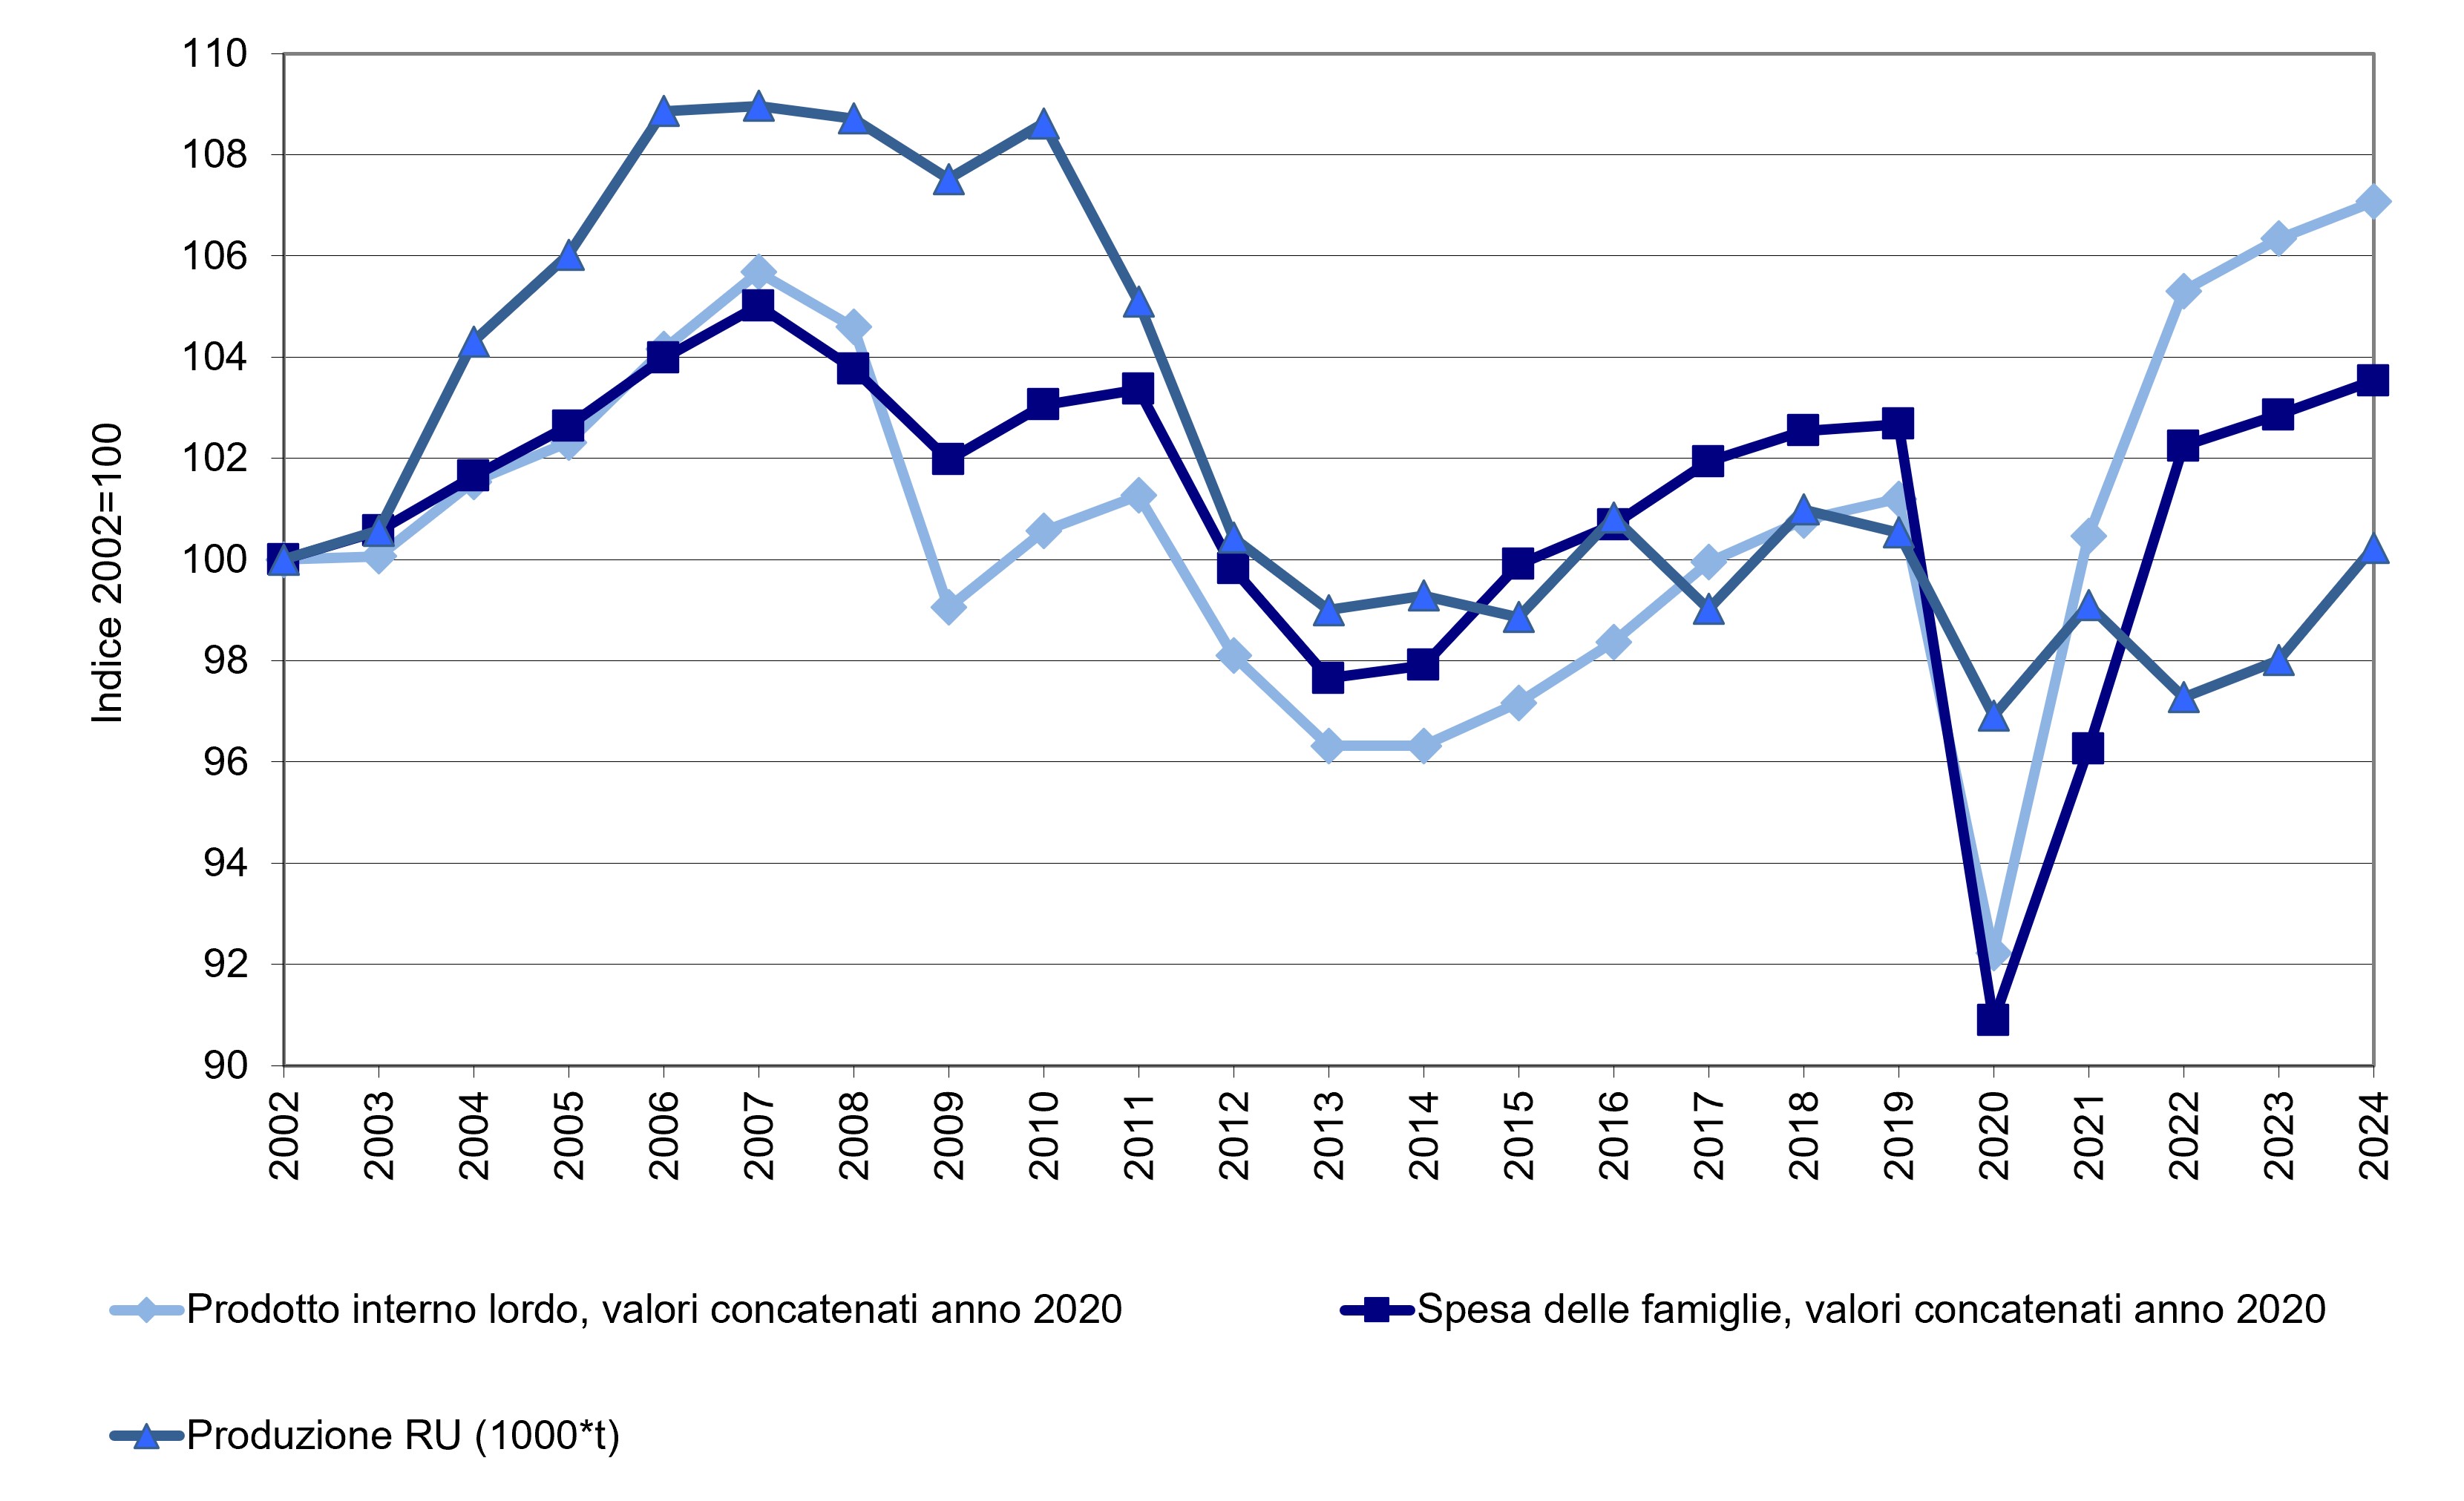
The indicator is obtained by relating the total quantity of municipal waste generated in Italy to GDP, chain-linked volumes with reference year 2020, and to final consumption expenditure by resident and non-resident households on the economic territory, chain-linked volumes with reference year 2020.
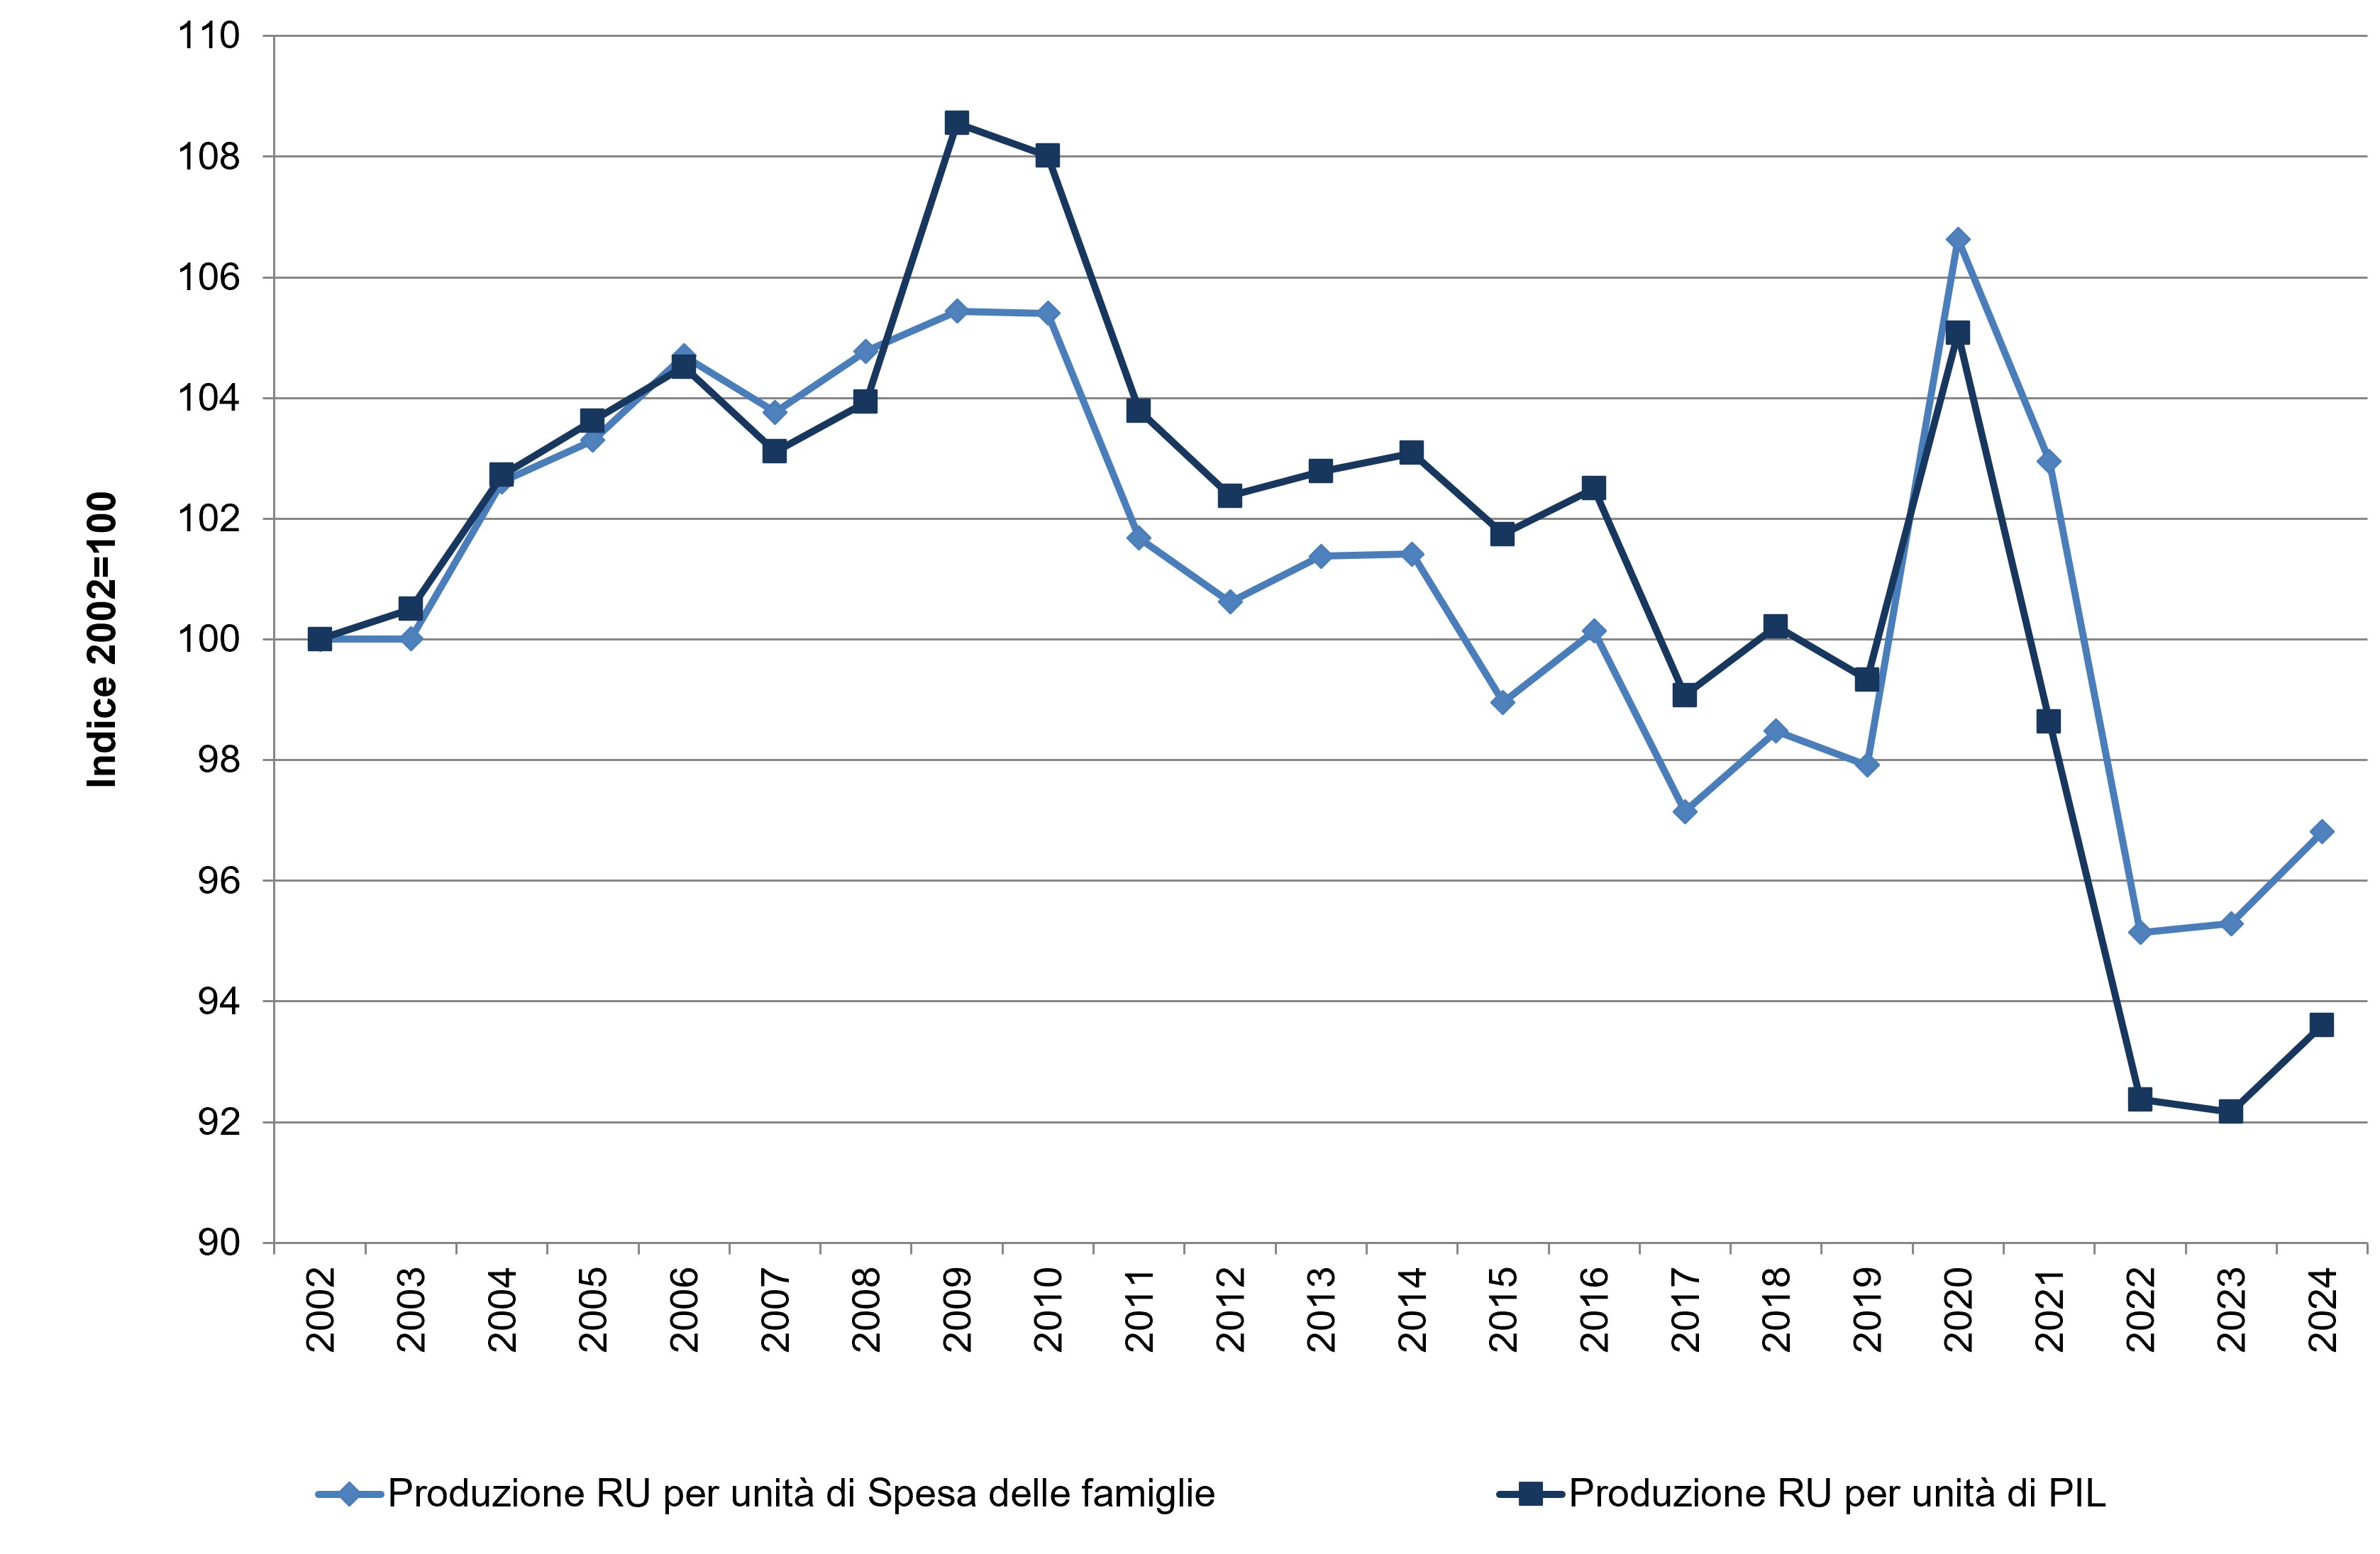
In 2024, municipal waste generation increased compared with the previous year (+2.3%), as did GDP and household consumption, both +0.7%. With reference to the waste prevention target set by the Directorial Decree of 7 October 2013, which established a 5% reduction by 2020 in municipal waste generation per unit of GDP compared with 2010, the target was achieved in 2024, with a reduction of 13.3% compared with 2010 (Figure 2).
From 2013 to 2019, municipal waste generation increased much more moderately than the socio-economic indicators. The situation differed in 2020, when municipal waste generation decreased compared with the previous year, although less sharply than the socio-economic indicators (Figure 1).
Analysis of the entire time series, 2002-2024, shows a decreasing trend for both ratios: -6.4% for municipal waste generation relative to GDP, and -3.2% for municipal waste generation relative to household expenditure (Figure 2).
| Data |
|---|
Thumbnail
Headline
Figure 1: Trend in municipal waste generation and main socio-economic indicators Data source
ISPRA processing based on ISPRA and Istat data |
Thumbnail
Headline
Figure 2: Trend in municipal waste generation per unit of GDP and per unit of household expenditure Data source
ISPRA processing based on ISPRA and Istat data |
The partly fluctuating trend in waste generation observed over the years may be correlated with several factors, also acting in combination. These include the introduction of new regulatory provisions which, for example, modified the definition or the accounting methods for the collection and management of municipal waste, as well as health-related or socio-economic factors, such as the 2020 pandemic and the 2022 international crisis, which affected consumption and, consequently, waste generation.
In general terms, although the 2024 figure increased compared with 2023, it nevertheless appears to reflect the generally downward long-term trend, with waste generation ranging, from 2012 onwards, between 29 and 30 million tonnes (Figure 1).
With regard to the effects of regulatory changes, generation data may be influenced by the introduction into Legislative Decree No. 152/2006 of Article 198, paragraph 2-bis, through Legislative Decree No. 116/2020. This paragraph allows non-household users to deliver their municipal waste outside the public collection service, provided that they can demonstrate that such waste is sent to operators ensuring its recovery. Waste falling under these cases may therefore no longer be fully accounted for, unlike in previous years, within municipal waste generation and separate collection data, and may consequently fall within the management framework for special waste.
A more detailed examination of the trend in municipal waste generation relative to household consumption, through the ratio between the annual values of the two indicators, shows that between 2013 and 2014 they followed a similar pattern, with the ratio remaining broadly stable. Between 2014 and 2015, by contrast, a divergent trend was observed, with a decrease in waste generation and an increase in consumption, resulting in a decline in the ratio.
In 2016, both indicators increased, with a slightly more pronounced increase in municipal waste generation. In 2017, growth in consumption was accompanied by a decrease in municipal waste generation, leading to a reduction in the ratio. In 2018, both indicators increased again, also in this case more markedly for waste, resulting in an increase in the ratio.
In 2019, municipal waste generation decreased slightly against an increase in consumption, resulting in a reduction in the ratio. In 2020, the ratio increased significantly, due to the decrease recorded for both indicators, which was more pronounced for household expenditure.
In 2021, both waste generation and consumption increased again, with a decline in the ratio due to the stronger increase in the socio-economic indicator. The decrease in the ratio continued in 2022, linked to the increase in household expenditure against a reduction in waste generation. In 2023 and, in particular, in 2024, both consumption and waste generation increased, but the increase was stronger for the latter, resulting in growth in the value of the ratio (Figure 2).