Devis Canesso, Elisa Coraci, Franco Crosato
The indicator shows the number of annual cases of tidal maximums, divided by height classes, detected at the station of Venice - Punta della Salute, representative of the historic city center. Monitoring the trend of the high and medium-high tide classes (above 80 cm compared to the ZMPS reference plane) allows you to control the pressure exerted both on the historic center of Venice (effects on the estate of the banks and buildings), and on the surrounding lagoon (environmental effects on the vegetation of the barenal habitats and on the greater erosion of the natural banks). In the last period, 2019 was an exceptional year as there were 28 cases of “high water”, i.e. exceeds of the threshold 110 cm on the ZMPS, record value of the entire historical series. As of 2020, the entry into operation of mobile barriers against flooding from high tide (model system "Mo.S.E.") has led to a differentiation in the number of cases of high water between the lagoon and the sea. 2024 recorded 12 cases of “high water” at sea and a single pass in Venice (on May 16, first case from 2021), thanks to the drive of the Mo.S.E. which defended the city.
The number of cases of high tide, divided by height classes, is useful to represent the extent of the floods of the Venetian historic center. The levels refer to the Zero Tise of Punta Salute 1897 (ZMPS), a plan adopted as a conventional reference for the measurement of the tidal levels of the tidal stations located in the Lagoon of Venice and in the arm of the sea in front of the Veneto coast. The indicator is based on the tidal data collected in the lagoon at the station of Venice - Punta della Salute (Cedena Canal side), belonging to the Mareographic Network of the Venice Lagoon and the North Adriatic - RMLV coastal arc (ISPRA) and, from 2020, also on the data collected at the sea at the mareographer installed at the Acqua Alta Platform station, belonging to the tidal network of the Centro Forecasts and Segnalations of the City of Venice.
Monitor cases of flooding of the Venetian urban area caused by tidal levels above the highest astronomical values. In addition, the trend is useful to monitor the changes taking place in Venice (and with a good approximation in the entire Venetian lagoon) and in the coastal arc North Adriatic, proving to be a solid basis on which to set adaptation and mitigation strategies for the future.
The indicator meets the knowledge requirements laid down by Directive 2000/60/EC on coastal waters and transitional waters and by Directive 2007/60/EC on the assessment and management of flood risks.
- AA.VV. (2020): “Novembre 2019 un mese di maree eccezionali. Dinamica e anomalia dell’evento del 12 novembre 2019” da http://www.venezia.isprambiente.it/ispra/index.php?action=download&upload_id=173884;
- Battistin D., Canestrelli P., (2006), "1872-2004 La serie storica delle maree a Venezia", pubbl. interna, Comune di Venezia - Istituzione CPSM;
- Comune di Venezia-CPSM, ISPRA, CNR-ISMAR, Previsioni delle altezze di marea per il bacino San Marco e delle velocità di corrente per il Canal Porto di Lido - Laguna di Venezia. Valori astronomici. 2025, Comune di Venezia-CPSM, ISPRA, CNR-ISMAR;
- ISPRA (2025) "Bollettino Meteo-Mareografico - Laguna di Venezia - Anno 2024" (www.venezia.isprambiente.it).
The indicator is significant for the Venetian historic center and, generally, for the Venice Lagoon as a whole. However, in special weather conditions, reaching certain tidal altitudes is not homogeneous throughout the lagoon. Typically these differences are recorded in the presence of strong local winds (Bora, in particular, and Scirocco) that are able to cause differentiated overlaps within the Venice Lagoon. It is not possible to export the tidal height classes so defined to other locations, located in areas other than the Gulf of Venice. The definition of tidal heights for which it is significant to calculate the frequency of overcoming depends primarily on the behavior of the astronomical tide at the site of interest and, secondly, on the thresholds of attention and alarm for the danger of flooding, specific to each place.
ISPRA
Centro Previsioni e Segnalazioni Maree del Comune di Venezia
This indicator is based on processing of validated data available in the DATA section of the siteweb www.venezia.isprambiente.it and data recorded by the CPSM of the Municipality of Venice.
Venice historic center and portion of the sea in front of the Venetian coast.
1924-2024
Absolute frequency of tide highs or equal to 80 cm and 110 cm above or more than or equal to the ZMPS. As of 2020, the activation of Mo.S.E.’s mobile gates has led to a differentiation in the number of high water cases recorded between the lagoon and the sea. For the class 80 cm, from 2020 the cases actually occurred in the historic center of Venice are reported, with the differentiated addition of the "missed cases", or measured only outside the lagoon but which would certainly have occurred even inside without the operation of the mobile gates. For the class 110 cm, from 2020 the cases recorded at Punta della Salute are reported in parallel with those registered with the Acqua Alta Platform; this representation allows to give continuity to the observations over time.
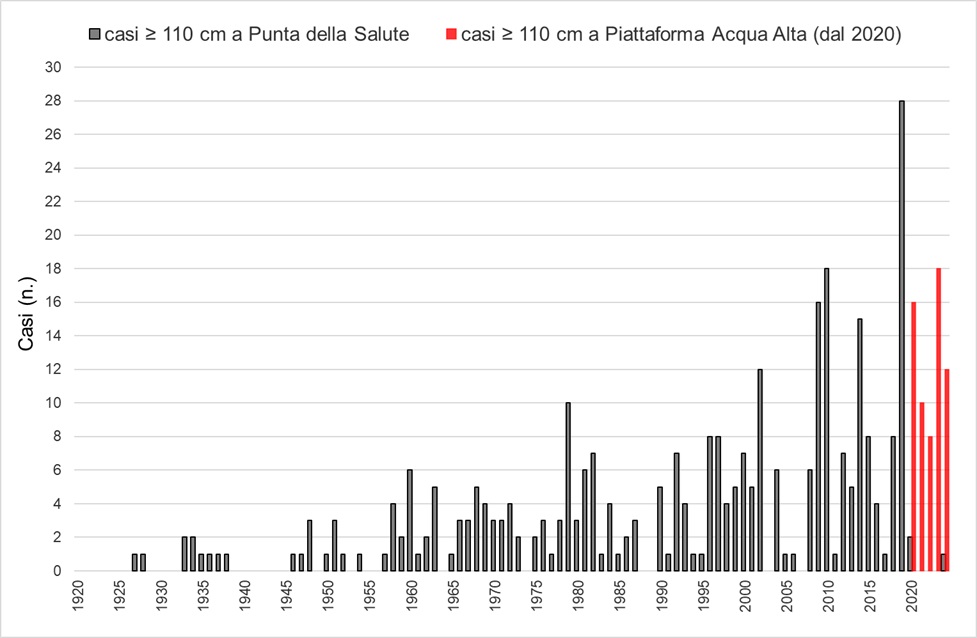
From 2020 onwards, thanks to the entry into operation of the Mo.S.E., in the historic center of Venice there were only 3 exceedances of an altitude of 110 cm on the ZMPS, two in 2020 and one on 16 May 2024 (with a length of stay above the threshold of only 15 minutes), while in the sea in 2024 12 cases of high water were recorded (Figure 2).
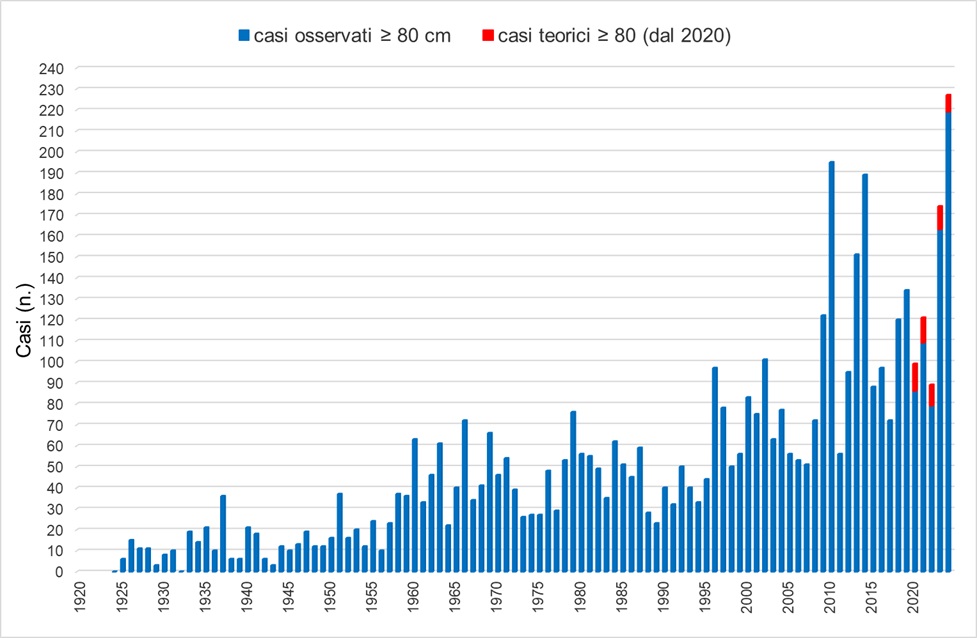
With regard to the threshold of 80 cm (minimum quota at which St. Mark’s Square begins to be flooded), in the historic center of Venice in 2024 there were 219 (absolute record of the entire historical series, clearly detaching the previous record of 195 cases in 2010). In addition, the number of cases would have been higher without the operation of the mobile gates: in fact, 8 exceedances were avoided (Figure 1).
The increase in the frequency of cases of high water is evident for both classes of height. The 2024 records the record for the height class 80 cm (227 cases: 219 measured and 8 theoretical, i.e. avoided for the use of Mo.S.E., Figure 1), while it is 2019 that stands out for the exceptionality of the numbers recorded in the height class of 110 cm, i.e. those events commonly called "high waters" (28 cases, Figure 2). 2020 and 2023 should also be reported for considerable values (respectively 16 and 18 cases), confirming the growing trend that has been taking place since 2009.
| Allegati |
|---|
Titolo
Table 1: Number of high tide cases ≥ 80 cm Fonte
ISPRA elaboration on ISPRA data and Forecast and Tie Reports of the Municipality of Venice Legenda
The annual absolute frequency of tidal maximums above or equal to 80 cm recorded in the period 1924-2024 at Punta della Salute is reported. From 2020, the theoretical ones are added separately to the measured cases, i.e. not occurred thanks to the operation of mobile gates. |
Thumbnail
Titolo
Figure 1: Water cases above 80 cm high Fonte
ISPRA elaboration on ISPRA data and Forecast and Tie Reports of the Municipality of Venice Legenda
The annual absolute frequency of tidal maximums above or equal to 80 cm recorded in the period 1924-2024 at Punta della Salute is reported. From 2020, the theoretical ones are added separately to the measured cases, i.e. not occurred thanks to the drive of mobile gates |
Titolo
Table 2: Number of High Tide Cases ≥ 110 cm Fonte
ISPRA elaboration on ISPRA data and Forecast and Tie Reports of the Municipality of Venice Legenda
The annual absolute frequency of the maximum tide above or equal to 110 cm recorded in the period 1924-2024 is reported. From 2020, together with the threshold exceedances measured at Punta della Salute, the exceedances detected in the open sea at the Acqua Alta platform station are also shown. |
Thumbnail
Titolo
Figure 2: High water cases above 110 cm Fonte
ISPRA elaboration on ISPRA data and Forecast and Tie Reports of the Municipality of Venice Legenda
The annual absolute frequency of the maximum tide above or equal to 110 cm recorded in the period 1924-2024 is reported. From 2020, together with the threshold exceedances measured at Punta della Salute, the exceedances detected in the open sea at the Acqua Alta platform station are also shown. |
To the obvious effects related to daily life in the historic center of Venice are added those that have as a consequence significant environmental impacts such as, for example, a more intense erosion of the coasts and the flats inside the lagoon, the loss of natural habitats, as well as the ascent of the saline wedge, able to alter the chimism of the interstitial waters of the surface clays, exacerbating the problem of subsidence by collapse of the clay layers. With regard to the tide class 80 cm (Figure 1), 2024 (227 cases: 219 measured and 8 theoretical), 2010 (195 cases) and 2014 (189 cases) are at the top three, respectively. As mentioned, from 2020 the operation of the mobile gates to the port mouths (Mo.S.E.) differently influences the frequency of the different tidal height classes inside the Venice Lagoon. Precisely for this reason, and in particular for the class representing the most extreme events (tide woods 110 cm on the ZMPS), it was necessary to support the historical lagoon series by carrying out the same statistical analysis on a tidal station placed at sea, so as to reach the correct information on the ongoing climate trends.