Valentina Bernarello, Andrea Bonometto, Rossella Boscolo Brusà, Federica Cacciatore, Michele Cornello, Federica Oselladore, Emanuele Ponis
The Ecological Classification Index of the Macroinvertebrate Biological Quality Elementary for Coastal Lagoons, M-AMBI (Multivariate-Azti Marine Biotic Index), is based on the analysis of the structure of the mobile macrozoobentonic community and takes into account the tolerance/sensitivity of species, community diversity and specific wealth. The M-AMBI index responds to anthropogenic and natural pressures affecting transition areas and describes the ecological quality status in 5 classes: high, good, sufficient, scarce and bad.
The monitoring of benthic macroinvertebrates for the application of the M-AMBI index has been active in the Venice Lagoon since 2011 with a three-year frequency. In the 12 years of monitoring, 4 sampling campaigns were carried out; in 2022 four water bodies out of eleven are in a “poor” state, the remaining in a “sufficient” state and the trend of comparison between all the years of monitoring is stable.
The M-AMBI (Multivariate-Azti Marine Biotic Index) is a multimetric index that includes the calculation of AMBI, the Diversity Index (H) and the species (S). The method of calculation of the M-AMBI involves the elaboration of the aforementioned metrics with techniques of multivariate statistical analysis.
This index is used to provide a synthetic ecological classification of the ecosystem through the use of structural parameters (diversity, specific richness and relationship between tolerant/sensitive species) of the mobile background macrozoobentonic community. The M-AMBI index, consolidated by a robust bibliographic support, is able to summarize the complexity of the communities of macro invertebrates of the bottom mobile, allowing an ecological reading of the ecosystem in question.
The value of the M-AMBI index varies between 0 and 1, and corresponds to the Ecological Quality Report (RQE) required by the Water Framework Directive 2000/60/EC.
The M-AMBI index is applied to the Mediterranean coastal lagoons (TW) as the Venice Lagoon.
The application of the index in the Venice Lagoon takes place through the calculation of the values of RQE within each of the eleven natural water bodies according to which it was divided: EC – palude Maggiore, PC1 – Dese, PC4 –Teneri, PC2 – Millecampi, PNC1 – Marghera, PNC2 – Tessera, ENC2 – Bocca di Lido, ENC4 – Sacca Sessola, ENC1 – Centro Sud, ENC3 – Chioggia, PC3 – Val di Brenta.
Classify the quality of the water bodies of the Lagoon of Venice using the organic quality element "bentonic macroinvertebrati".
Directive 2000/60 / EC
D.Lgs. 152/2006 and ss.mm.ii.
Decision 2018/229 / EU
Directive 2000/60/EC (received by Legislative Decree 152/2006 and subsequent amendments) establishes a regulatory framework for all Member States, for the protection of inland surface water, transitional water, coastal and groundwater that aims at the improvement and restoration of all surface water bodies, artificial water bodies and those strongly modified, in order to achieve a good state of the surface water by the current water.
Borja, A., Franco, J., Pe´rez, V., 2000. A marine biotic index to establish the ecological quality of soft-bottom benthos within European estuarine and Coastal environments. Marine PollutionBulletin 40 (12), 1100–1114.
Borja, A., Muxika, I., Franco, J., 2003a. The application of a marine biotic index to different impact sources affecting soft-bottom benthic communities along European coasts. Marine Pollution Bulletin 46, 835–845.
Borja, A., Franco, J., Muxika, I., 2003b. Classification tools for marine ecological quality assessment: the usefulness of macrobenthic communities in an area affected by a submarine outfall. ICES CM 2003/Session J-02, Tallinn (Estonia), 24–28 September 2003.
Borja, A., Franco, J., Valencia, V., Bald, J., Muxika, I., Belzunce, M.J., Solaun, O., 2004a. Implementation of the European water framework directive from the Basque country (northern Spain): a methodological approach. Marine Pollution Bulletin 48, 209–218.
Borja, A., Franco, J., Muxika, I., 2004b. The biotic indices and the water framework directive: the required consensus in the new benthic monitoring tools. Marine Pollution Bulletin 48, 405–408.
Muxica, I., Borja, A., Bald, J., 2007. Using historical data, expert judgemente and multivariate analysis in assessing reference condition and benthic ecological status, according to the European Framework Directive. Marine Pollution Bulletin 55, 16-29.
Constant updating of the species list used.
ARPAV (Arpa Veneto)
SINTAI
www.arpav.it
The Lagoon of Venice
2011-2013; 2014-2016; 2017-2019; 2020-2022
The M-AMBI (Muxika et al., 2007) includes the calculation of AMBI (Borja et al., 2000), Shannon-Wiener Diversity Index H' (1949) and the number of species (S):
AMBI= [(0 x %GI) + (1.5 x % GII) + (3 x % GIII) + (4.5 x % GIV) + (6 x %GV)]/100
GI: sensitive species
GII: sensitive/tolerant species
GIII: tolerant species
GIV: opportunist species (second order)
GV: opportunistic species (first order)
s
H' = - ∑ (pi)(log2 pi)
i=1
where the most numerical frequency of the i-thiphe site compared to the total of individuals ni/N; s is the total number of species present in each station.
The method of calculation of the M-AMBI involves the elaboration of the aforementioned metrics with techniques of multivariate statistical analysis. The value of the M-AMBI varies between 0 and 1 and corresponds to the Ecological Quality Report (RQE) required by the Directive. The type-specific reference values and class limits are reported in the reference legislation (Legislative Decree 152/2006 and ss.mm.ii.), which defines 5 classes (high, good, sufficient, scarce, bad).
For the calculation of the index it is necessary to use a free software (AZTI Marine Biotic Index: New Version AMBI 4.1) currently downloadable from the website www.azti.es. Being based on the ecological value assigned to the species present in the monitoring stations, the value of the M-AMBI must be calculated using in the software the latest available update of the list of species.
For the implementation of the AZTI software, it is necessary to build an Excel file that follows the species and observations (stations) in the column.
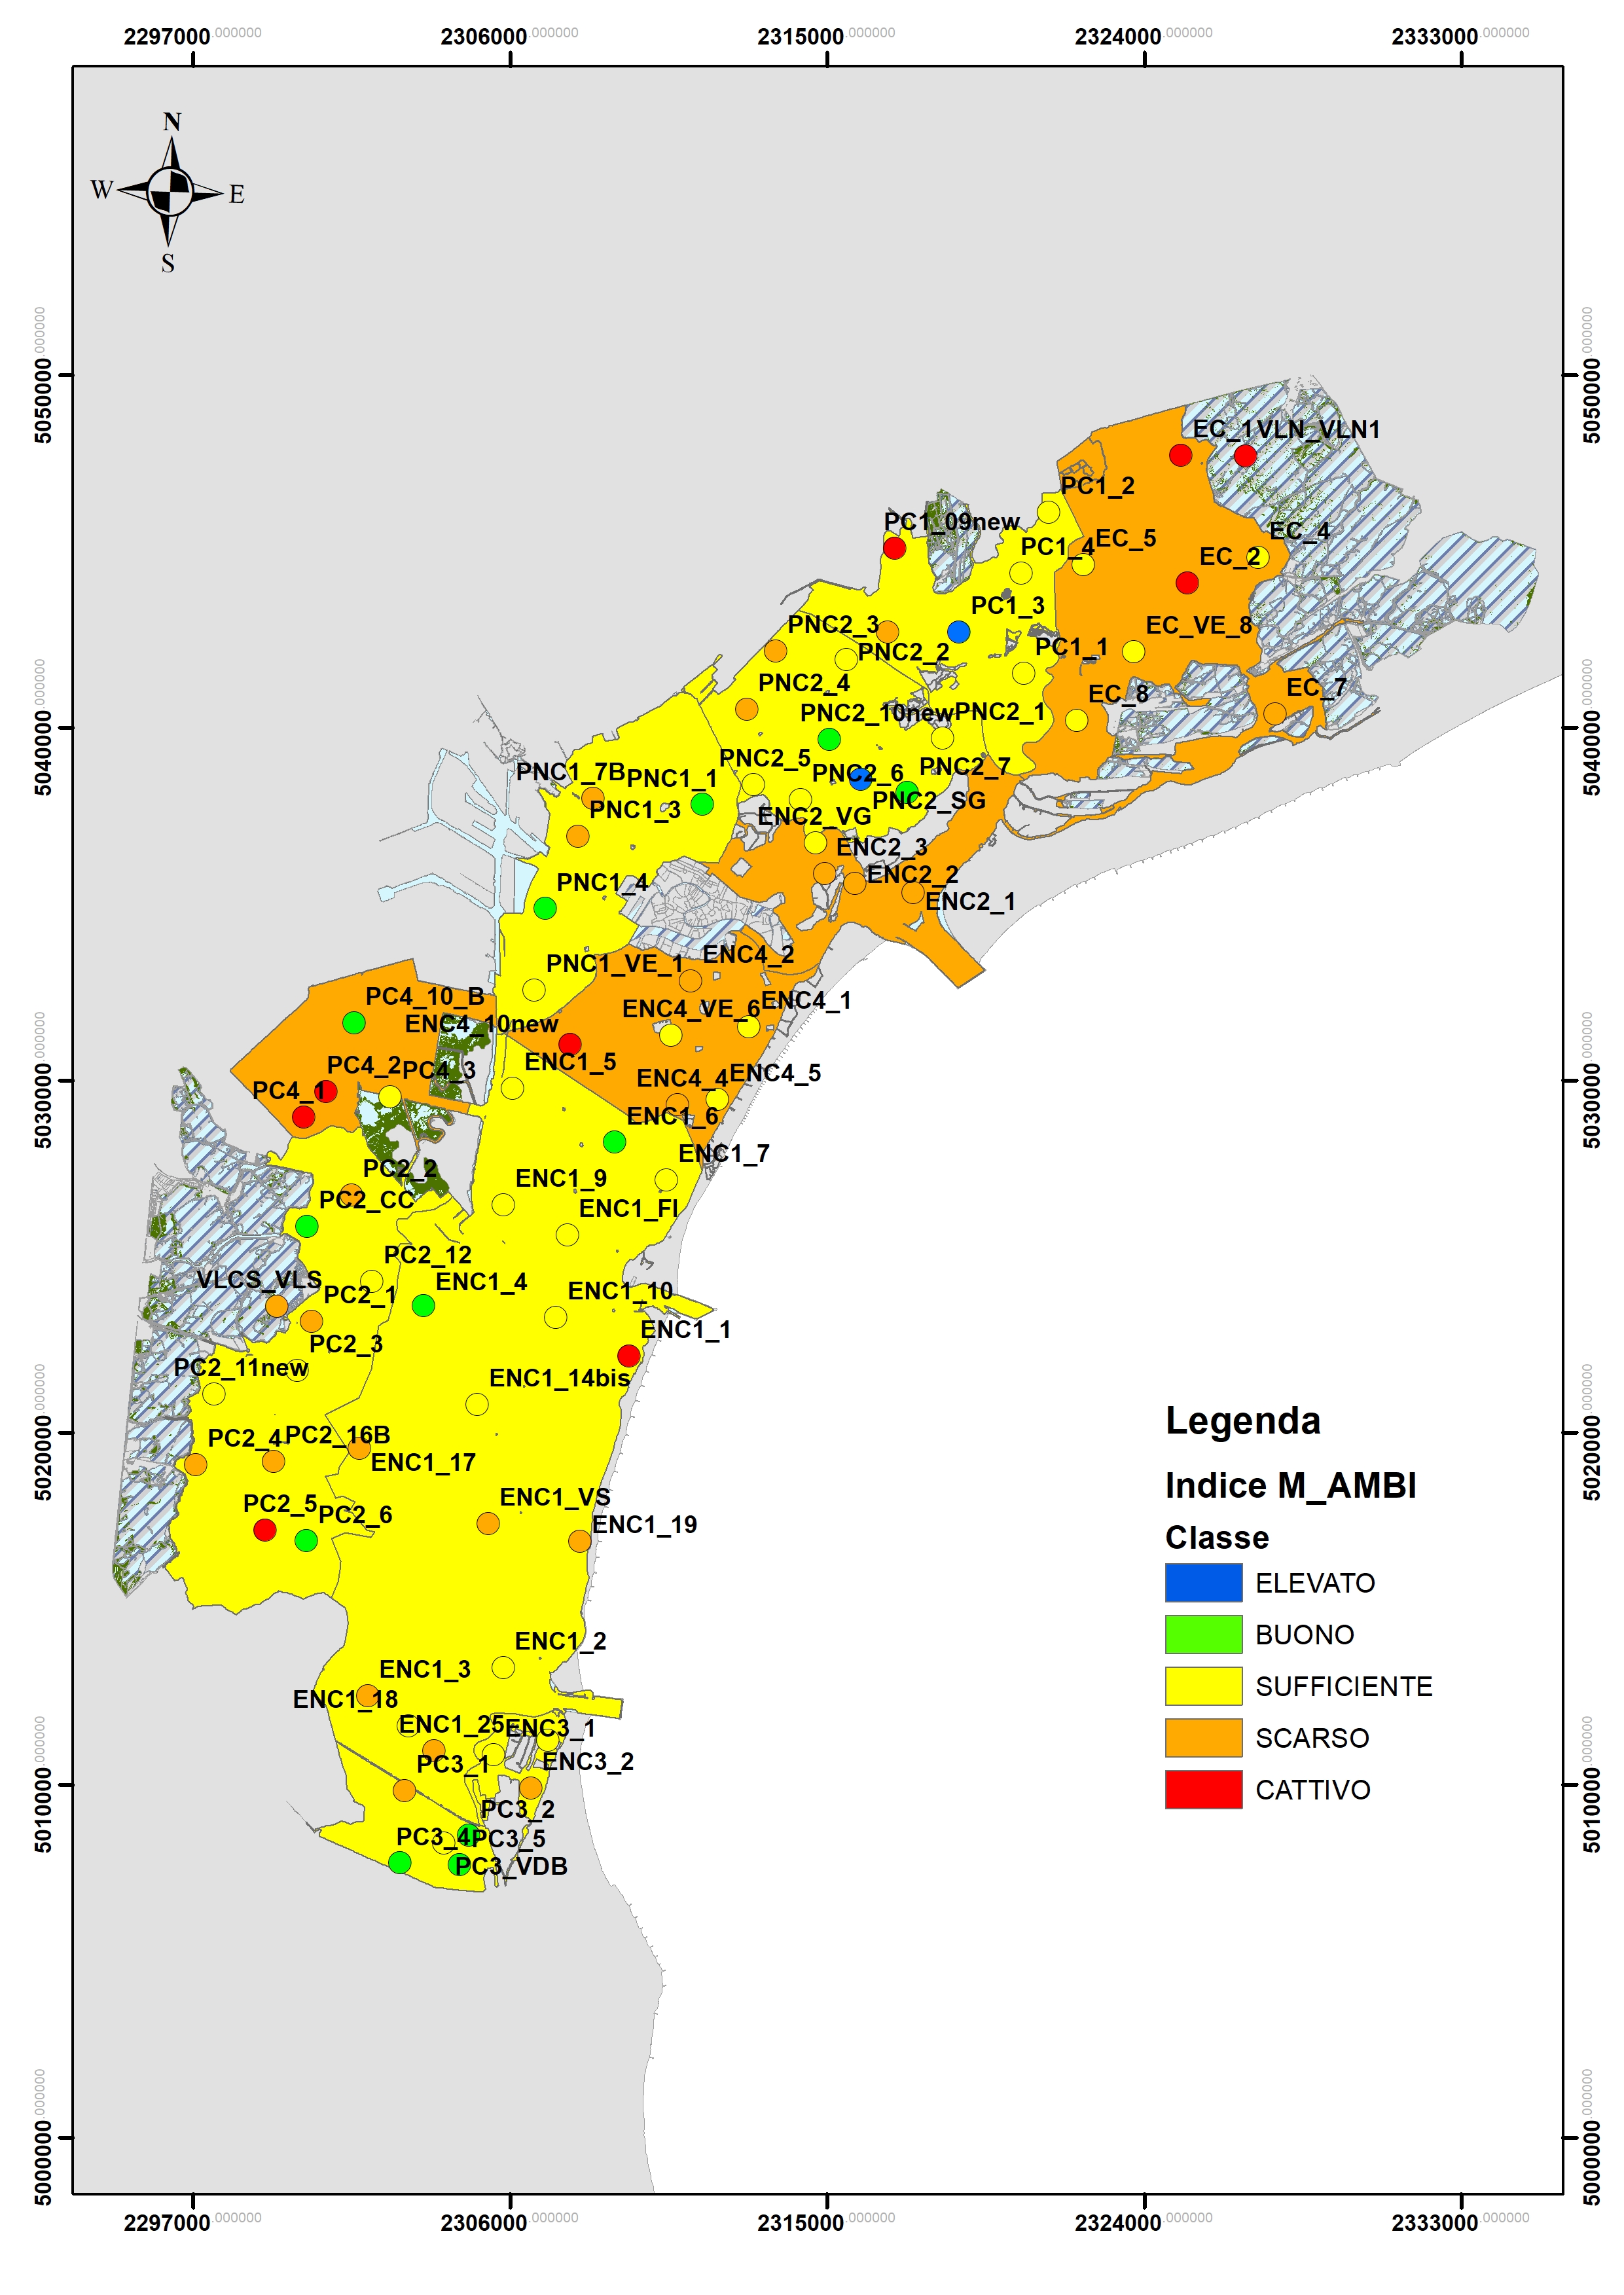
From the analysis of the M-AMBI index it is observed that in the three-year period 2020-2022 (data 2022), 7 bodies of water were found to be in a “sufficient” state and 4 in a “poor” state (Figure 1).
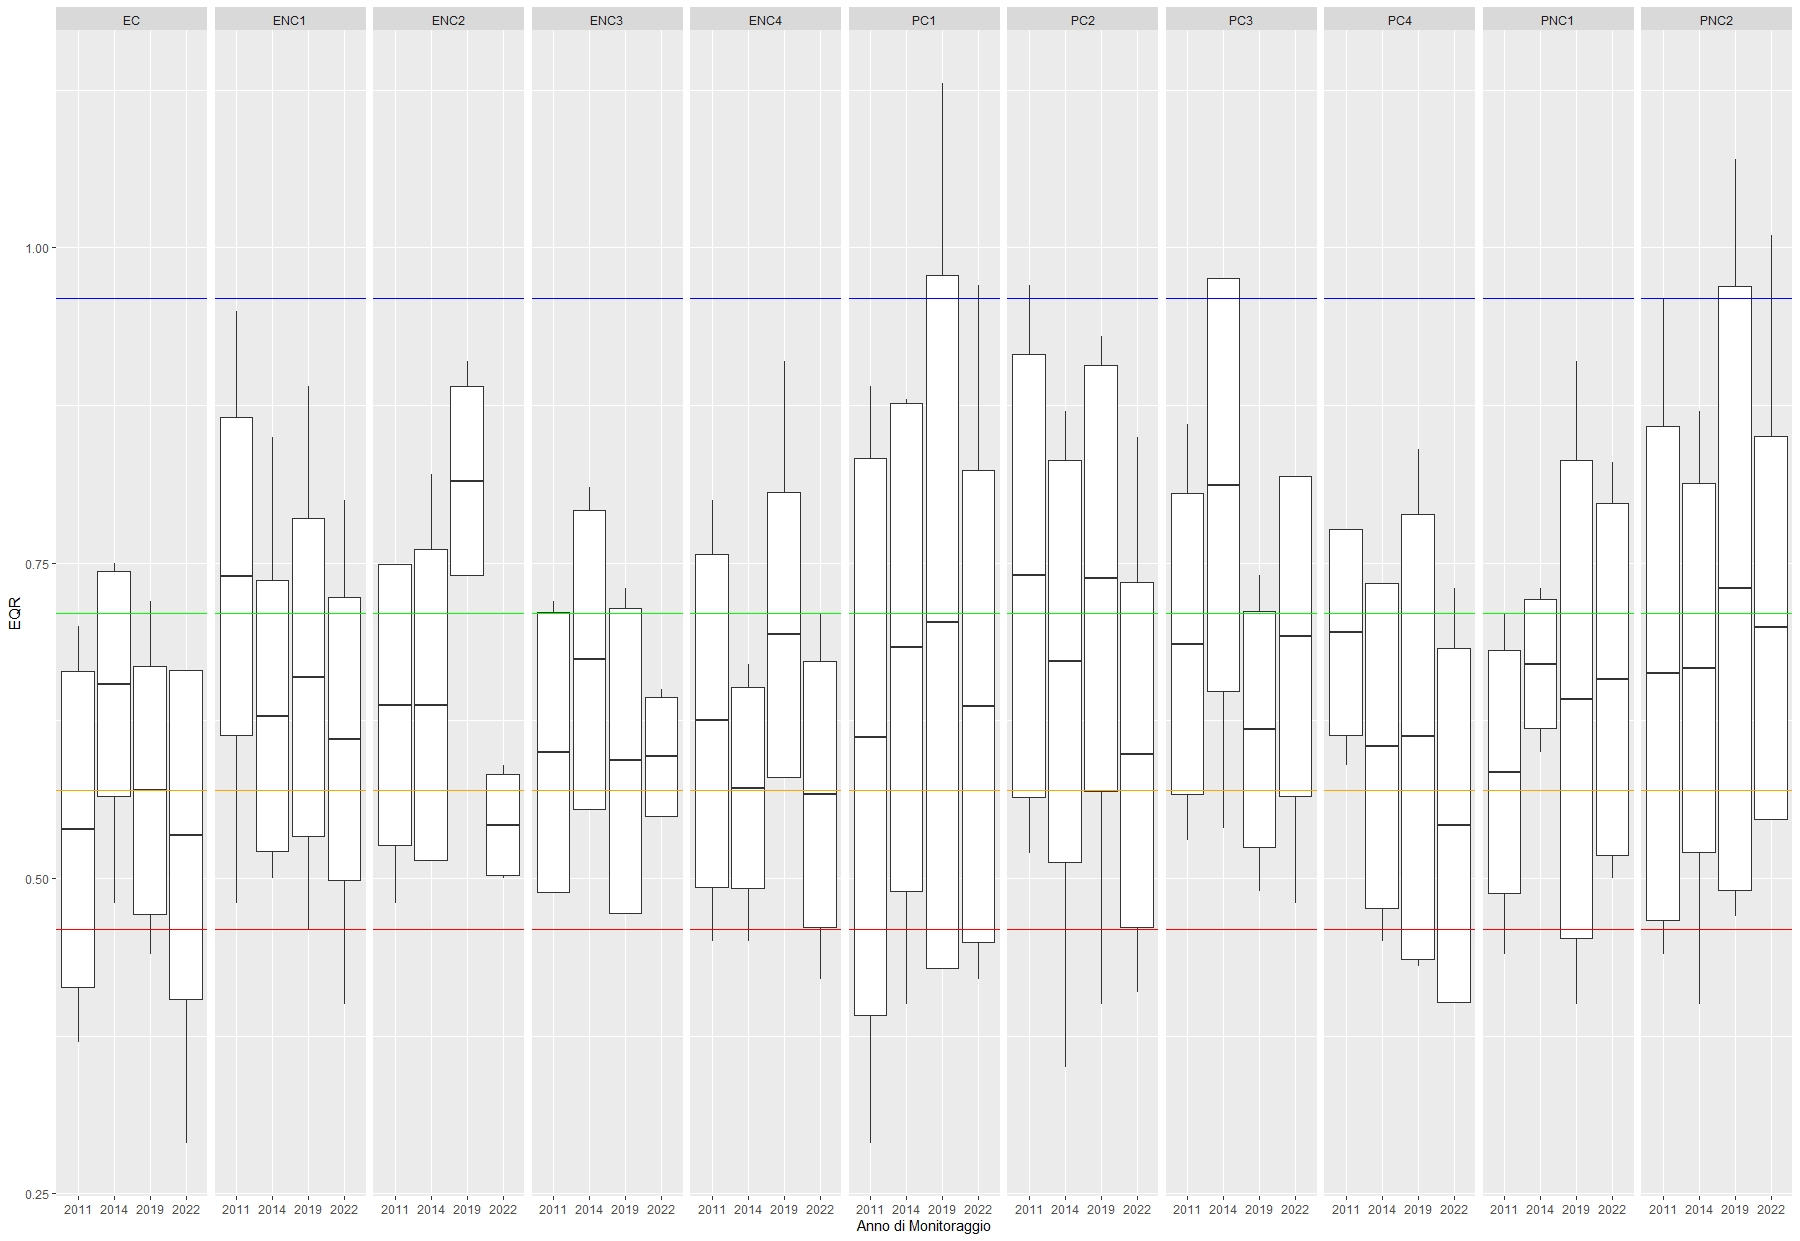
Compared to the previous monitoring cycles (three-year period 2011-2013 - 2011 data, 2014-2016 - data 2014, three-year period 2017-2019 – data 2019) the M-AMBI index shows in the three-year period 2020-2022 (data 2022) a relatively lower range (0.58-0.74 in 2011; 0.57-0.081 in 2014; 0.57-0.82 in 2019; 0.54-0.70 in 2022).
In comparison with the previous cycles, in 2020-2022 there is an increase in water bodies in an ecological “poor” state (1 in 2011 and 2014, none in 2019 and 4 in 2022), while none of the bodies of water is in “good” status (2 in 2011, 1 in 2014, 3 in 2019 and none in 2022). The considerable variability of behavior for the individual water bodies found in previous cycles is confirmed.
Two water bodies (ENC2 - Bocca di Lido and PNC2 - Tessera) show an increase in almost constant RQE in the first 3 monitoring cycles, which, however, decrease in the last three years until they lead to a downgrading of one (PNC2) or two quality classes (ENC2). In particular, ENC2 and PNC2 increase the ecological status from “sufficient” to “good” in 2019, and then move to “poor” and “sufficient” respectively in 2022. The body of water ENC1 – Central South worsens its state, moving from “good” in 2011 to “sufficient” in subsequent cycles, with a decrease in RQE. The PC1-Dese and PNC1-Marghera water bodies show an increase in RQEs through 2019, and then decreases in 2022, while maintaining the “sufficient” quality class. ENC3 – Chioggia also remains “sufficient” for all monitoring cycles with constant RQE over time. PC4 – Teneri maintains the “sufficient” state for the first 3 three-year-olds with a slight decrease in RQEs leading in the three-year period 2020-2022 to the “poor” downgrade. EC – Swamp Maggiore returns to the “poor” state in 2022, already found in 2011, passing through the “sufficient” state of the 2014 and 2019 monitors. Finally, an oscillation over the years between the “good” and “sufficient” state is observed in PC2 – Millecampi and PC3 – Val di Brenta, with the worst result in the last three years (Figure 2).
| Data |
|---|
Thumbnail
Headline
Figure 1: Application of the M-AMBI index in the water stations and bodies of the Venice Lagoon (three-year period 2020-2022) Data source
ISPRA - ARPAV |
Thumbnail
Headline
Figure 2: Box plot of M-AMBI values determined in 2011, 2014, 2019 and 2022 in the water bodies of the Venice Lagoon Data source
ISPRA - ARPAV Data legend
EQR = Ecological Quality Ratio. The colored bands correspond to the limits defined by Legislative Decree 152/2006 ss.mm.ii (blue = high, green = good, yellow = sufficient, orange = poor, red = bad). |
The application of the M-AMBI index to the water bodies of the Lagoon of Venice provides a general assessment of the macrozooptic component for 2022 (three-year period 2020-2022, Figure 1).
In 2022, the index defines the status of 4 water bodies as “poor” (EC, ENC2, ENC4 and PC4), while all other water bodies are classified as “sufficient” (ENC1, ENC3, PC1, PC2, PC3, PC3, PNC1 and PNC2). Compared to 2011, in 2022 the worsening of four water bodies (ENC1, downgraded to “sufficient” in 2013 following the verification carried out for the conditions of anoxia, ENC2, ENC4 and PC4), is observed, while the remaining bodies of waterrene remain unchanged, all in a “sufficient” state (ENC3, PC1, PC2, PC3, PC4, PNC1, PNC2). Also compared to 2014, in 2022 the worsening of 4 water bodies (EC, ENC2, PC3 passing from the “good” to “sufficient” state and PC4) is observed, while the remaining seven bodies of water remain unchanged and “sufficient” (ENC1, ENC3, PC1, PC4, PNC1). 2019 was the year with a greater number of “good” CIs so the comparison with 2022 shows the maintenance of the “sufficient” class for five CIs (ENC1, ENC3, PC1, PC3, PC3, PNC1) and the worsening of one or two quality classes for the remaining six CIs (two classes: ENC2, one class: EC, ENC4, PC2, PC4, PNC2) (Figure 2).