Devis Canesso, Elisa Coraci, Franco Crosato
The weather variables observed in the Venice Lagoon (the average annual atmospheric pressures, the total annual rainfall, the number of rainy days and thermal anomalies) allow to photograph the climate changes taking place. During 2024, in the presence of an average annual pressure of 1,0155.9 mbar (below 0.3 mbar compared to the average of the reference period), 1,127 mm of rain were recorded (+34% compared to the average) over a period of 96 rainy days, while temperatures continue to show themselves in trend and continuous increase.
The indicator aims to monitor the annual changes in average atmospheric pressure, the total amount of precipitation, the number of rainy days and the anomalies of average temperatures, such as local expression of climate change. The Venice Lagoon is an extremely important area not only for the historical and cultural heritage (UNESCO site since 1987), but also because it is a specific site of national interest for the flora and fauna present: much of the lagoon is in fact an area of the SIC (Site of Community Importance) and ZPS (Special Protection Area). It is one of the most important European sites of step and nesting for the migratory bird, protected by the specifications Directives 92/43/EEC (Habitat Directive) and 2009/147/EC (Bird Directive). Finally, part of the Venice Lagoon is included in the list of wetlands of international importance under the Ramsar Convention (1971).
Monitor local climate variations. Since the Lagoon of Venice is an area particularly sensitive to climatic variations and its immediate repercussions with regard to the growth of the average sea level, it is of considerable interest to monitor with continuity also other physical quantities that can contribute, both directly (regime of pressures) and indirect (precipitation and changes in temperature), to change the delicate lagoon balances and the entire coastal belt.
The indicator shall meet the knowledge requirements set out in Annex II to Directive 2000/60/EC on coastal waters and transitional waters.
- Osservatorio della Laguna e del territorio del Comune di Venezia (www.atlantedellalaguna.it);
- Smart M., Vinals M., (2005) "La Laguna di Venezia: zona umida di importanza internazionale ai sensi della Convenzione di Ramsar", Provincia di Venezia;
- Magistrato alle Acque di Venezia - Ufficio Idrografico, Annali Idrologici;
- ISPRA (2025) "Bollettino Meteo-Mareografico - Laguna di Venezia - Anno 2024" (www.venezia.isprambiente.it).
The monitoring station is located on the island of Lido di Venezia, a coastal cordon in front of the homonymous lagoon and therefore characterized by a specific coastal microclimate. The indicator, although representative of the coastal strip, with a good approximation is also significant for the lagoon basin behind.
Increase the robustness of the indicator by keeping continuous monitoring of selected physical quantities active.
ISPRA
ARPA Veneto
This indicator is based on processing of validated data available in the DATA section of the website www.venezia.isprambiente.it
The Lagoon of Venice
1986-2024
- For atmospheric pressure: annual arithmetic mean of the observed pressure, sampling every 10 minutes (until 2019) and every 5 minutes (from 2020);
- For precipitation: annual summation of rainfall recorded every 10 minutes (until 2019) and every 5 minutes (from 2020) and number of rainy days (days with a minimum of 1 mm of rain recorded);
- For temperature: annual and monthly anomalies calculated compared to the average for the period 1991-2020.
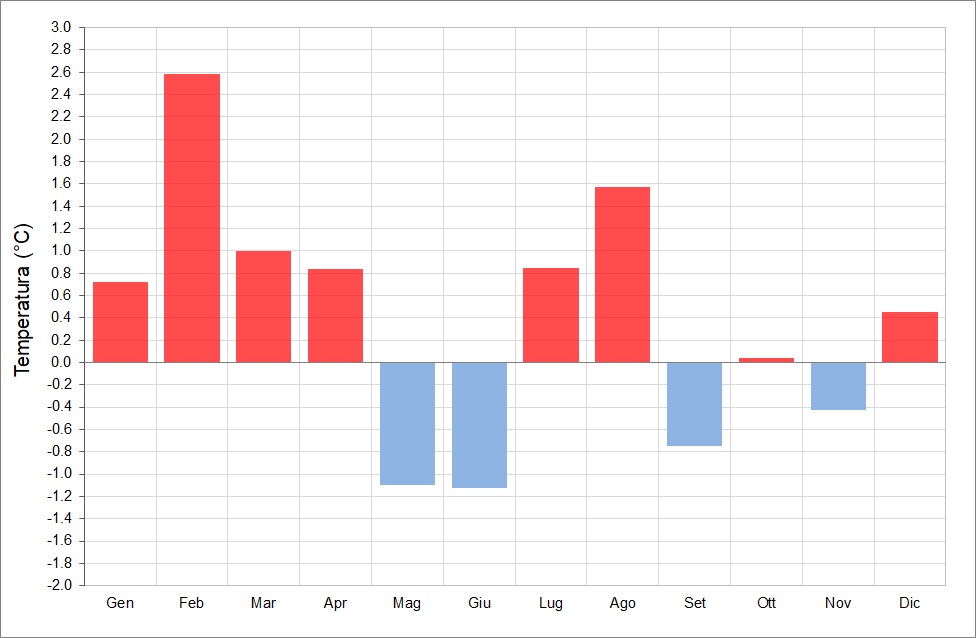
The physical quantities considered (specifically the average annual atmospheric pressure, the amount of annual precipitation and the number of rainy days) show in the last period a marked variability, with a tendency to increase the extremization of weather phenomena. In 2024 there was an average annual pressure of 1,0155.9 mbar, 0.3 mbar lower than the reference period 1991-2020 and a total rainfall falling greater than 34% (1,127 mm). From the examination of the trend of the monthly thermal anomalies of the maximum temperatures recorded in 2024 compared to the monthly averages of the reference period (Figure 3), in the winter and summer months are highest values higher than average, with the greatest differences in February (+2.6 C) and August (+1.6 C). On the other hand, a negative thermal anomaly is reported in the spring and autumn periods with the months of May and June characterized by the lowest values compared to the average (-1.1 degrees C). As for the annual thermal anomalies of the maximum temperatures, 2024 is therefore always above the average of the thirty-year reference period, with an average deviation of +0.4 degrees C (Figure 4).
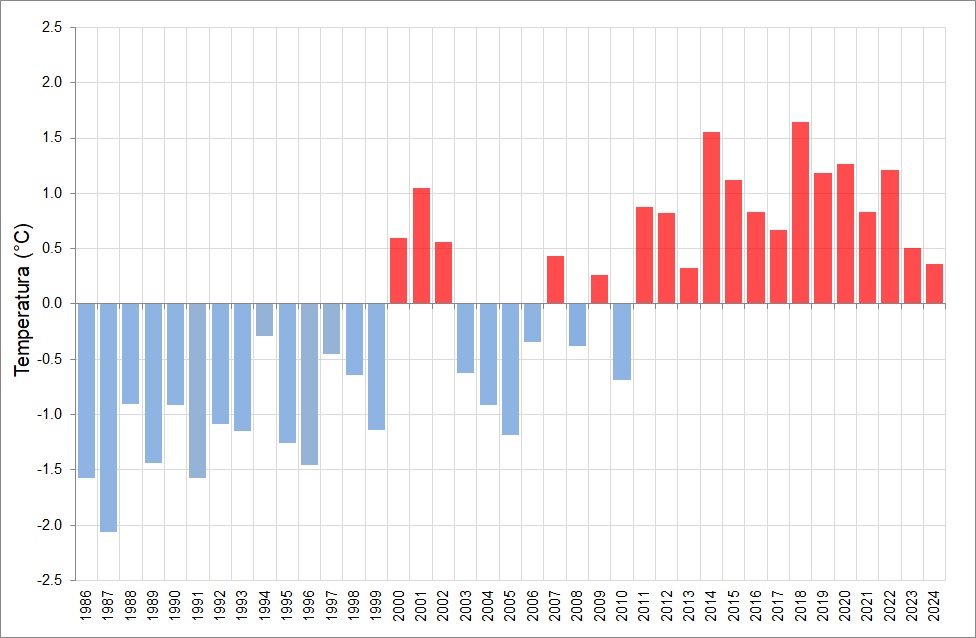
The analyzed series of atmospheric pressure (annual average) and precipitation (annual amount and number of rainy days) recorded a marked increase in variability since the mid-1990s, with a tendency to increase the number of extreme weather phenomena. As for the maximum temperatures, the anomalies calculated for the period 1991-2020 are constantly growing. 2011 began the period on average warmer than forty years in analysis (Figure 4). All the indications that emerged agree to define the trend in place negative.
| Data |
|---|
Thumbnail
Headline
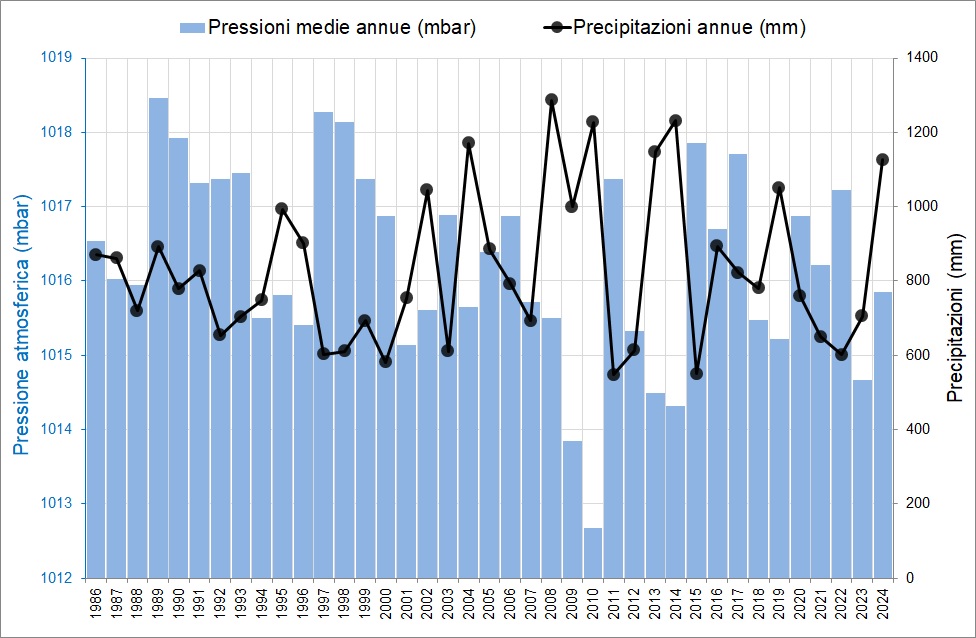
Figure 1: Average pressure and total annual precipitation Data source
ISPRA processing on ISPRA and ARPA Veneto data |
Thumbnail
Headline
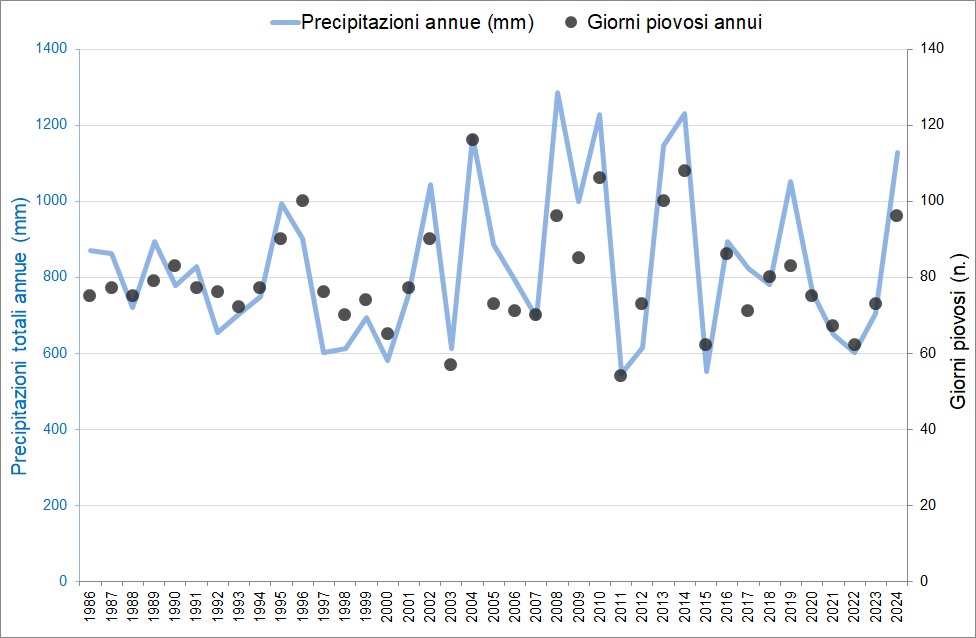
Figure 2: Annual precipitation and number of rainy days Data source
ISPRA processing on ISPRA and ARPA Veneto data |
Thumbnail
Headline
Figure 3: Monthly thermal anomalies of the maximums Data source
ISPRA processing on ISPRA and ARPA Veneto data Data legend
Thermal abnormalities calculated compared to the average period 1991-2020 |
Thumbnail
Headline
Figure 4: Annual thermal anomalies of the maximum Data source
ISPRA processing on ISPRA and ARPA Veneto data Data legend
Thermal abnormalities calculated compared to the average period 1991-2020 |
The average annual atmospheric pressure is closely associated with the rain regime: a low atmospheric pressure corresponds to a trend increase in precipitation and vice versa (Figure 1). During the reference period, a decrease in average barometric pressure is to be noted, accompanied by an increase in variability in blood pressure regimes. Remarkable are, in fact, the violent oscillations of the medium pressure fields, which have an evident fallout on the total amount of rainfall: see, by way of example, the exceptional variation between 2010 and 2011 and again between 2014 and 2015. The annual trend of total precipitation and rainy days (Figure 2) shows a substantially stable period (1986-2001) due to the amount of rainfall and the number of rainy days (on average 750 mm and 80 rainy days per year). From 2002 onwards, the trend becomes more unstable with strong variations between rainier years (2004, 2008, 2010, 2013, 2014 and 2024) and driest years (2003, 2011, 2012, 2015 and 2022). In particular, 2011 and 2015 are the driest years of the entire historical series, with about 35% less rain falling than the average of the reference period (839 mm). The increased variability recorded in total annual rainfall is also reflected in the number of rainy days, which shows a rather stable trend in the late 1980s and the first half of the 1990s. Subsequently, until the early 2000s, interannual oscillations increased. Starting from 2003 the variations become marked, sometimes not even aligned between the values of total rain and rainy days, often presenting a very high amount of rainfall in a relatively low number of rainy days, a correlation that tends to explain the manifestation of increasingly severe weather phenomena. In 2024, 96 rainy days were recorded, i.e. 16 days more than the average of the reference period. As regards the trend of temperatures, from Figure 4 a clear discontinuity emerges between the 90s and 2000, the moment of the marked change in the trend of average temperatures over the last thirty years. Overall, the last 14 years therefore stand as the warmest period of the entire period under analysis.