Andrea Bonometto, Devis Canesso, Elisa Coraci, Franco Crosato
The indicator measures the increase in the average sea level in Venice, being of fundamental importance for the studies and conservation interventions of the city of Venice, as well as the lagoons and high Adriatic coastal areas at risk of flooding. In Venice, the average sea level has increased since the beginning of the recordings: in the period 1872-2024 the level increases by an average of 2.6 mm / year, with a trend not always constant and uniform over time. In this regard, it is considered appropriate to highlight the rate for the last thirty years (1993-2024), where the average sea level rise is almost doubled (4.8 mm/year).
The growth of the average sea level in Venice is due to the combined effect of the phenomena of exhaustism (increase in the average level of the seas on a global scale) and subsidence (vertical lowering of the ground as a result of the compaction of the soils) linked to the particularity of the geology of the Italian high Adriatic coast. The indicator is based on the hydrometric level data collected at the tiloographic station of Venice - Punta della Salute (Chantal Giudecca side), belonging to the Mareographic Network of the Venice Lagoon and the coastal arc North Adriatico (RMLV) of ISPRA, for which structure, articulation and functionality refer to the website www.venezia.isprambiente.it.
The indicator allows to measure the variations of medium/long period of the relative average sea level recorded in Venice. The comparison between the trend of the middle sea level of Venice with that of other Adriatic tinographed stations placed on rocky platforms with characteristics of good geological stability (eg. Trieste - Molo Sartorio) allows to indirectly estimate the loss of altitude of the lagoon city due to the phenomenon of subsidence. In addition, the indicator is useful to monitor the changes taking place in Venice (and with a good approximation in the entire Venetian lagoon), proving to be a solid basis on which to set up adaptation and mitigation strategies for the future.
The indicator meets the knowledge requirements laid down by Directive 2000/60/EC on coastal waters and transitional waters and by Directive 2007/60/EC on the assessment and management of flood risks.
- AA.VV. (2020): “Novembre 2019 un mese di maree eccezionali. Dinamica e anomalia dell’evento del 12 novembre 2019”, da http://www.venezia.isprambiente.it/ispra/index.php?action=download&upload_id=173884;
- APAT (2006), "Aggiornamenti sulle osservazioni dei livelli di marea a Venezia";
- Magistrato alle Acque di Venezia - Ufficio Idrografico, Annali Idrologici;
- Baldin G., Crosato F., (2017), "L'innalzamento del livello medio del mare a Venezia: eustatismo e subsidenza", ISPRA, Quaderni - Ricerca Marina n. 10/2017;
- Battistin D., Canestrelli P., (2006), "1872-2004 La serie storica delle maree a Venezia", pubbl. interna Comune di Venezia - Istituzione CPSM;
- Comune di Venezia-CPSM, ISPRA, CNR-ISMAR, Previsioni delle altezze di marea per il bacino San Marco e delle velocità di corrente per il Canal Porto di Lido - Laguna di Venezia. Valori astronomici. 2025, Comune di Venezia-CPSM, ISPRA, CNR-ISMAR;
- ISPRA (2025) "Bollettino Meteo-Mareografico - Laguna di Venezia - Anno 2024" (www.venezia.isprambiente.it);
- Cordella M. et al. (2011) "Le tavole annuali di marea per Venezia", Atti dell'Istituto Veneto di Scienze, Lettere e Arti Tomo CLXIX (2010-2011) 43-59; - IOC (1985), "Manual on sea level measurement and interpretation", UNESCO;
- ISPRA (2012), "2010: un anno da ricordare per l’eccezionale crescita del livello medio mare a Venezia e nel Nord Adriatico", Quaderni - Ricerca Marina n. 4/2012;
- ISPRA (2012), "Manuale di mareografia e linee guida per i processi di validazione dei dati mareografici", Manuali e Linee guida n. 77/2012;
- Rusconi A. (1983), "Il comune marino a Venezia". Pubbl. n.158 dell'Ufficio Idrografico del Magistrato alle Acque, Gasparoni, Venezia;
- Rusconi A. (1993), "Tidal observation in the Venice Lagoon. The variations in sea level observed in the last 120 years";
- www.venezia.isprambiente.it
The indicator refers to the Venice Lagoon and in particular to the historic center of Venice. The mareographer of Venice - Punta della Salute is taken as a general reference of the lagoon, both by virtue of the long series of available data and for the central position with respect to the lagoon itself. However, with due precautions, it can also be considered representative of the coastal strip in front of the lagoon basin. All the tidal observations refer to the Tides Zero of Punta della Salute 1897 (ZMPS), a reference plan considered solidarity with respect to the historic center of Venice.
ISPRA
Centro Previsioni e Segnalazioni Maree del Comune di Venezia
This indicator is based on processing of validated data available in the DATA section of the site web www.venezia.isprambiente.it and data recorded by the CPSM of the Municipality of Venice.
The Lagoon of Venice
1872-2024
Weighted average decadal sea level, monthly (availability of maximum and tidal lows data: years 1924-1988). Simple arithmetic mean of the observed tide (availability of data at hourly intervals or time frames: 1989-2019 years). Since 2020, the entry into operation of mobile barriers against flooding from high tide (Mo.S.E. system) has required to calculate the average sea level of Punta della Salute in two different ways. The first, in analogy with the past, considers the average sea level really recorded in the historic center of Venice during the year, taking into account the entire annual validated series, including the values measured during the closures of the Mo.S.E. In the second, the sea level of Punta della Salute is integrated, on the days of closure of the movable barriers, with the average level of the daily sea calculated at Platform Acqua Alta, a station located at sea about 8 nautical miles off the coast in front of Venice. This latest elaboration allows you to keep the over-hundred-natured historical series of Punta della Salute continuous and up-to-date, as the daily value recorded at sea is considered comparable and consistent with what would have been recorded in Venice in the absence of actuation of the Mo.S.E.; the levels at sea, are in fact listed on the common reference plan ZMPS 1897. Table 1 from 2020 both values calculated as described are reported, while in Figure 1 from 2020 only the value calculated with the second method is graphicised.
The rise of the average sea level represents in Venice a source of danger for buildings, historical-cultural heritage, infrastructure, people and natural habitats present in the surrounding lagoon environment. The average sea level in Venice in the last period showed the record values of the entire historical series, so much so that in 2024 it was equal to 4.1 cm, the first absolute value after the highs of 2010 and 2014 (respectively equal to 40.5 cm and 40.0 cm on the ZMPS respectively). It should be noted that in 2024 the average sea level showed for 6 consecutive months (from April to September) the highest seasonal values ever. In addition, on the side of this semester, we note the exceptionality of the months of March (third March of the historical series) and October (according to October of the series).
The relative average sea level has been increasing in Venice since the beginning of the surveys (1872). During the entire period, however, the curve has not always shown a constant positive slope (Figure 1). In fact, phases are evident characterized by relative stability or even countertrend (approximately between 1915 and 1925 and between 1965 and 1995), and others in which there is a strong increase (between the 1930s and 1960s and the period from the mid-1990s to the present day). The average sea level has been very high since 2009, so much so that the last 16 years of the historical series are the highest ever.
| Data |
|---|
Headline
Table 1: Average sea level in Venice Data source
ISPRA elaboration on ISPRA data and Forecast and Tie Reports of the Municipality of Venice Data legend
The average annual sea level calculated for the period 1872-2024 is reported, together with the middle sea level of each decade. |
Thumbnail
Headline
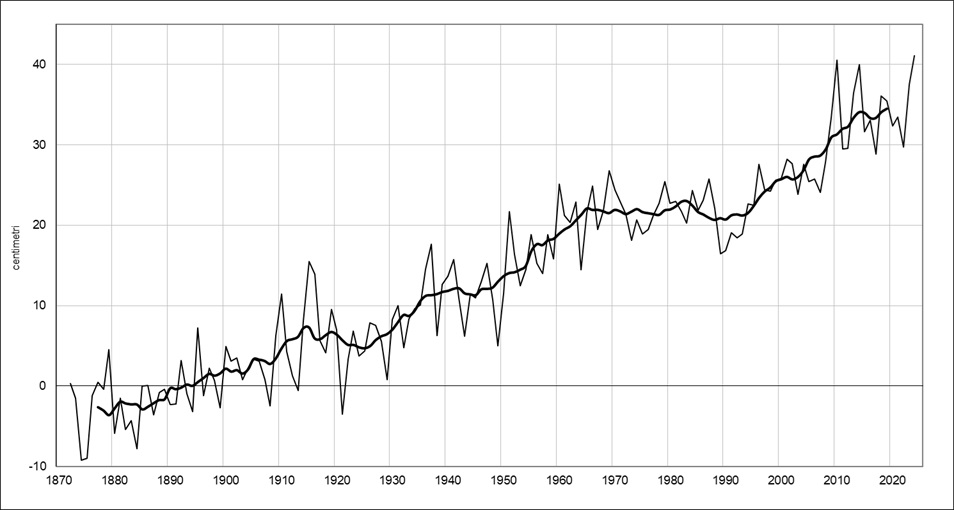
Figure 1: Average sea level in Venice Data source
ISPRA elaboration on ISPRA data and Forecast and Tie Reports of the Municipality of Venice Data legend
The average annual sea level calculated for the period 1872-2024 is reported, together with the middle sea level of each decade. |
The systematic measurements of the tide in Venice began in 1872. Before that date, only qualitative information and records were available compiled at high water events. The middle sea level, although with the variability inherent in the phenomenon, shows a trend increase from the beginning of the observations (Table 1). The phenomenon of the average sea level rise in Venice is mainly the sum of two components: eustateism (riseling the average sea level due to the global warming phenomena of the planet) and the subsidence (progressive local lowering of the countryside plan). In particular, the rapid growth of the average sea level recorded between the 50s and 60s, but already begun between the 20s and 30s of the last century, was related to the subsidence of an anthropogenic nature caused by the activity of emunging of the aquifers at the industrial area of Porto Marghera. Subsequently, in conjunction with the reduction in extraction from wells at the beginning of the 1970s, the situation stabilized until the first half of the 1990s, when the mid-sea level rose again for exhaust waste. Since 2009, the pace of growth has accelerated further, ensuring that the last sixteen years have had the highest values of the average sea level since the beginning of systematic records (1872). If in the long period (1872-2024) the rate of increase in the medium sea average is on average at 2.6 mm/year, it is appropriate to highlight the significant increase recorded in the last thirty years: from 1993 to 2024 the rise in the middle sea level was 4.8 mm/year.