Panel 1
Antonio Amoroso, Sabrina Barbizzi, Fabio Cadoni, Diego Capobianco, Giada Marchegiani, Vanessa Ubaldi
With regard to air quality, interlaboratory comparisons are carried out in compliance with Article 17 of Legislative Decree No. 155 of 13 August 2010, implementing Directive 2008/50/EC. This regulatory framework was subsequently amended by Legislative Decree No. 250/2012 and by Ministerial Decree of 26 January 2017 transposing Directive (EU) 2015/1480, which requires institutions responsible for the management of monitoring networks to participate in national quality assurance programmes organised by ISPRA, pursuant to Ministerial Decree of 4 February 2022, No. 67, which designates ISPRA as the National Reference Laboratory for air quality.
Participation of a laboratory in performance evaluation exercises through interlaboratory comparisons represents an operational tool within quality assurance and quality control (QA/QC) activities, supporting the demonstration of competence in the application of the measurement methods in use. The quality of laboratories’ analytical performance is assessed in terms of compliance or non-compliance with acceptability criteria established a priori by technical standards or, in some cases, by more stringent, purpose-oriented criteria adopted by the European Commission in comparable studies.
With reference to air quality monitoring measurements, comparison of performance between 2023 and 2025 does not indicate any substantial variations. The proportion of laboratories achieving acceptable evaluations is approximately 90% (91% and 88.4%, respectively). The total number of evaluations increased from 5,141 in 2023 to 11,187 in 2025.
he indicator describes the percentage of analytical performances considered acceptable (currently limited to the air matrix), relative to the total number of performances carried out by the laboratories of the Regional and Provincial Environmental Protection Agencies (ARPA/APPA) and ISPRA. The assessment of performance quality is conducted through laboratories’ participation in interlaboratory comparisons, which represent a key instrument to ensure the comparability and reliability of analytical data used in environmental monitoring and control activities.
All Agency laboratories and ISPRA performed the measurements using the methods, measuring instruments, QA/QC (Quality Assurance/Quality Control) procedures, and uncertainty evaluation approaches routinely applied in their air quality monitoring activities. These interlaboratory comparisons are carried out under field conditions, and laboratory performance is assessed over the entire measurement process, including sampling.
Measurement results are transmitted to the organiser of the performance evaluation exercises (ISPRA) within predefined timeframes for subsequent statistical processing, in accordance with international standards. Each participating laboratory is assigned a performance score (z-score, z′-score), which is used to identify any corrective or improvement actions required.
The indicator is constructed by aggregating all interlaboratory comparison results for each year. Two performance assessment categories are considered: acceptable (z-score, z′-score < |2|) and non-acceptable/questionable (z-score, z′-score ≥ |2|).
To assess temporal trends in the overall quality of the performance of laboratories participating in performance evaluation exercises. Disaggregation of performance assessments by parameters of interest and/or matrices allows the identification of strengths of the laboratory system at the national level, while at the same time highlighting areas with potential for improvement.
-
and calibration laboratories;
-
UNI CEI EN ISO/IEC 17043:2023 – General requirements for proficiency testing;
-
UNI ISO 13528:2022 – Statistical methods for use in proficiency testing by interlaboratory comparison;
-
Legislative Decree No. 155/2010 – Implementation of Directive 2008/50/EC on ambient air quality and cleaner air for Europe;
-
Legislative Decree No. 250 of 24 December 2012 – Amendments and supplements to Legislative Decree No. 155 of 13 August 2010 implementing Directive 2008/50/EC on ambient air quality and cleaner air for Europe;
-
Ministerial Decree of 26 January 2017 – Implementation of Directive (EU) 2015/1480 of 28 August 2015 amending certain Annexes to Directives 2004/107/EC and 2008/50/EC as regards reference methods, data validation and the location of sampling points for the assessment of ambient air quality;
-
Ministerial Decree of 30 March 2017 – Quality assurance procedures for verifying compliance with ambient air measurement quality requirements at monitoring stations within measurement networks;
-
Ministerial Decree of 4 February 2022 – Designation of the National Reference Laboratory for air quality;
-
Directive 2008/50/EC of the European Parliament and of the Council of 21 May 2008 – on ambient air quality and cleaner air for Europe.
Panel 2
ISPRA Serie Manuali e Linee Guida n. 108/2014 “Linee guida per le attività di assicurazione/controllo qualità (QA/QC) per le reti di monitoraggio per la qualità dell'aria ambiente, ai sensi del D, Lgs, 155/2010 come modificato dal D, Lgs, N,250/2012”,
ISPRA, Serie Manuali e Linee Guida n. 19/2018 “Procedure operative per l’applicazione e l’esecuzione dei controlli di QA/QC per le reti di monitoraggio della qualità dell’aria”
ISPRA, Serie Manuali e Linee Guida n. 37/2021 “Procedure operative per l’applicazione e l’esecuzione dei controlli di QA/QC per le reti di monitoraggio della qualità dell’aria – Volume 2”,
ISPRA - PROVA VALUTATIVA INTERLABORATORIO ISPRA-IC060 “Misure delle concentrazioni in massa delle frazioni PM10 e PM2,5 di materiale particolato nell’aria ambiente” Rapporto Conclusivo-2023
ISPRA - PROVA VALUTATIVA INTERLABORATORIO ISPRA-IC069 “Misure delle concentrazioni in massa delle frazioni PM10 e PM2,5 di materiale particolato nell’aria ambiente” Rapporto Conclusivo – 2025
ISPRA - PROVA VALUTATIVA INTERLABORATORIO ISPRA-IC070 “Misure della concentrazione dei metalli e degli IPA nel PM10” Rapporto Conclusivo - 2025
ISPRA - PROVA VALUTATIVA INTERLABORATORIO ISPRA-IC071 “Misure in campo delle concentrazioni di monossido di azoto, biossido di azoto, ozono e benzene nell’aria ambiente” Rapporto Conclusivo - 2025
Data quality assessment
ISPRA – Italian Institute for Environmental Protection and Research
The indicator data is collected, processed and archived by ISPRA, accessible to the public through the final reports of each circuit.
National
2023; 2025
Indicator assessment
For each reference year, the percentage of acceptable values relative to the total number of performance evaluations was calculated for each parameter of interest.
The assessment of the acceptability of each participant’s data is performed based on z-scores or z′-scores, calculated according to Equations 1 and 2, respectively. The choice between z-score and z′-score depends on compliance with the criterion
uX<0.3 described in ISO 13528:2022 (paragraph 9.2). When the criterion is satisfied, acceptability is evaluated using the z-score; otherwise, the z′-score is used.
z-score
z=σ^pxi−X(Equation 1)
where:
-
xi = mean value reported by the participant for the measurand;
-
X = reference value of the measurand;
-
σ^p = assigned (target) standard deviation.
The target standard deviation for each proficiency test is calculated in accordance with the relevant reference standards.
z′-score
z′=σ^p2+uX2
xi−X(Equation 2)
where:
-
xi = mean value reported by the participant for the measurand;
-
X = reference value of the measurand;
-
σ^p = assigned (target) standard deviation;
-
uX = uncertainty of the reference value.
The target standard deviation is calculated in accordance with the relevant standards or based on comparable studies adopted by the European Commission for the intended purpose.
Although no formal standard target has been defined, achieving acceptable values of 91% in 2023 and 88.4% in 2025 represents a positive indicator of the analytical capabilities of laboratories engaged in environmental monitoring and control activities across the national territory (Table 3 and Figure 3).
In the two reference years, despite the increase in the number of measurements from 5,141 (2023) to 11,187 (2025), no significant variation is observed in the percentage of acceptable performances, which decreased slightly from 91% in 2023 to 88.4% in 2025, indicating an overall stable trend (Tables 1, 2, and 3; Figure 3).
Data
Table 1: Counts of Acceptable and Non-Acceptable Laboratory Performances in Air Quality Monitoring (2023)
ISPRA
Table 2: Number of Acceptable and Non-Acceptable Performances for Air Quality (2025)
ISPRA
Table 3: Trend of Performance Assessments by Measurement Classes in Air Quality
ISPRA
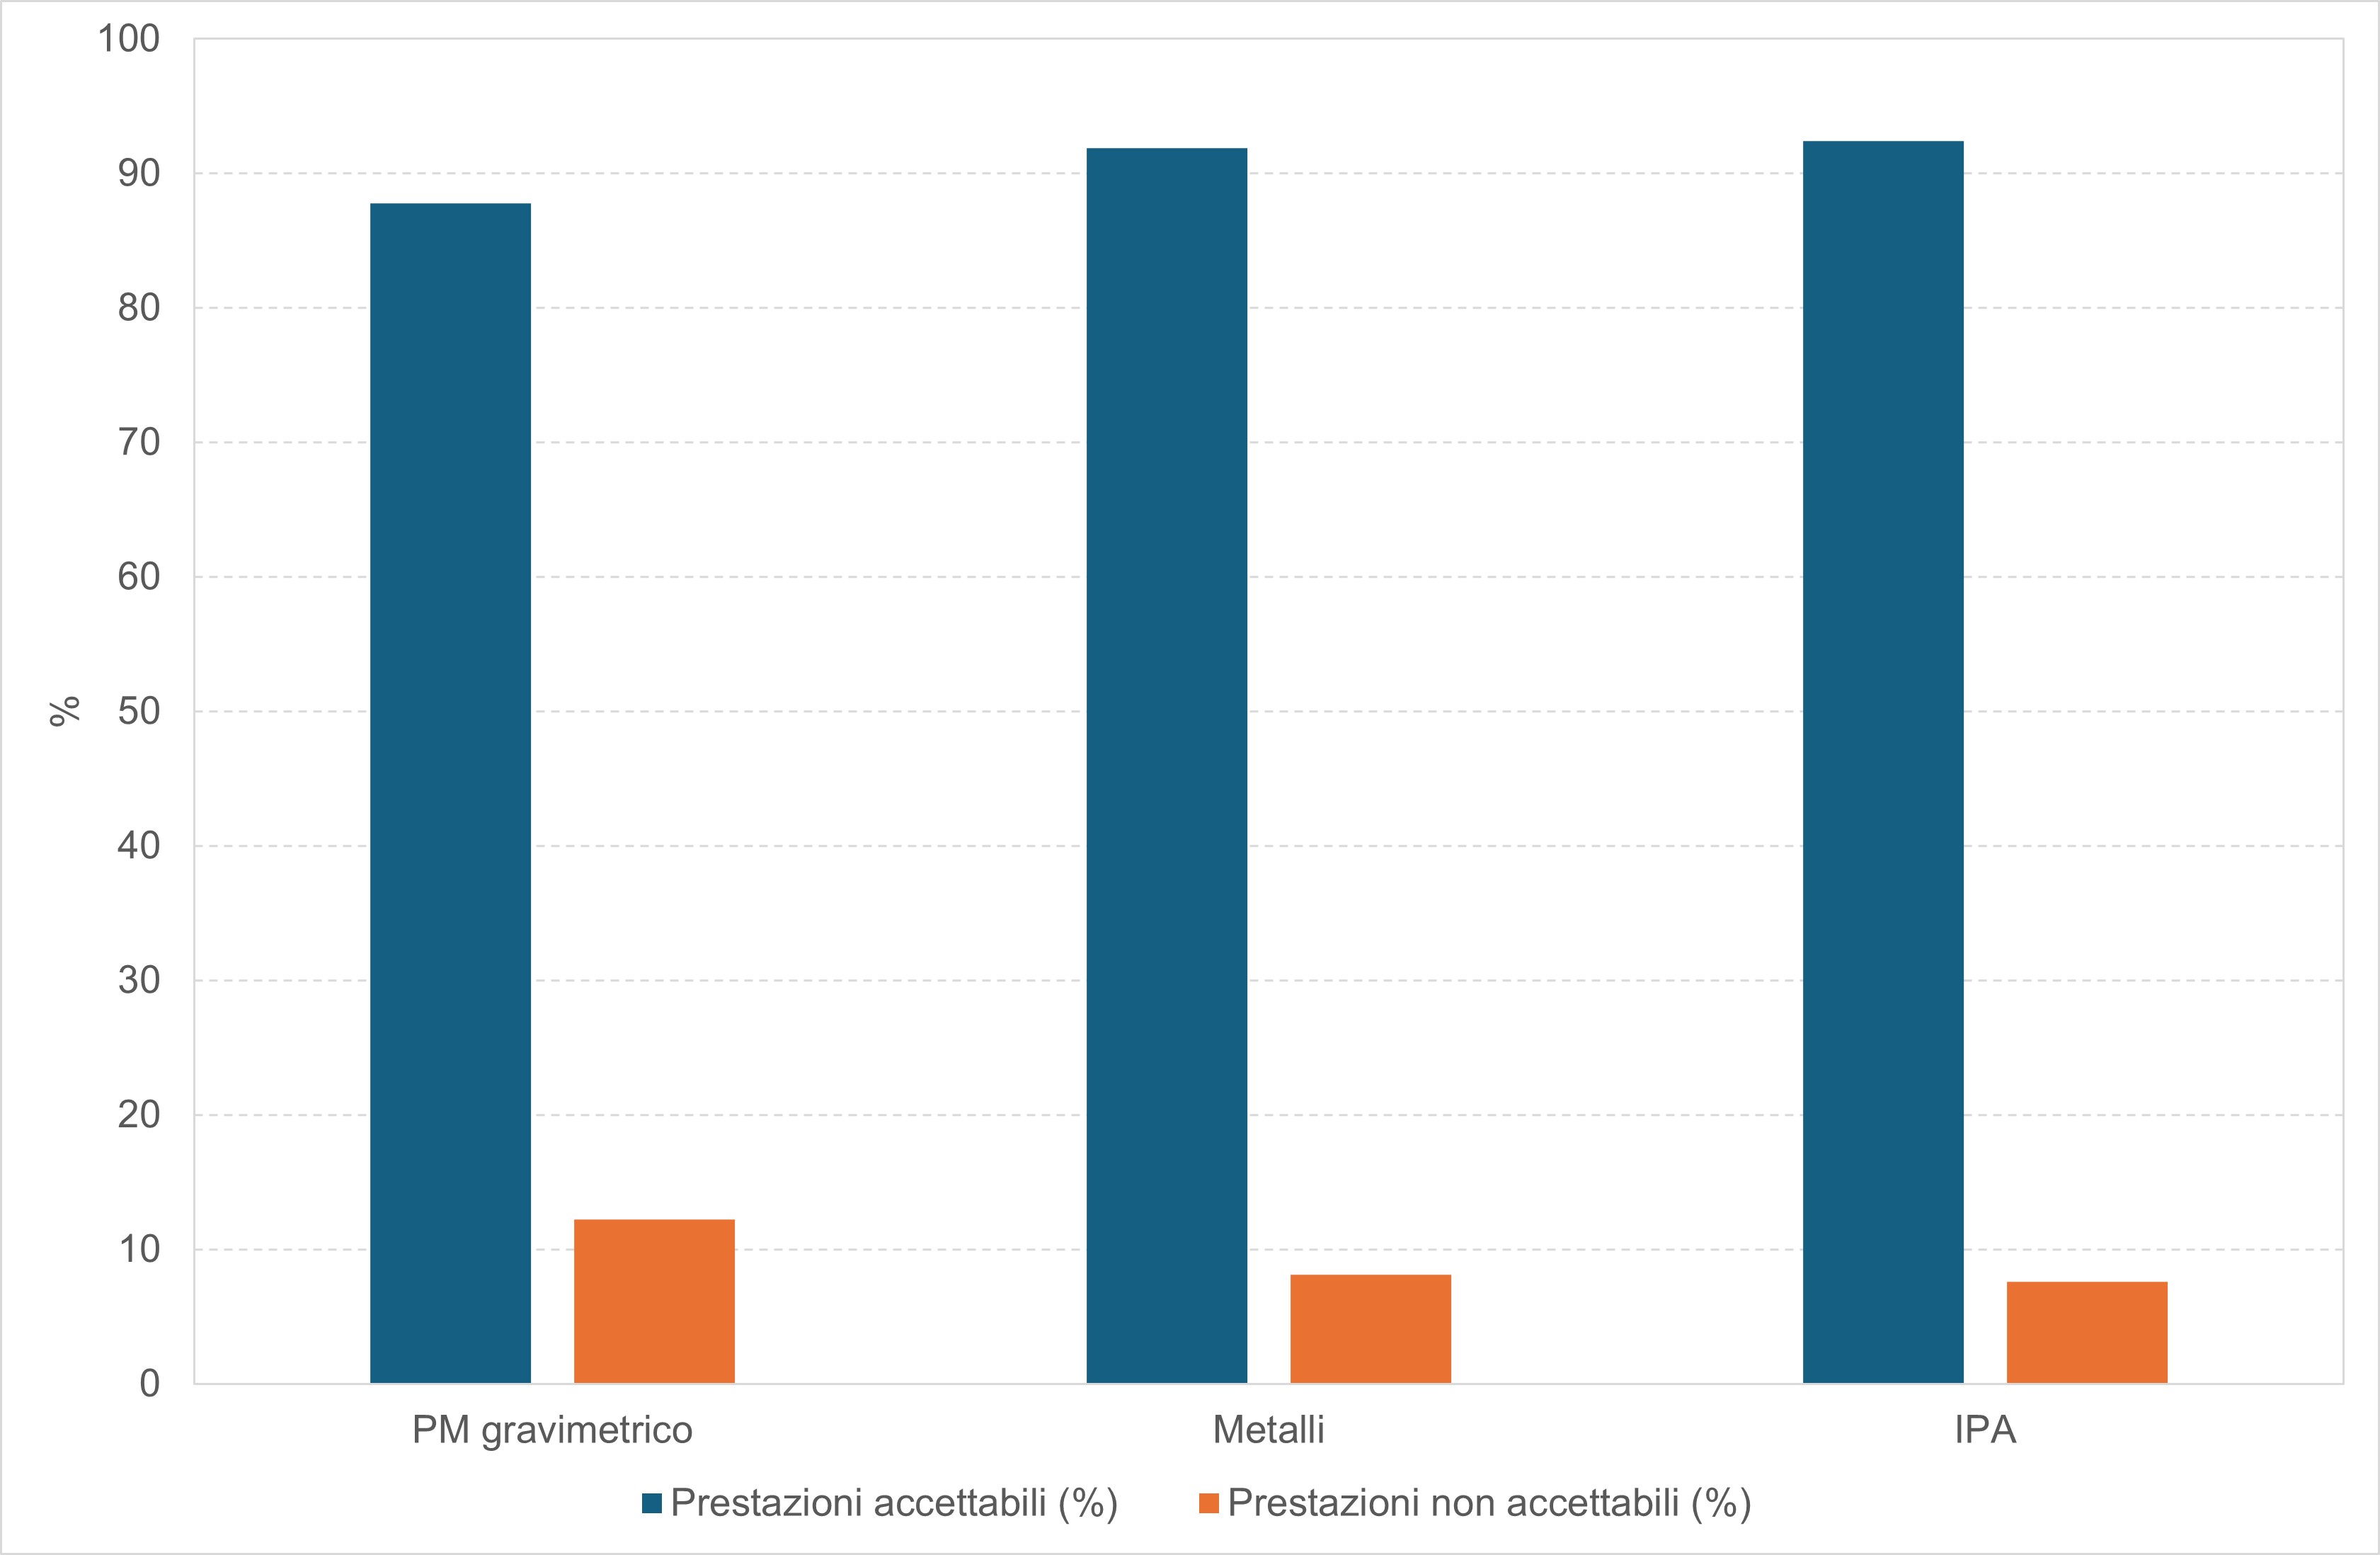
Figure 1: Laboratory Performance Evaluation by Air Quality Measurement Categories (2023)
ISPRA
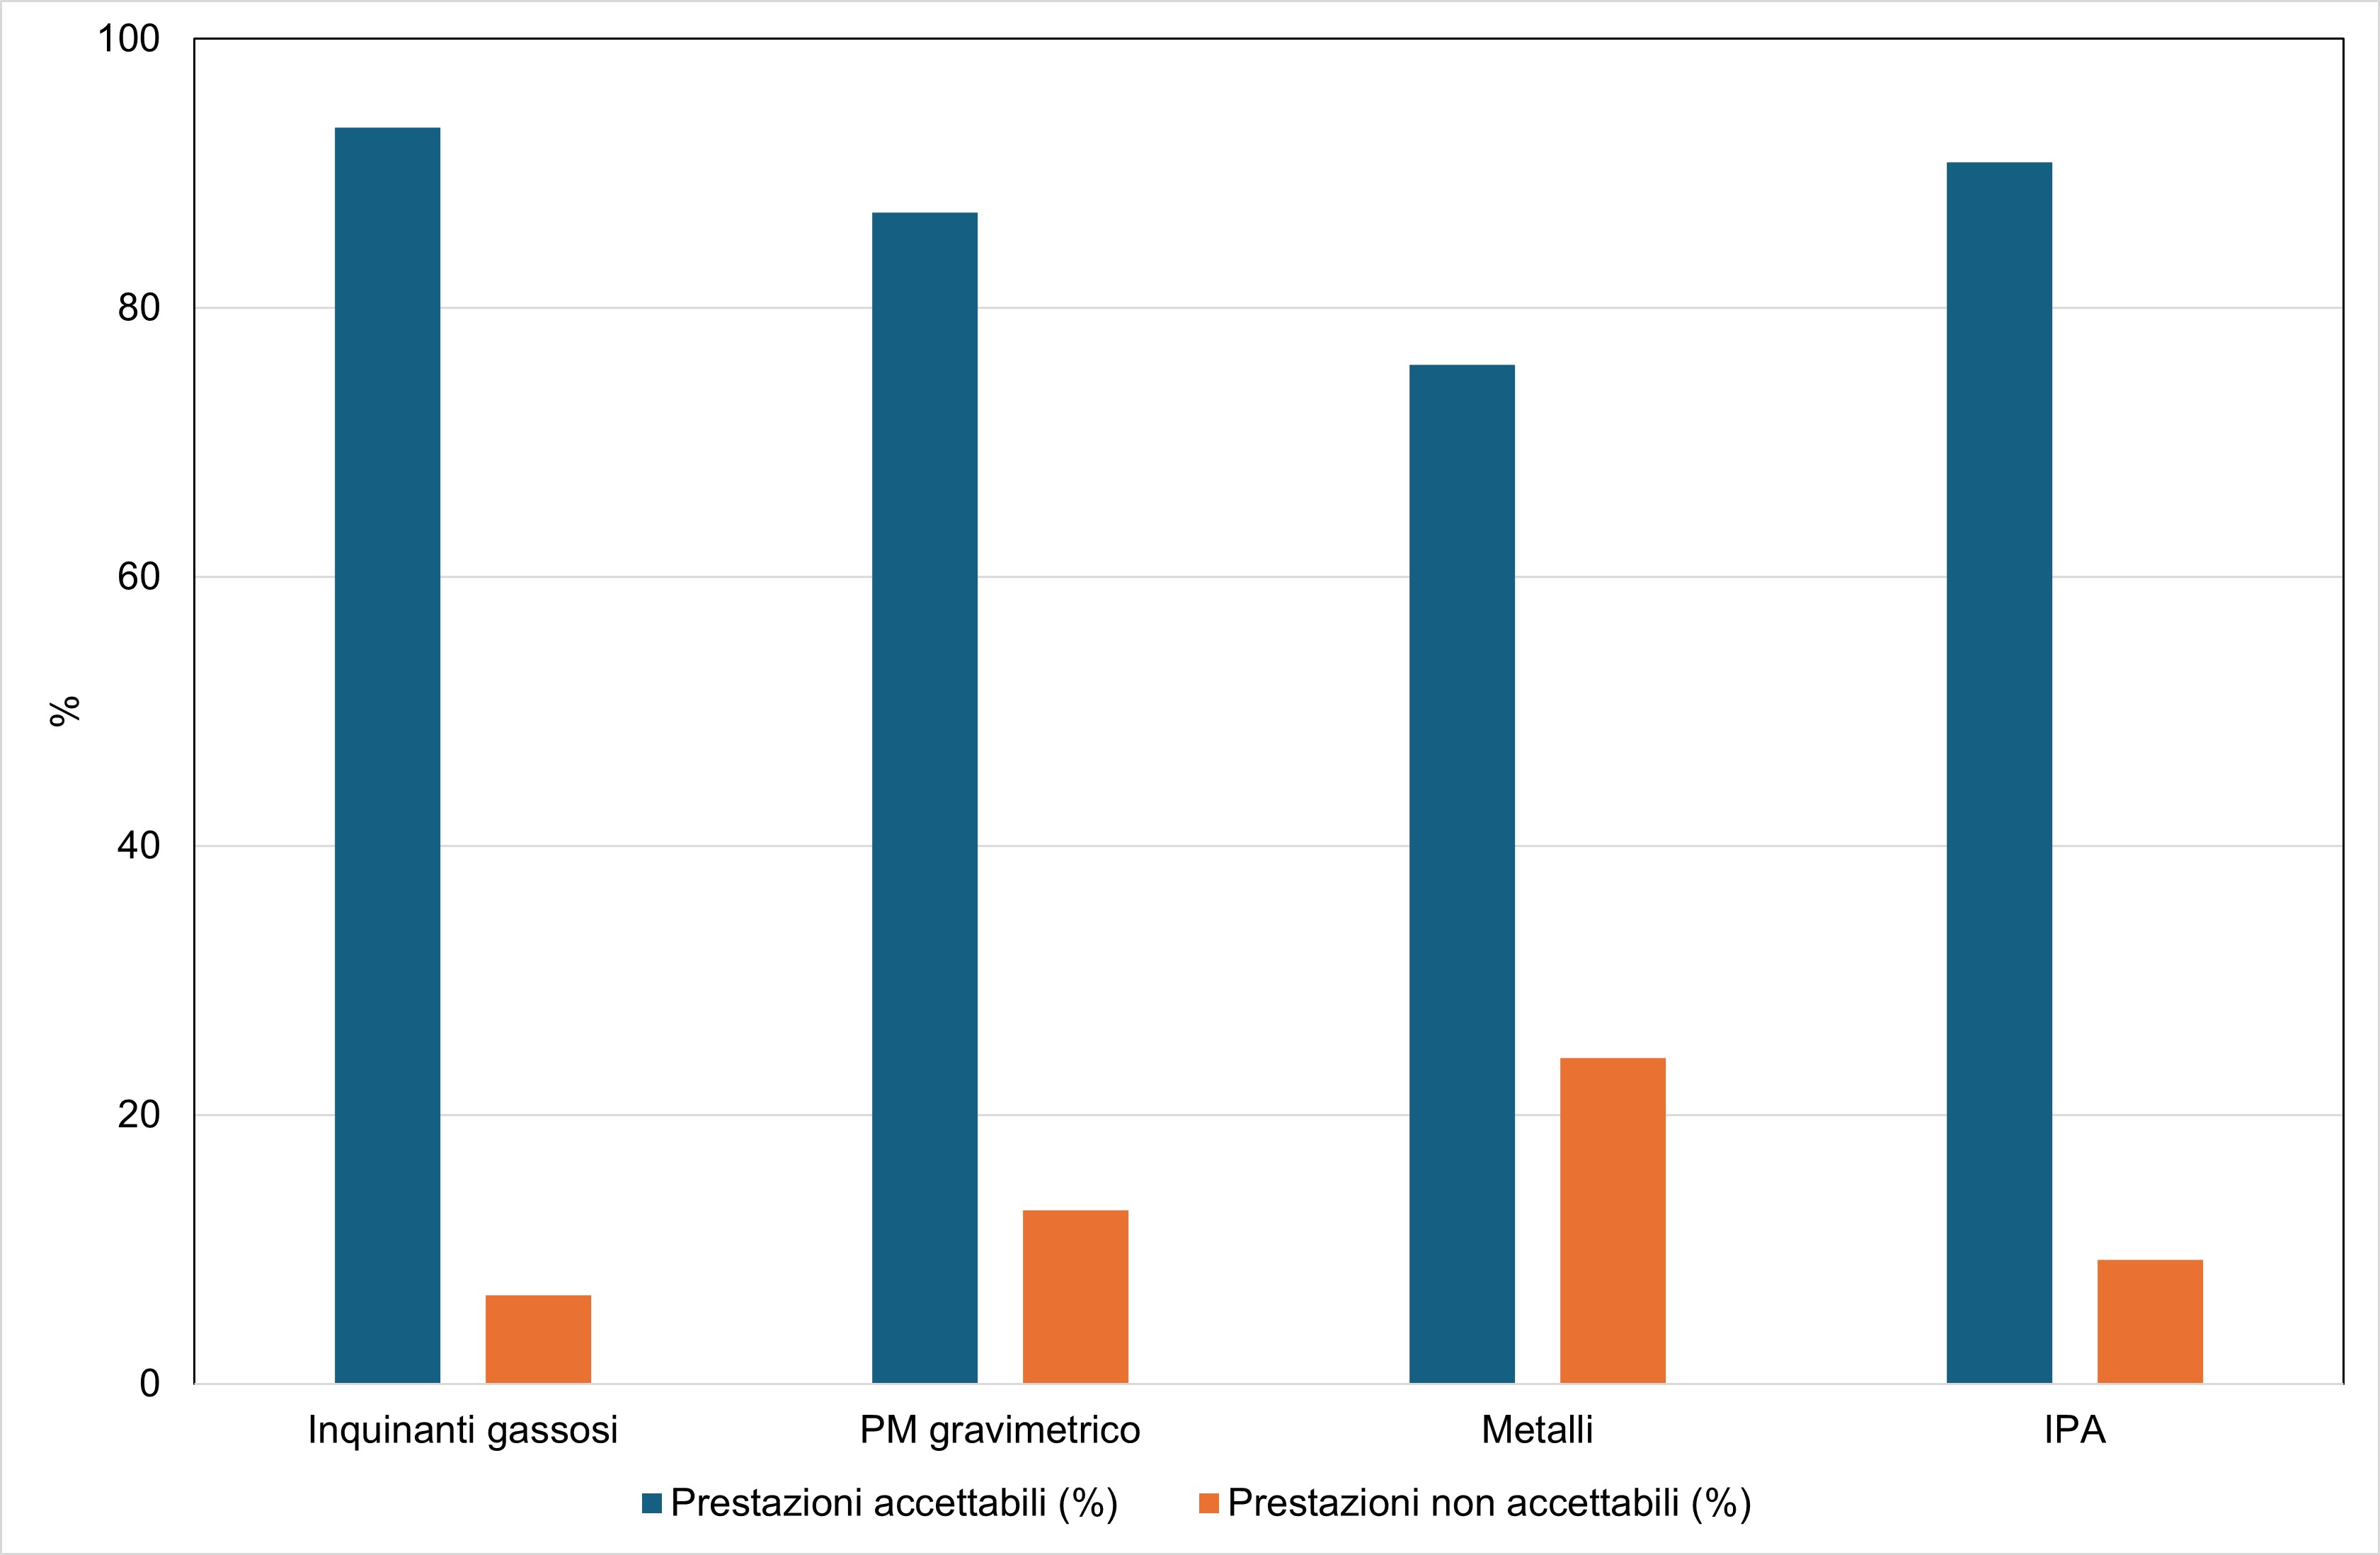
Figura 2: Valutazione delle prestazioni per classi di misure sulla qualità dell'aria (2025)
ISPRA
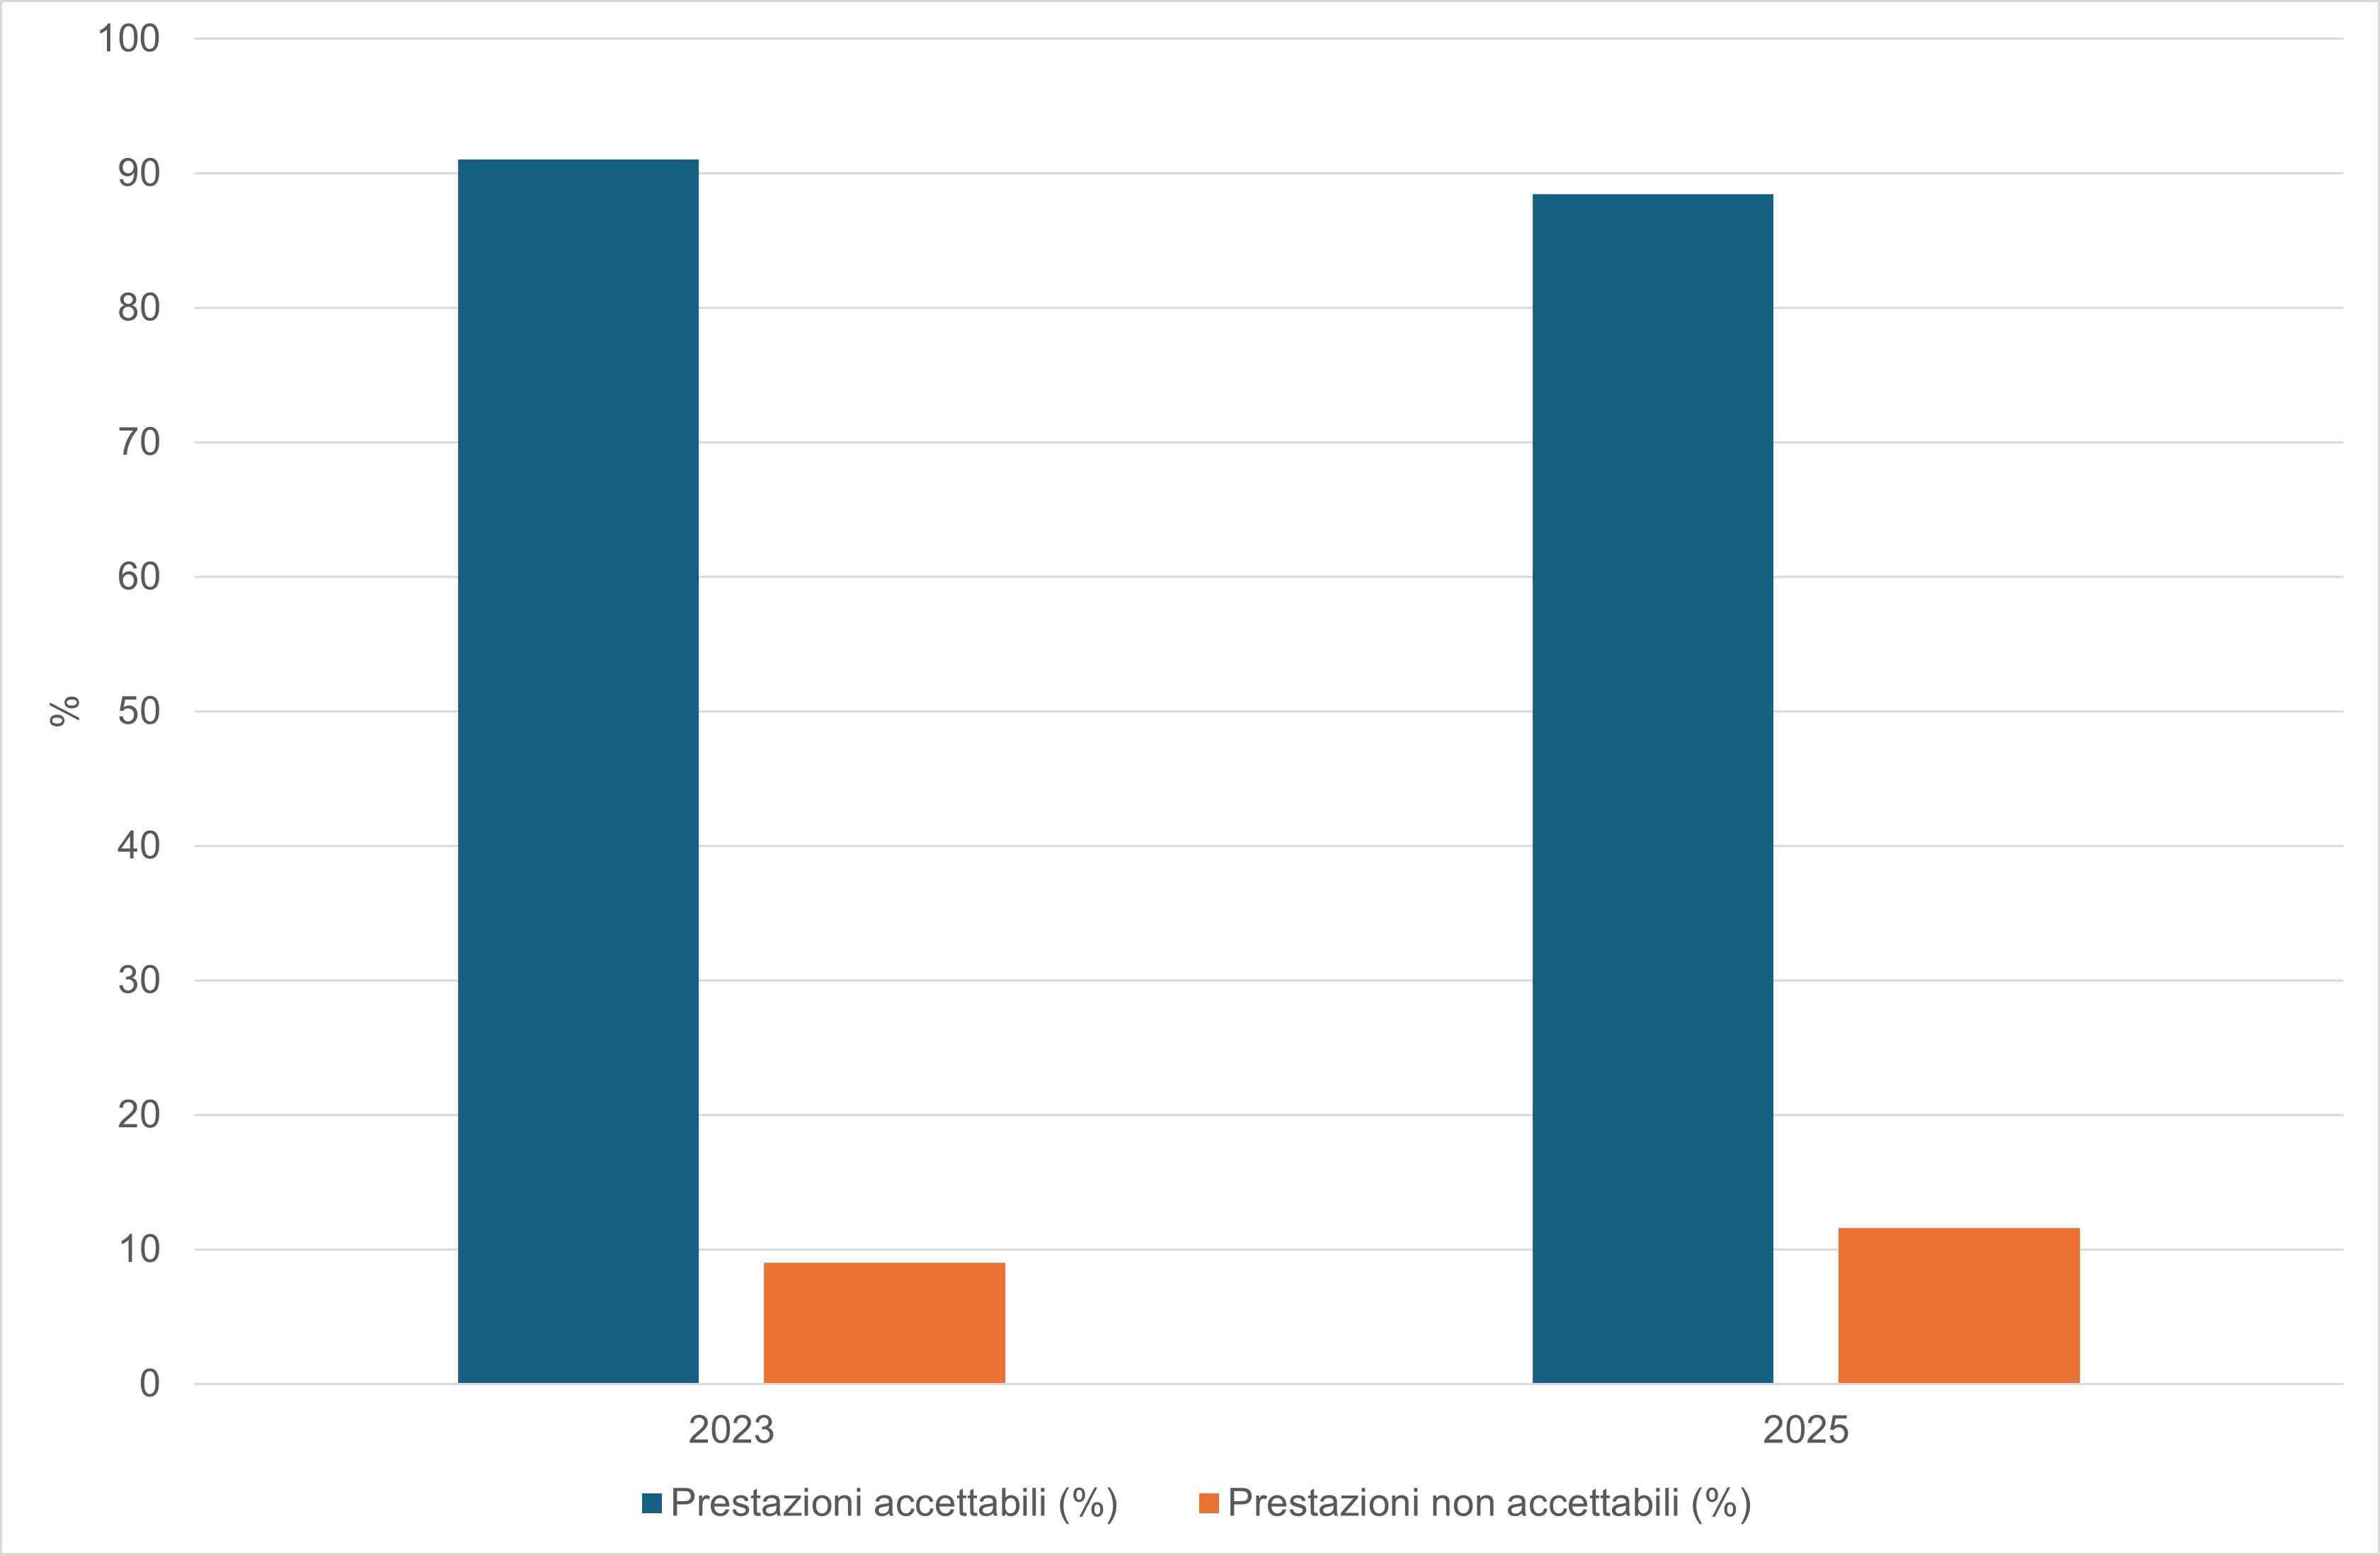
Figure 3: Laboratory Performance Trends by Air Quality Measurement Categories
ISPRA
In 2023, considering the categories of atmospheric particulate matter, heavy metals, and polycyclic aromatic hydrocarbons on filter-deposited particulate, acceptable values ranged from a minimum of 88% to over 92%. Questionable or non-acceptable performances require laboratories to implement structured corrective and/or targeted improvement actions. In this context, the percentage associated with the indicator ranges from 8% to 12% (Table 3; Figure 1).
In 2025, considering the categories of gaseous pollutants, atmospheric particulate matter, heavy metals, and polycyclic aromatic hydrocarbons on filter-deposited particulate, acceptable values ranged from a minimum of 75.8% (metals) to a maximum of 93.4% (gaseous pollutants). Questionable or non-acceptable performances require laboratories to implement structured corrective and/or targeted improvement actions. In this context, the percentage associated with the indicator ranges from 6.6% to 24.2% (Table 3; Figure 2).
The total number of evaluations more than doubled between 2023 and 2025, increasing from 5,141 to 11,187, due to a greater availability of proficiency tests.