Gabriele Bellabarba, Francesca Sacchetti
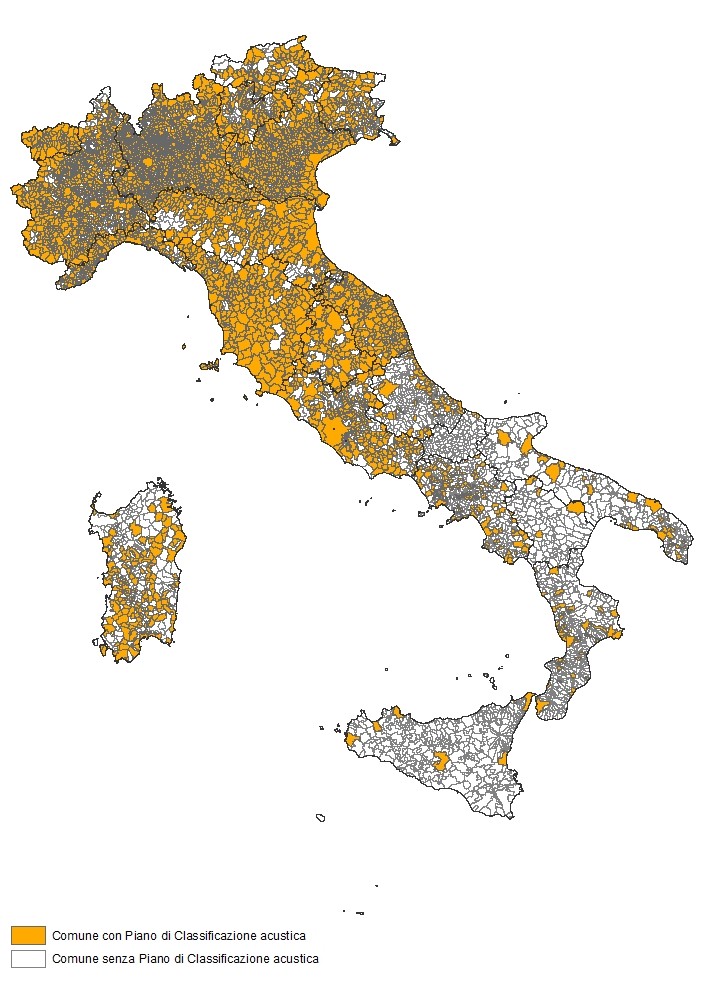
The Noise Classification Plan represents the main municipal planning act for the management of noise pollution. The Plan consists in the division of the municipal territory into acoustically homogeneous areas, to which acoustic limits are associated, with the aim of providing an indispensable tool for planning urban development and protecting the territory from noise pollution.
By 2024, on the national territory, the Acoustic Classification Plan has been approved in 65% of municipalities; the differences in the application of this planning tool are still evident at a regional scale.
The indicator reports, for each autonomous region/province, the number of municipalities that have approved the noise classification plan and the percentage of these compared to the total number of municipalities. The indicator also records, at a national and regional level, the percentage of classified territory out of the total and the percentage of the population residing in municipalities that have approved the Noise Classification Plan compared to the total resident population.
Assess the state of implementation of noise legislation with reference to the activities of municipal administrations regarding prevention and protection from environmental noise.
LQ 447/1995; Prime Ministerial Decree 14/11/1997;
Prime Ministerial Decree 01/03/1991
LQ 447/95 provides for the obligation for municipalities to proceed with the acoustic classification of their territory (art. 6, c.1, letter a)), or to distinguish the municipal territory into six homogeneous classes, defined by the legislation on the basis of the prevalent and effective intended use, and to assign, to each homogeneous zone, acoustic limit values, on two time references, daytime and nighttime (Prime Ministerial Decree 14/11/97 "Determination of limit values for sound sources"). LQ 447/95 assigns the regions the task of defining the criteria with which the municipalities proceed with the acoustic classification (art. 4, c.1, letter a). In the absence of acoustic classification of the municipal territory, the acceptability limits defined in art.6 of the Prime Ministerial Decree of 1 March 1991 (art.15 of LQ 447/95) apply on a transitional basis.
APAT, AAVV 2008, Guidelines relating to the criteria for the acoustic classification of municipal territories
--
--
ARPA/APPA (Regional and Autonomous Province Agencies for Environmental Protection)
ISTAT
The data for the development of the indicator are present in the Osservatorio Rumore database, which can be populated by the ARPA/APPA representatives and can also be consulted by the public on the website https://agentifisici. isprambiente. it/associazionetoriorumore_public/home. php
National, Regional (20/20)
update as of 12/31/2024
The indicator is given by the number of municipalities that have approved the noise classification plan and the ratio between the number of municipalities having the plan and the total number of municipalities.
In 2024, compared to 2023, there will be an increase in 9 municipalities that have approved the acoustic classification plan.
Overall, on the national territory, approximately 65% of the municipalities have approved the acoustic classification plan (Table 1).
Between 2006 and 2024 there was an increase of 33 percentage points in the zoned municipalities, 2,552 in 2006 (31.5%) compared to 5,106 in 2024 (64.7%) (Table 2).
| Data |
|---|
Thumbnail
Titolo
Figure 1: Municipal acoustic classification plans (update as of 31/12/2024) Fonte
Processing by ISPRA based on ARPA/APPA and ISTAT data |
Thumbnail
Titolo
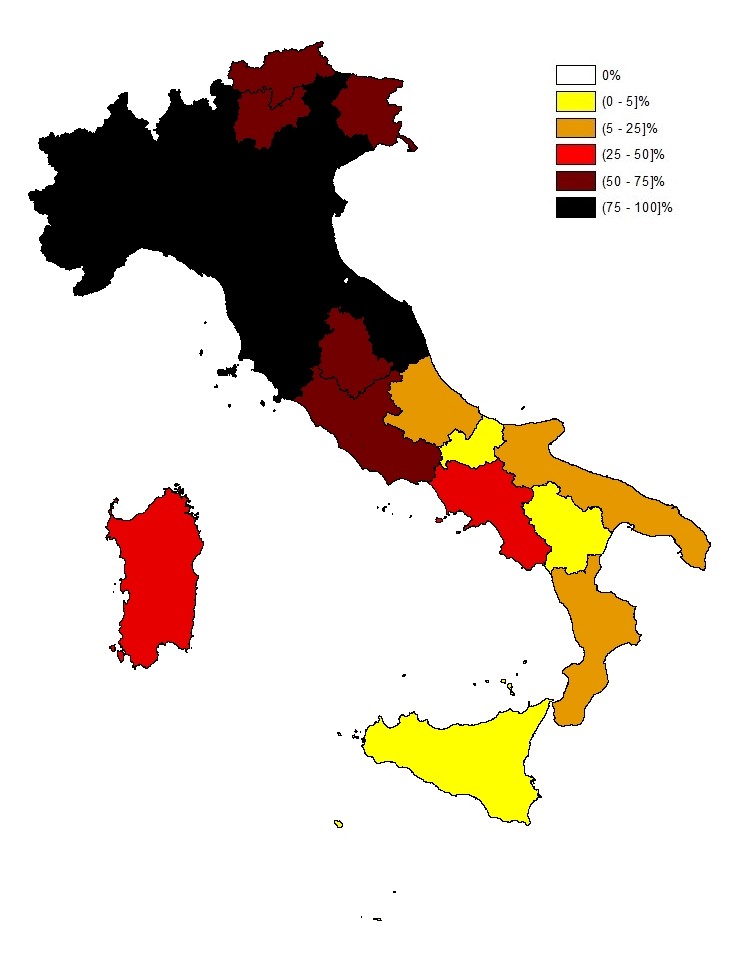
Figure 2: Percentage of municipalities that have approved the acoustic classification plan out of the total number of municipalities in each Region/Autonomous Province (update as of 31/12/2024) Fonte
Processing by ISPRA based on ARPA/APPA and ISTAT data |
Thumbnail
Titolo
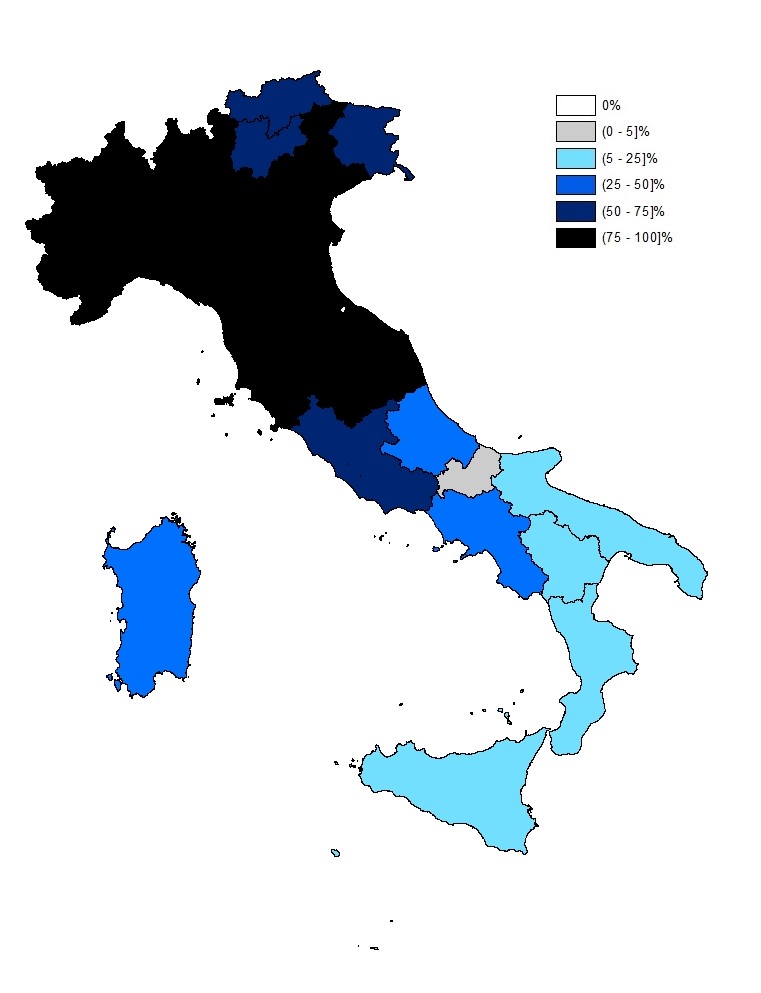
Figure 3: Percentage of resident population living in municipalities that have approved the acoustic classification plan relative to the total resident population of each Region/Autonomous Province (update as of 31/12/2024) Fonte
Processing by ISPRA based on ARPA/APPA and ISTAT data |
Thumbnail
Titolo
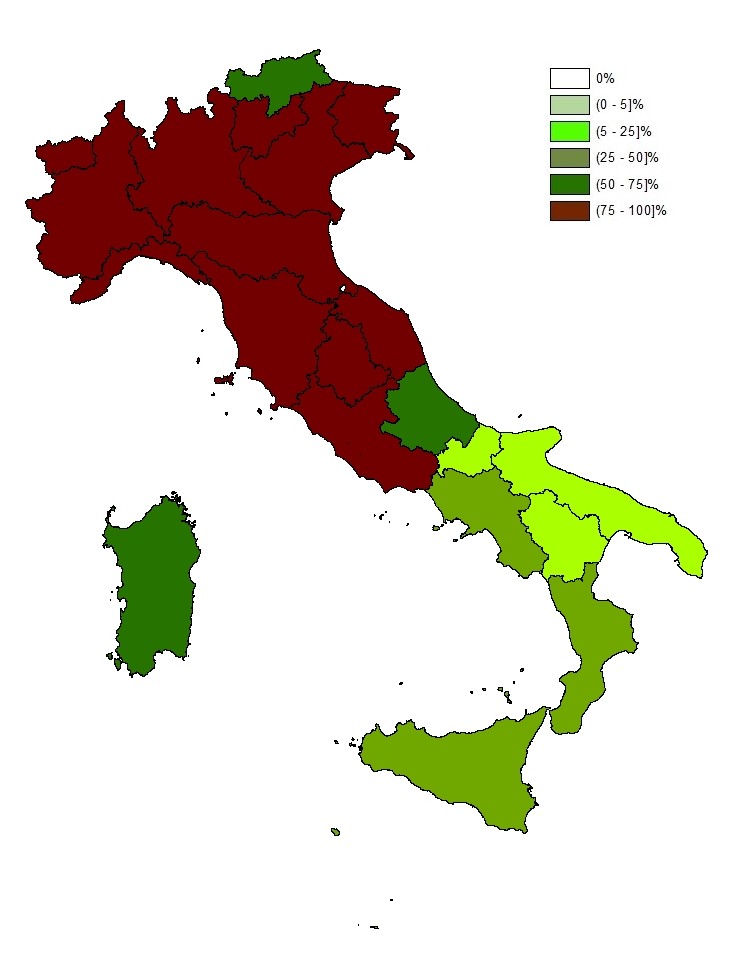
Figure 4: Percentage of territorial area of municipalities that have approved the acoustic classification plan relative to the total area of each Region/Autonomous Province (update as of 31/12/2024) Fonte
Processing by ISPRA based on ARPA/APPA and ISTAT data |
Headline
Table 1: Municipalities that have approved acoustic classification, by Region/Autonomous Province Data source
Processing by ISPRA based on ARPA/APPA and ISTAT data |
Headline
Table 2: Municipalities that have approved the acoustic classification Data source
Processing by ISPRA based on ARPA/APPA and ISTAT data |
As of 2024, at a national level, the municipalities that have approved the Noise Classification Plan are 5,106, equal to 64.7% of Italian municipalities, a figure almost unchanged compared to that found in 2023 (64.5%) (Table 2); similarly, small variations are recorded for the percentage of population residing in municipalities with approved acoustic classification, equal to 73.8% of the total population compared to 73.3% in 2023, and for the percentage of zoned surface area, equal to 58.5% of the entire national surface compared to 58.1% in 2023. (Table 1).
There are still notable differences between the different regional realities (Figures 2-4). The regions with the highest percentages of zoned municipalities (Table 1) are: Valle d'Aosta (100%), Marche (97%), Lombardy and Tuscany (96%), Veneto (94%), Liguria (85%), Piedmont (82%), Emilia-Romagna (78%); while those with values lower than 20% are: Abruzzo (17%), Calabria (14%), Puglia (13%), Basilicata (3%), Sicily (2%) and Molise (1%).