Cristina Frizza
In 2022, total expenditure by the Italian economy on environmental protection amounted to €51.4 billion, corresponding to 2.6% of Gross Domestic Product (GDP). This latter value remained broadly stable over the period 2016–2022, indicating continuity in investments devoted to environmental protection. Resources are mainly allocated to waste management and wastewater management, which represent the two most significant expenditure items (46% and 25%, respectively).
Alongside these, with a smaller but still significant share, are expenditures for the protection and remediation of soil, groundwater and surface waters, the protection of biodiversity and landscapes, air and climate protection, as well as noise and vibration abatement activities (excluding workplaces). The picture is completed by expenditure on environmental research and development and other supporting activities, which contribute to the diffusion of innovative and sustainable solutions.
The indicator quantifies, for the economy as a whole and/or for the different operators belonging to it, the amount of national resources (net of funding received from the rest of the world) spent on environmental protection by resident operators, regardless of the origin of the resources themselves. Each resident operator may finance expenditure using its own resources and/or resources received from other resident operators (for example, through transfers).
National expenditure on environmental protection is calculated gross of depreciation. It represents the main indicator derived from the environmental protection expenditure accounts and is defined as the sum of: final consumption of environmental protection services by resident units; intermediate consumption of environmental protection services by resident units, excluding specialised producers; gross fixed capital formation and acquisitions less disposals of non-produced non-financial assets for environmental protection activities; transfers for environmental protection that are not the counterpart of the previous aggregates, minus funding from the rest of the world.
To identify and measure the responses of the economy to environmental problems through the supply and demand of environmental protection services. Indicators from the environmental protection expenditure accounts, eco-industry accounts and environmental tax revenue make explicit those environmentally relevant economic transactions that are not highlighted by the core national accounts.
Commission Delegated Regulation (EU) No 125/2022, amending Regulation (EU) No 691/2011 on European environmental economic accounts.
Environmental protection expenditure accounts Handbook — 2017 edition. Eurostat, Luxembourg (https://ec. europa. eu/eurostat/web/products-manuals-and-guidelines/-/KS-GQ-17-004) - System of Environmental-Economic Accounting 2012 - Central Framework. United Nations, New York, 2014 (https://seea. un. org/content/seea-central-framework)
Istat
Istat database - https://esploradati. istat. it/databrowser/#/it/dw/categories--> National accounts --> Environmental accounts --> Expenditures for environmental protection
National
2016-2022
The methodology used to compile the indicator is described in Environmental protection expenditure accounts — Handbook 2017 edition, Eurostat, Luxembourg.
In line with national economic accounting, the environmental protection expenditure account provides data on economic resources devoted to environmental protection by resident units. The following variables are considered: production of environmental protection services (distinguished between market production, non-market production and ancillary activities); intermediate consumption of environmental protection services; intermediate consumption of environmental protection services for the production of environmental protection services; imports and exports of environmental protection services; value added tax (VAT) and other taxes less subsidies on products levied on environmental protection services; gross fixed capital formation and acquisitions less disposals of non-produced non-financial assets for the production of environmental protection services; final consumption of environmental protection services; transfers for environmental protection (received/paid).
These variables are disaggregated by type of producer/consumer of environmental protection services: general government (including non-profit institutions serving households) and corporations as institutional sectors producing environmental protection services; households, general government and corporations as consumers of environmental protection services; rest of the world as beneficiary or source of transfers for environmental protection; and by classes, or groups of classes, of the Classification of Environmental Protection Activities (CEPA), which includes: air and climate protection; wastewater management; waste management; protection and remediation of soil, groundwater and surface waters; noise and vibration abatement; protection of biodiversity and landscapes; radiation protection; environmental research and development; other environmental protection activities.
In 2022, environmental protection expenditure by the Italian economy amounted to €51.4 billion, corresponding to 2.6% of GDP (Table 1), broadly in line with the European average (2.1%).
Over the period 2016–2022, environmental protection expenditure by the Italian economy increased by only 0.3 percentage points relative to GDP, outlining an overall nearly stable trend during the period considered (Table 1).
| Data |
|---|
Headline
Table 1: National environmental protection expenditure by institutional sector and CEPA, and share of GDP Data source
ISPRA elaboration on Istat data Note
ISP: private non-profit institutions serving households; CEPA: Classification of Environmental Protection Activities and Expenditure |
Thumbnail
Headline
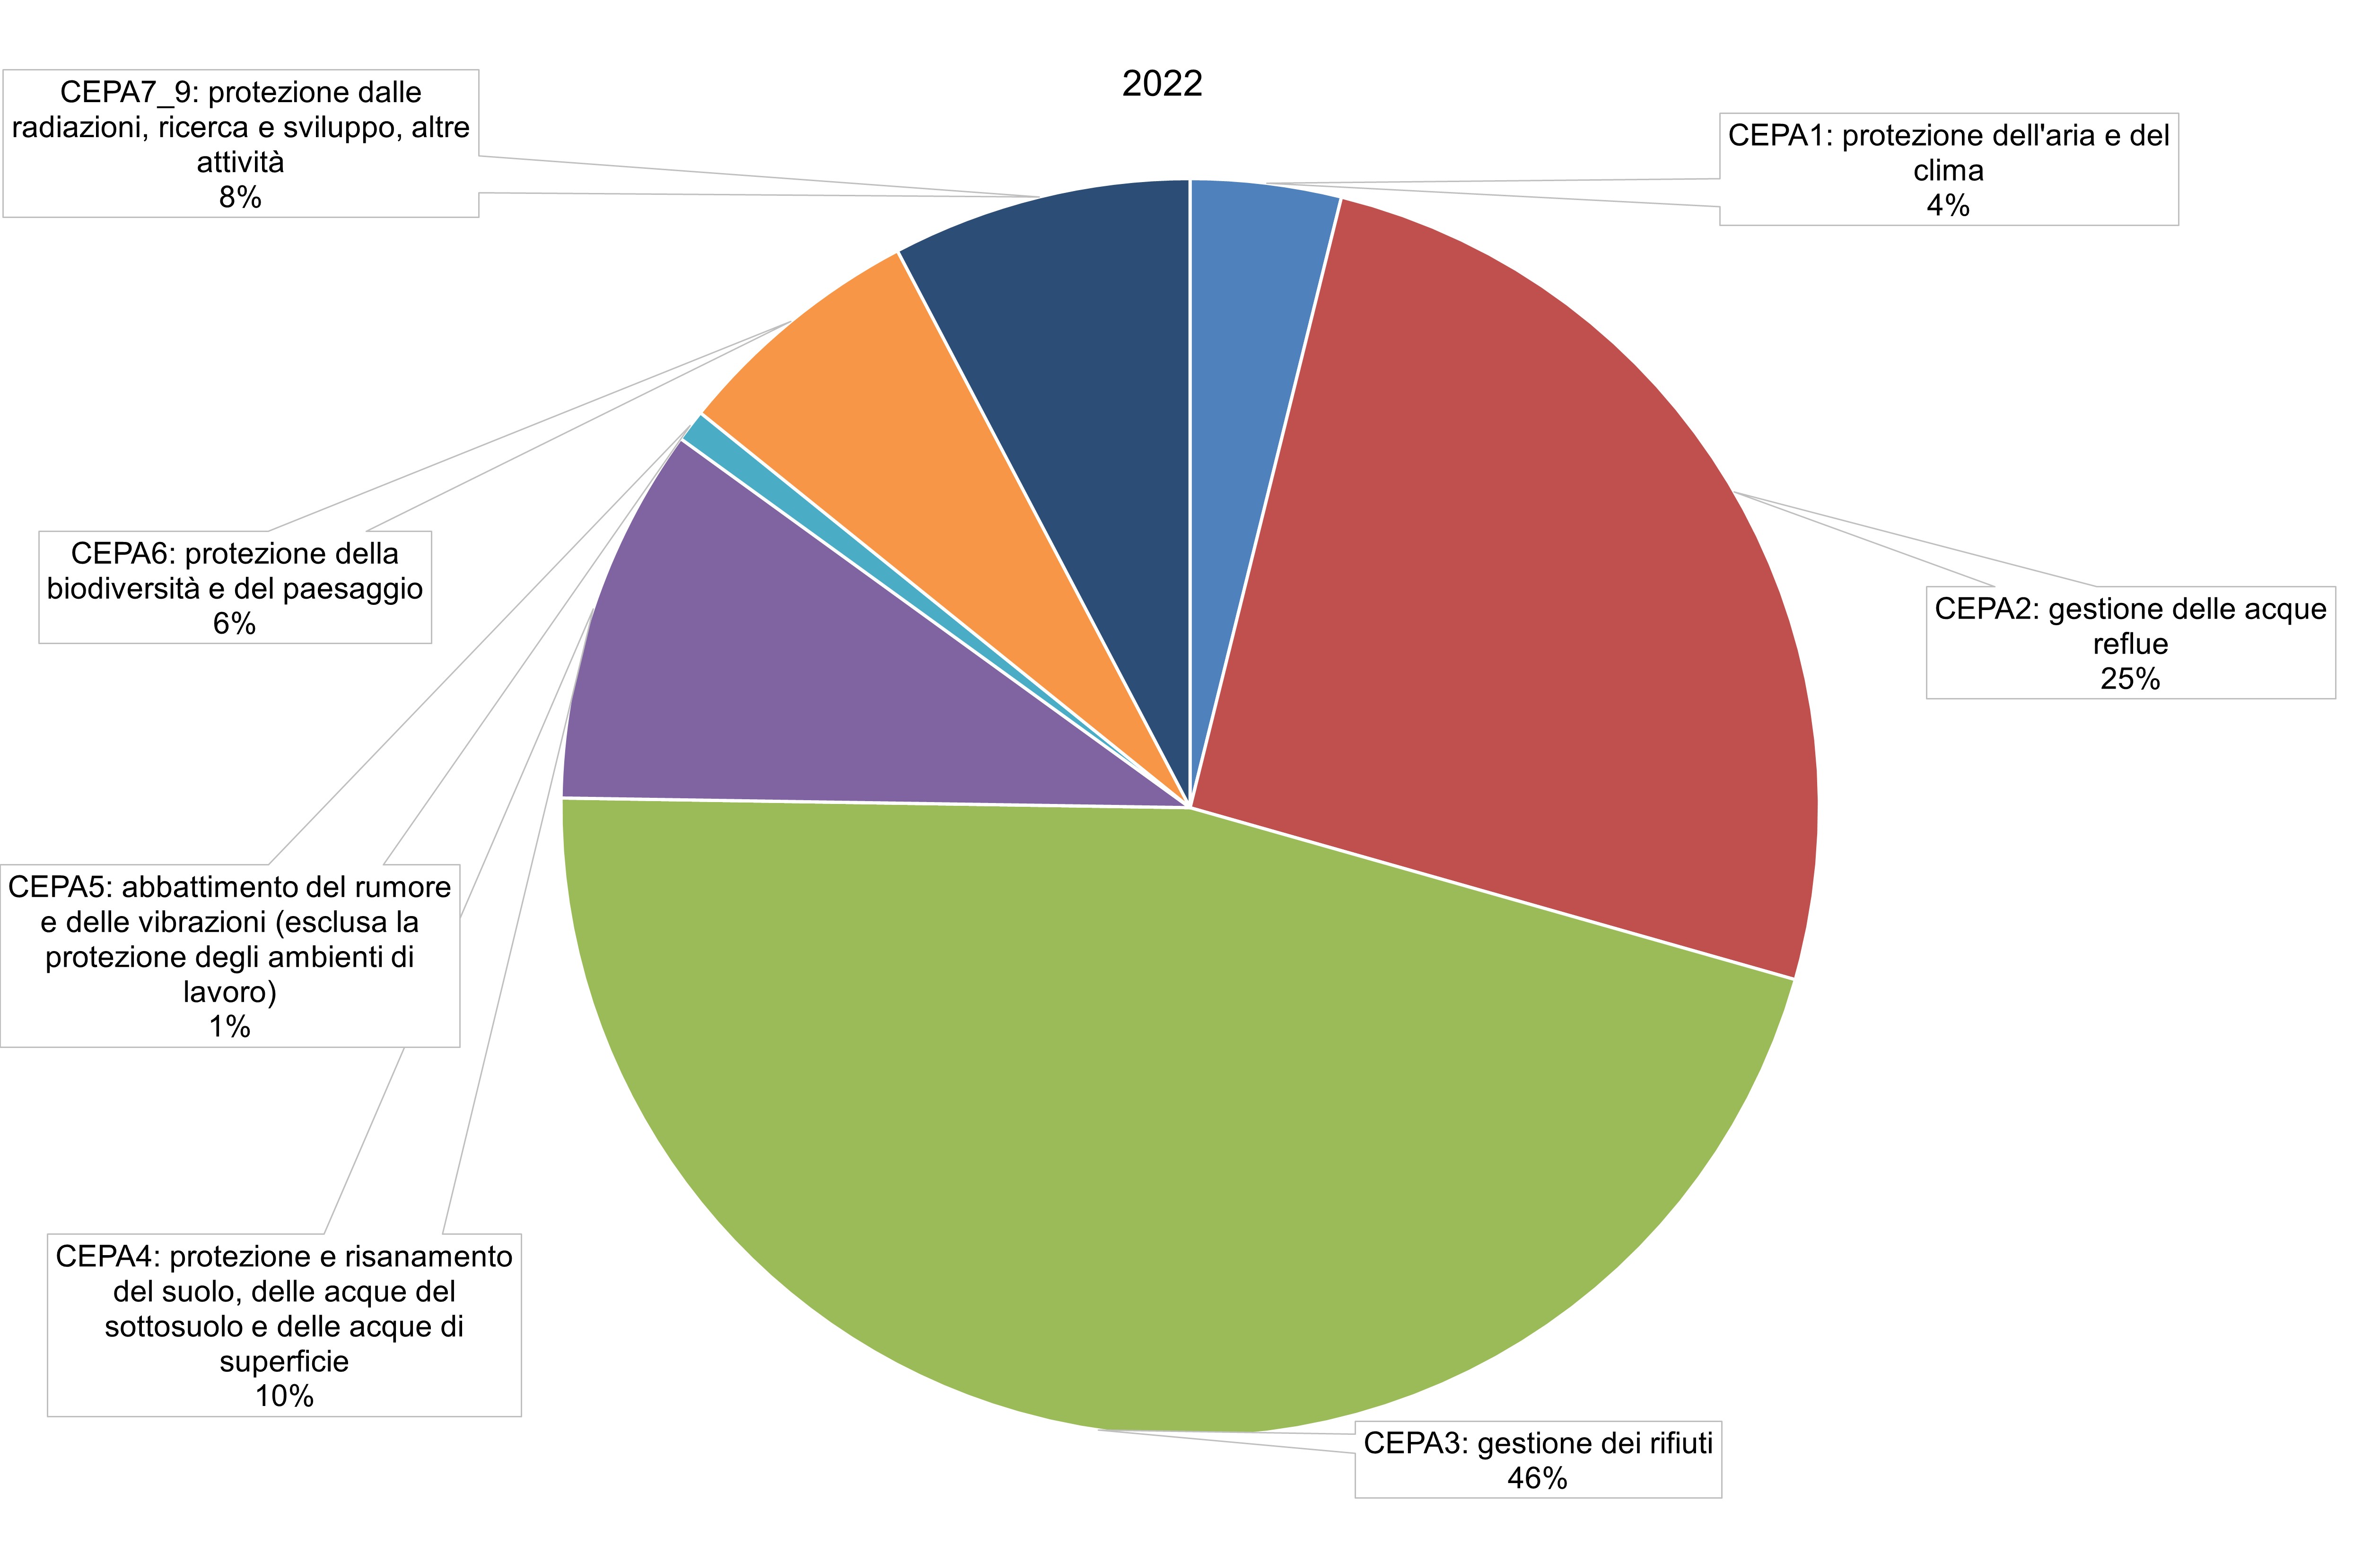
Figure 1: National environmental protection expenditure by institutional sector and environmental purpose (2022) Data source
ISPRA elaboration on Istat data Data legend
CEPA 1: air and climate protection CEPA 2: wastewater management CEPA 3: waste management CEPA 4: protection and remediation of soil, groundwater and surface waters CEPA 5: noise and vibration abatement (excluding workplace protection) CEPA 6: protection of biodiversity and landscapes CEPA 7–9: radiation protection, research and development, other activities |
In 2022, the largest share of national environmental protection expenditure was allocated to waste management and wastewater management, accounting for 46% and 25% of the total, respectively (Figure 1). These two categories represent the main areas of intervention, highlighting the central role of sustainable resource management and basic environmental services. The remaining expenditure is distributed among other environmental purposes, including soil and water protection and remediation, biodiversity and landscape protection, air and climate protection, noise and vibration reduction, as well as research and development activities and other supporting initiatives. Although less significant in quantitative terms, these areas reflect a growing commitment towards a more integrated and preventive approach to environmental problems (Table 1 and Figure 1). From the perspective of the entities bearing the expenditure, in 2022 corporations accounted for more than half of the total (53%), followed by general government and private non-profit institutions serving households (28%), and households, with a share of 19%. The distribution of expenditure among the different institutional sectors remained largely stable over the period 2016–2022, indicating continuity in the roles and responsibilities of economic actors in environmental protection (Table 1). Overall, the data confirm a steady and widespread commitment to financing environmental protection activities, in line with trends observed at the European level.