Cristina Frizza
The eco-industry indicator measures the economic and employment contribution of production sectors engaged in environmental protection and the sustainable management of natural resources. In recent years, the eco-industry sector has experienced strong growth, highlighting the dynamism of the green economy in Italy. Between 2016 and 2022, employment in the sector increased by 99.5%, while value added grew by 120.9%, with particularly marked expansion in the last two years. In 2022, the value added of environmental activities rose by 40.6%, a pace significantly higher than that of overall GDP (+8.4%). As a result, the share of eco-industries in the national economy increased from 3.1% of GDP in 2021 to 4% in 2022, confirming the growing role of sustainability-oriented production in the country.
Eco-industries include economic activities that produce goods and services with an environmental purpose, namely those aimed at protecting the environment (by reducing pollution and degradation) or managing natural resources in a sustainable way (by preventing their depletion). This environmental purpose is statistically captured by two international classifications: the Classification of Environmental Protection Activities (CEPA), which includes activities aimed at preventing, reducing, and eliminating pollution and other forms of environmental degradation, and the Classification of Resource Management Activities (CReMA), which includes activities related to the protection and conservation of natural resources.
These activities include, for example, the production of energy from renewable sources, waste and wastewater management, soil remediation, biodiversity protection, organic agricultural production, and the manufacture of clean technologies such as electric vehicles.
Indicators derived from the Environmental Goods and Services Sector (EGSS) accounts provide information on employment, value added, production, and exports generated by these sectors. The data come from environmental satellite accounts developed by the European Statistical System, in line with national economic accounts and the international standard System of Environmental-Economic Accounting (SEEA-CF).
In summary, eco-industries measure the contribution of the green economy to growth and employment, highlighting how productive activities can support the sustainable transition and environmental protection.
To measure the economic and employment role of productive activities with an environmental purpose, namely those involved in the production of goods and services aimed at environmental protection and the sustainable management of natural resources, through data on value added and employment.
Directive 2010/31/EU, which from 2021 requires nZEB (nearly Zero Energy Building) standards for all new buildings and major renovations. The term nZEB – nearly Zero-Energy Building – means a building with very high energy performance, in which the very low or nearly zero energy demand should be covered to a very significant extent by energy from renewable sources, including energy produced on-site or nearby.
Regulation (EU) No 691/2011 on European environmental economic accounts, as amended by Regulation (EU) No 538/2014. In the European Union, the Commission presented the Communication “The European Green Deal” at the end of 2019 to reshape European commitments towards a sustainable, resource-efficient, and competitive economy. The goods and services produced by eco-industries are fundamental to achieving these objectives.
Environmental goods and services sector accounts — Handbook 2016 edition. Eurostat, Luxembourg (https://ec. europa. eu/eurostat/web/products-manuals-and-guidelines/-/KS-GQ-16-008)
System of Environmental-Economic Accounting 2012 - Central Framework. United Nations, New York, 2014 (https://seea. un. org/content/seea-central-framework)
Istat: https://esploradati. istat. it/databrowser/#/it/dw/categories ---> Environmental accounts --> Accounts of environmental goods and services
National
2016-2022
The methodology for developing the indicator can be consulted in the document Environmental goods and services sector accounts — Handbook 2016 edition. Eurostat, Luxembourg (https://ec. europa. eu/eurostat/web/products-manuals-and-guidelines/-/KS-GQ-16-008)
In 2022, eco-industries, with approximately 1,154 thousand units of labour, generated nearly €80 billion in value added. The value added of eco-industries accounted for about 4% of Italian GDP in 2022, compared with a European average of 3.3% in the same year (Table 2).
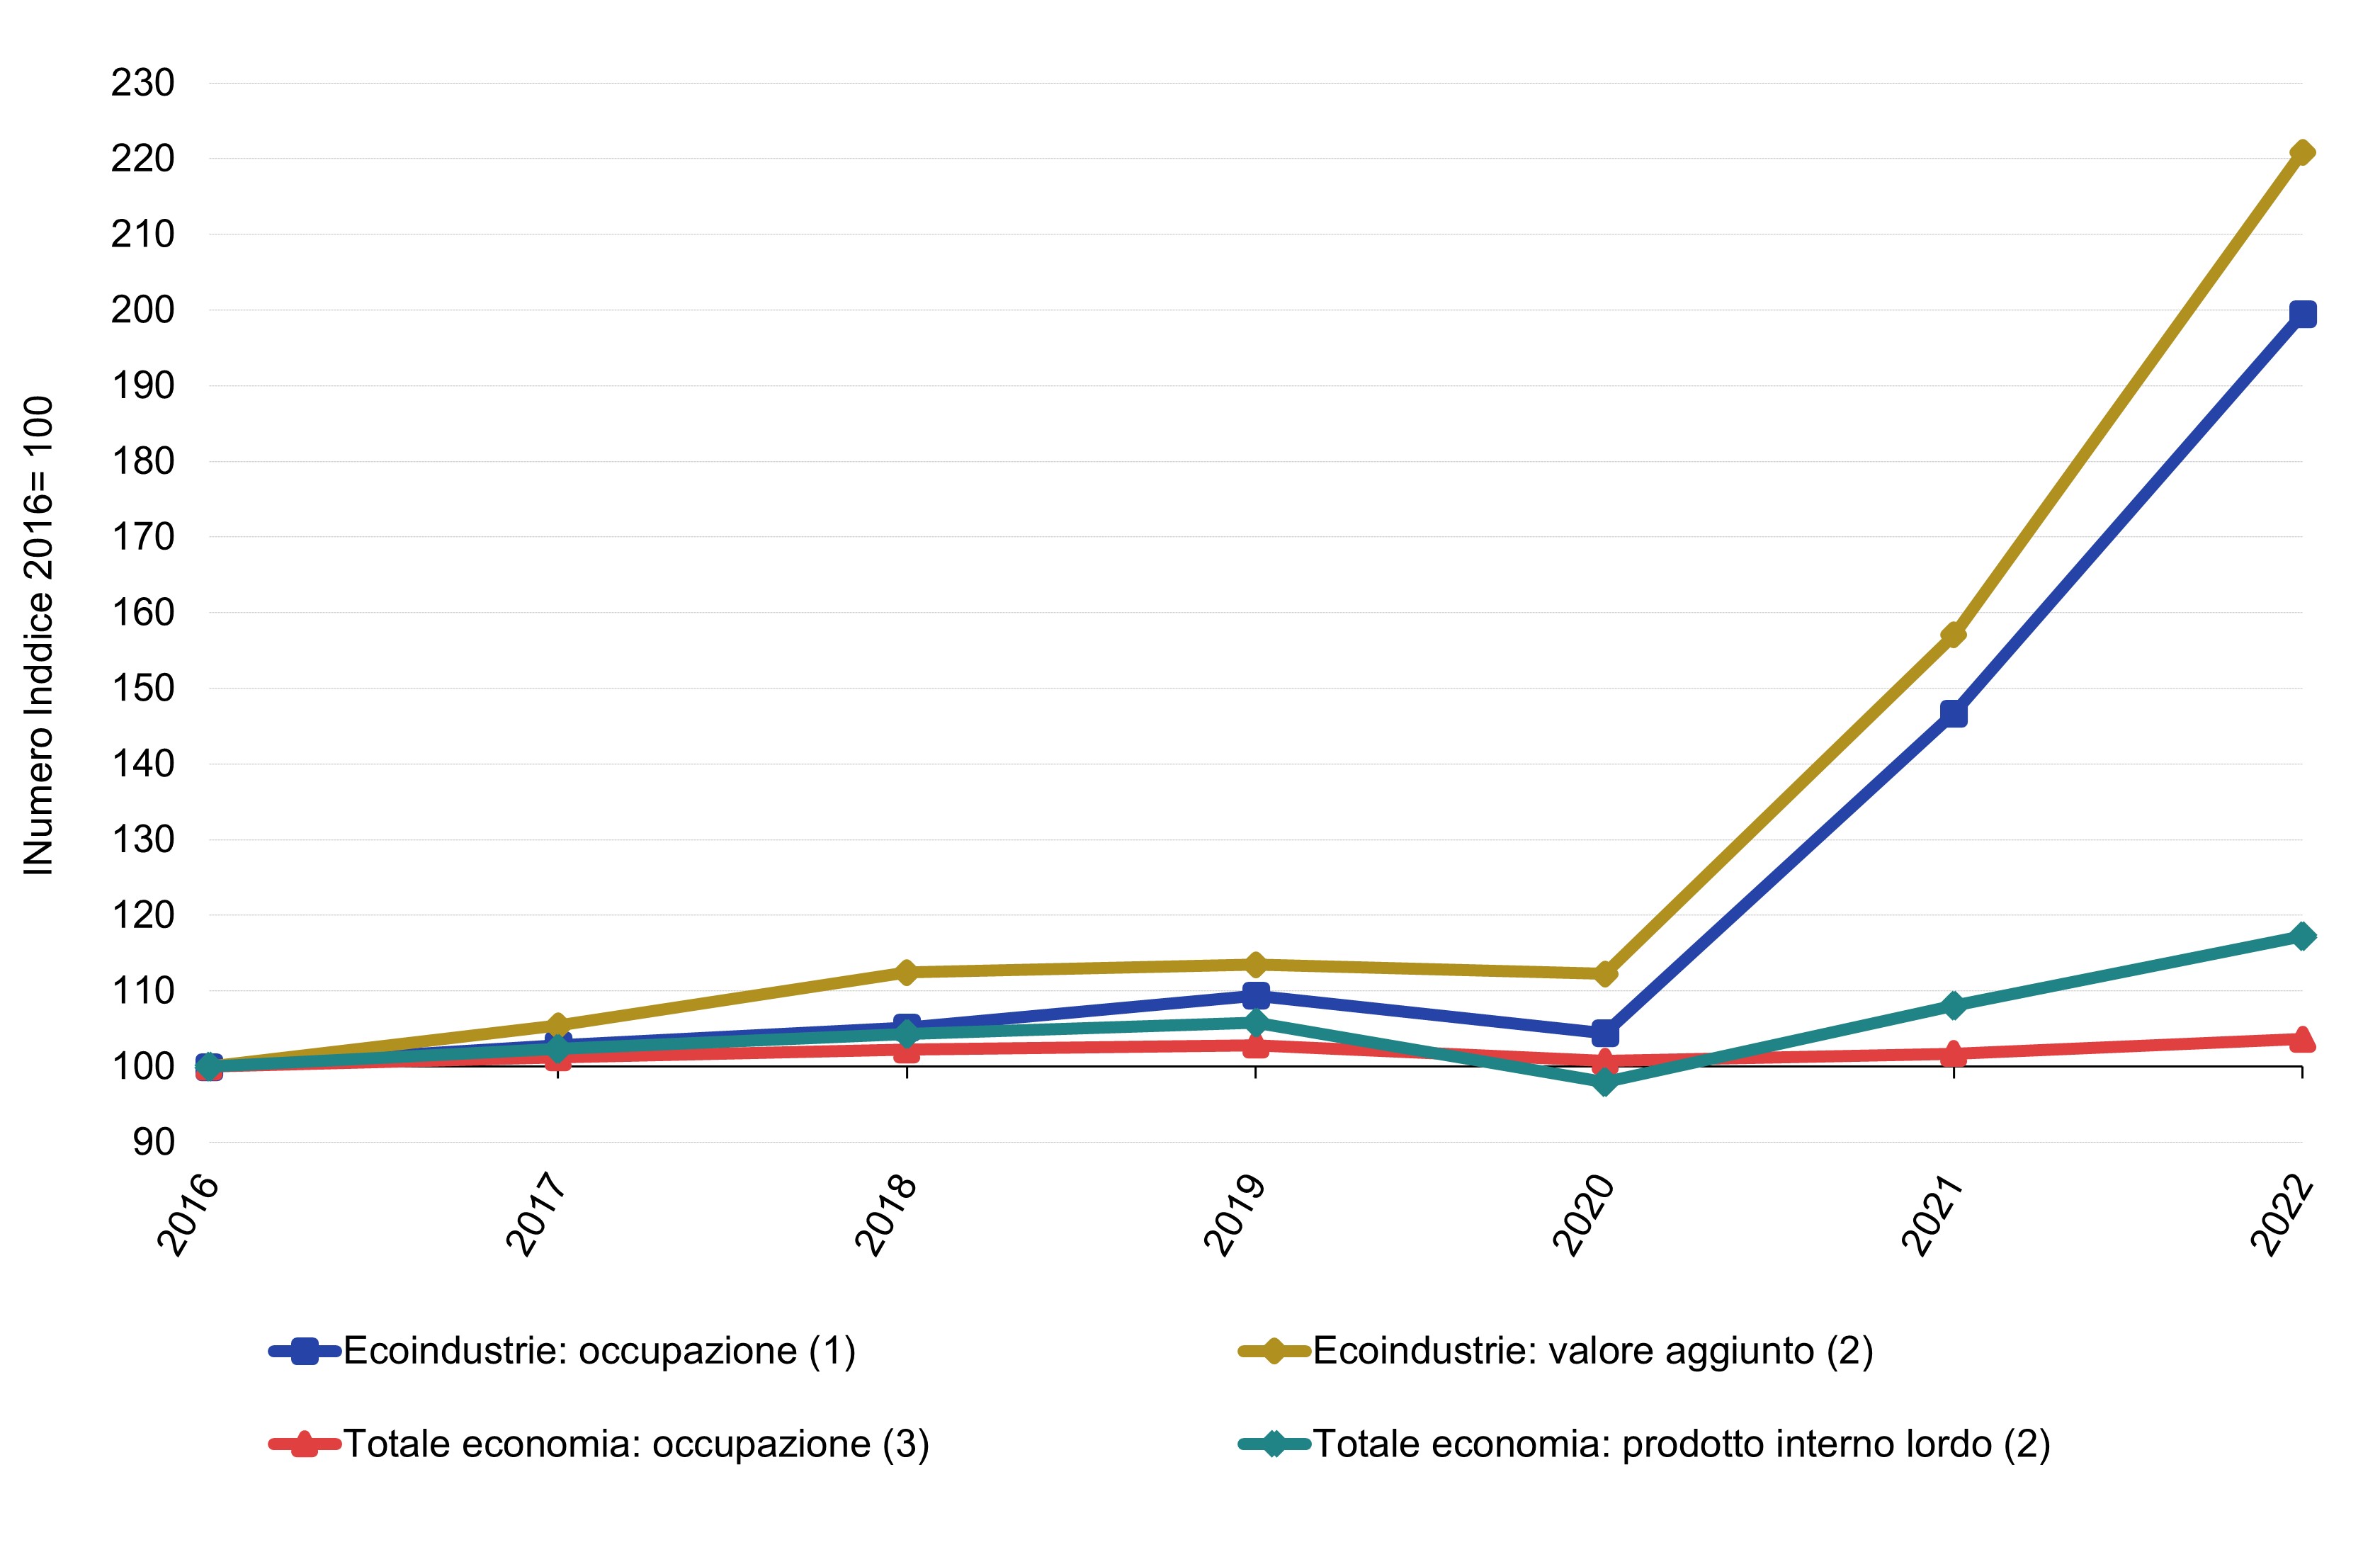
Between 2016 and 2022, employment and value added in eco-industries showed growth (respectively +99.5% and +120.9%), with a considerable increase in the last two years. The environmental sector displays greater dynamism compared to the overall Italian economy (Figure 1).
| Data |
|---|
Headline
Table 1: Eco-industry indicators by economic activity (2022) Data source
ISPRA elaboration on Istat data Note
Monetary variables expressed at current prices (billion euros); employment expressed in units of labour (thousands) |
Headline
Table 2: Employment and value added of eco-industries and the overall economy Data source
ISPRA elaboration on Istat data Data legend
ULA: units of labour |
Thumbnail
Headline
Figure 1: Trends of the main indicators of eco-industries and the overall economy (Index number 2016=100) Data source
ISPRA elaboration on Istat data Data legend
(1) in units of labour; (2) current prices; (3) thousands of employees |
Thumbnail
Headline
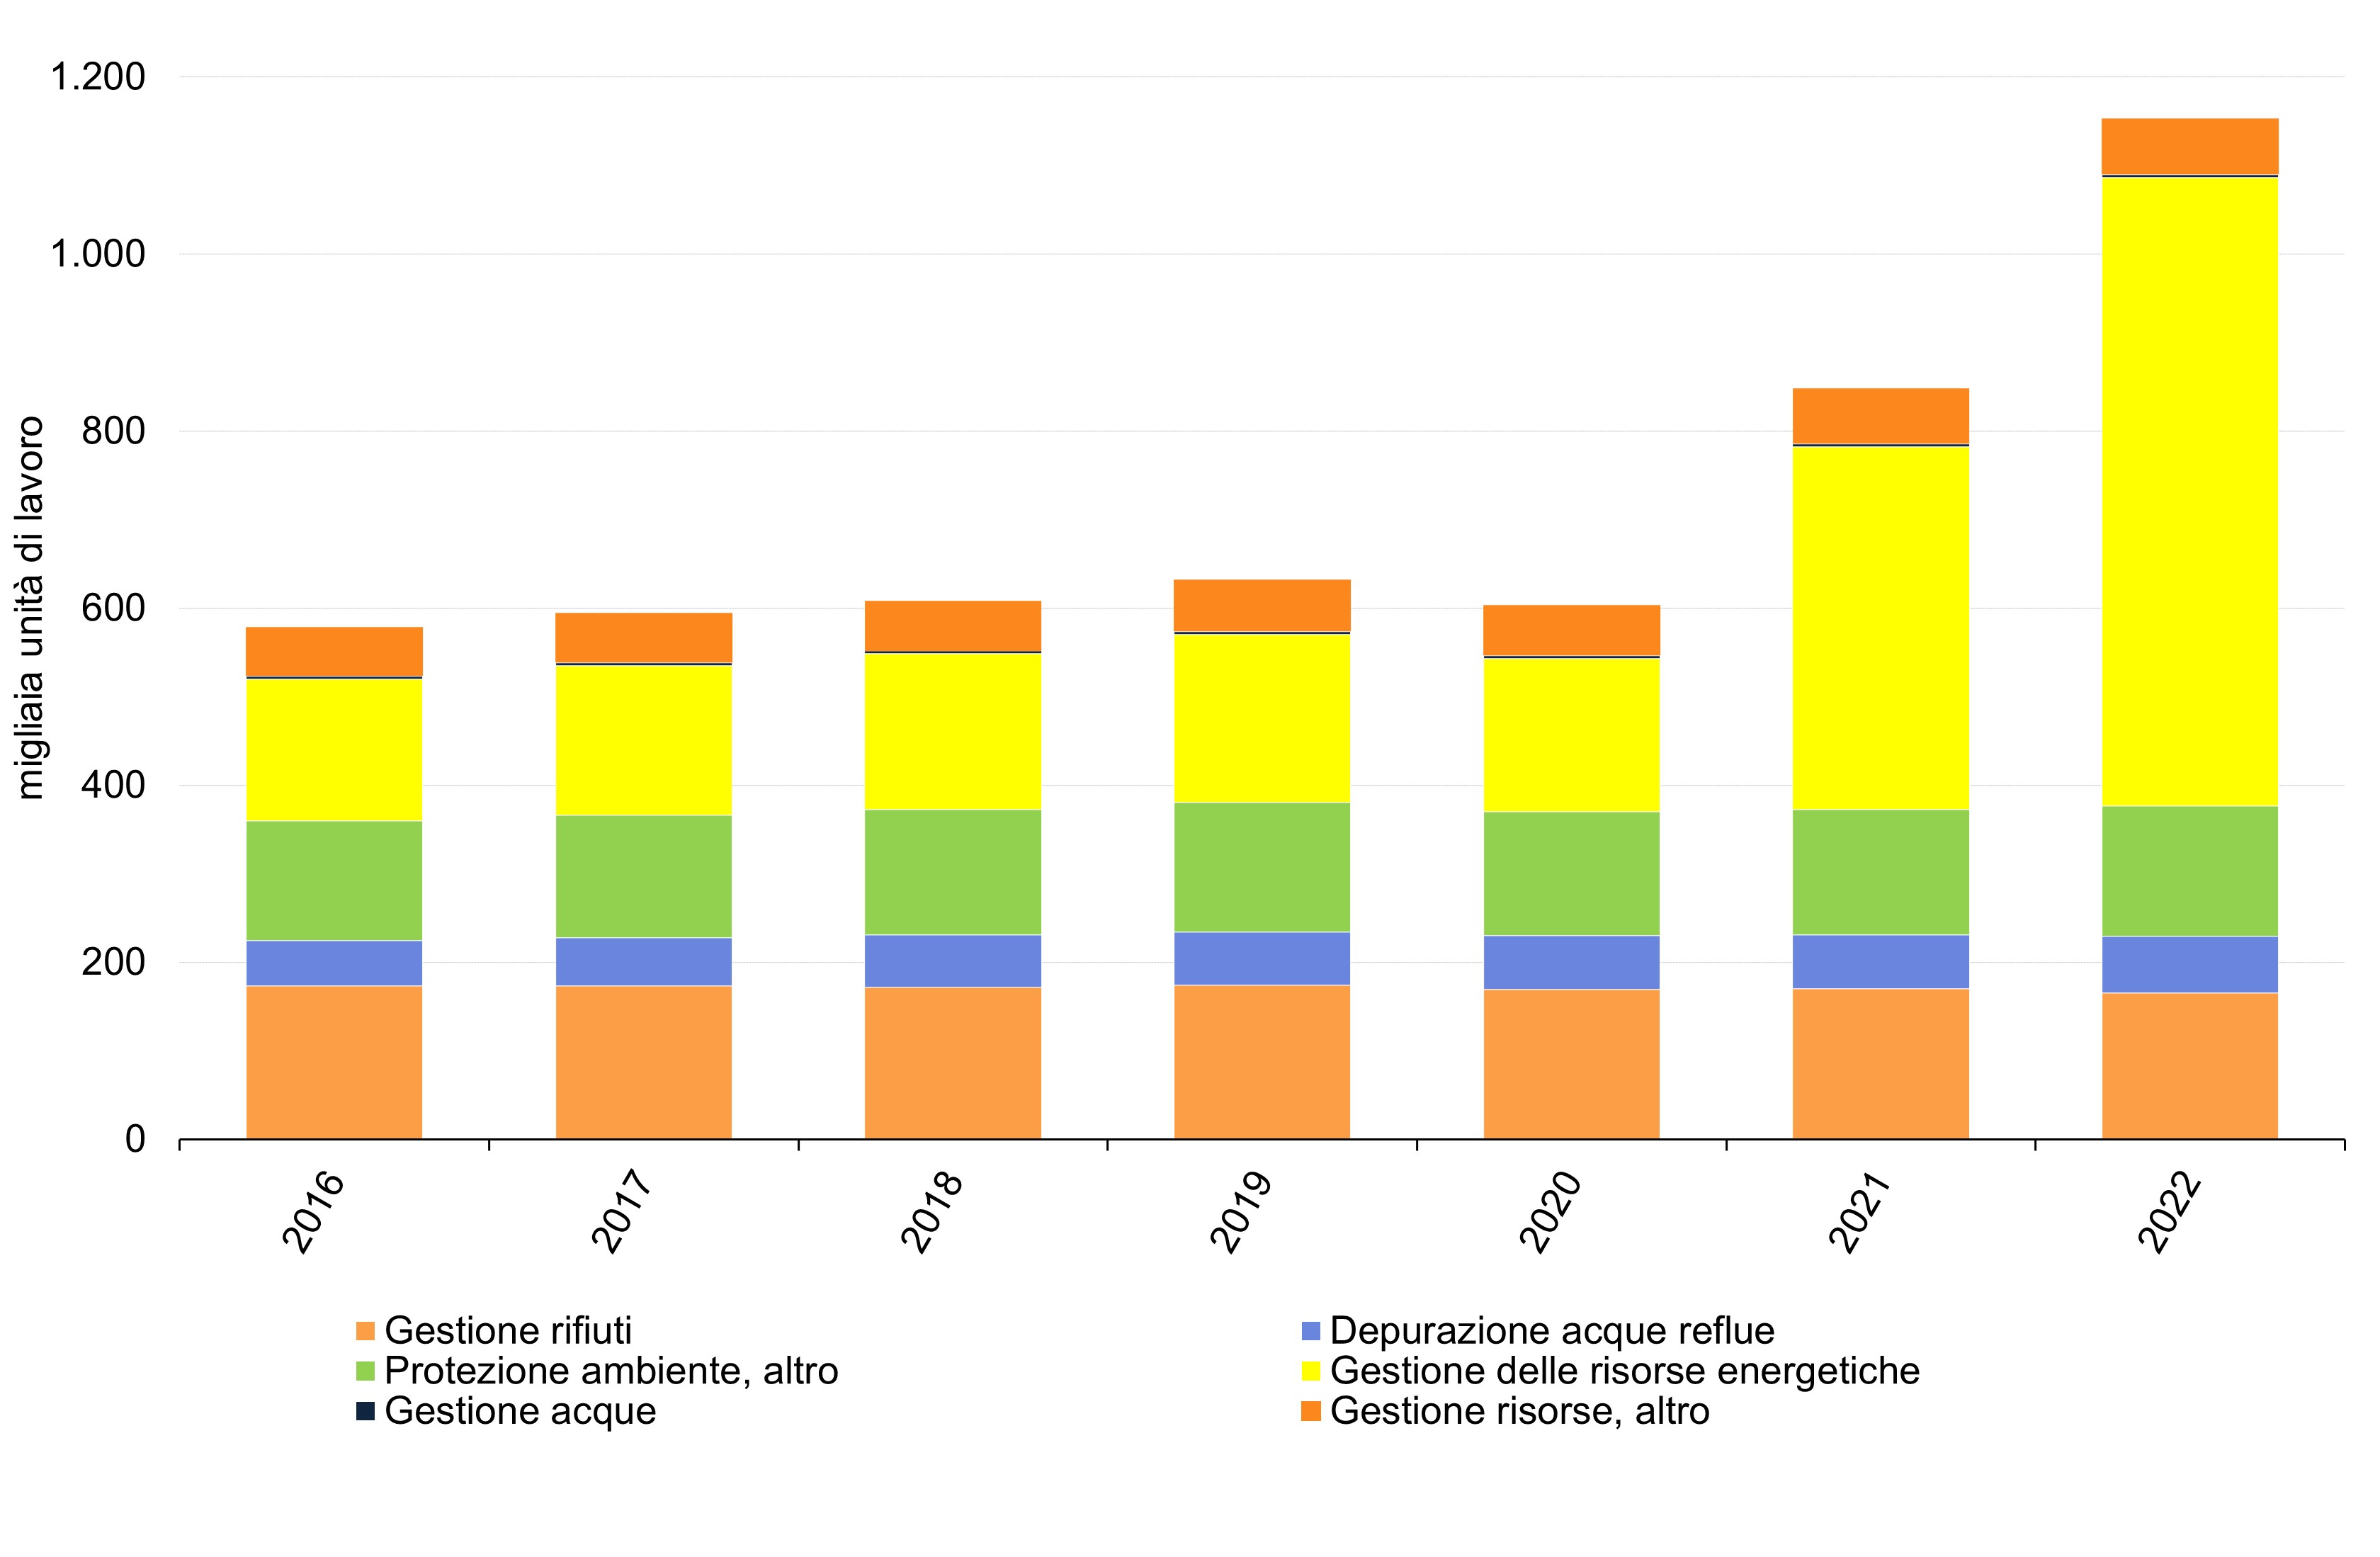
Figure 2: Employment in eco-industries by environmental purpose (environmental protection and resource management) Data source
ISPRA elaboration on Istat data |
Thumbnail
Headline
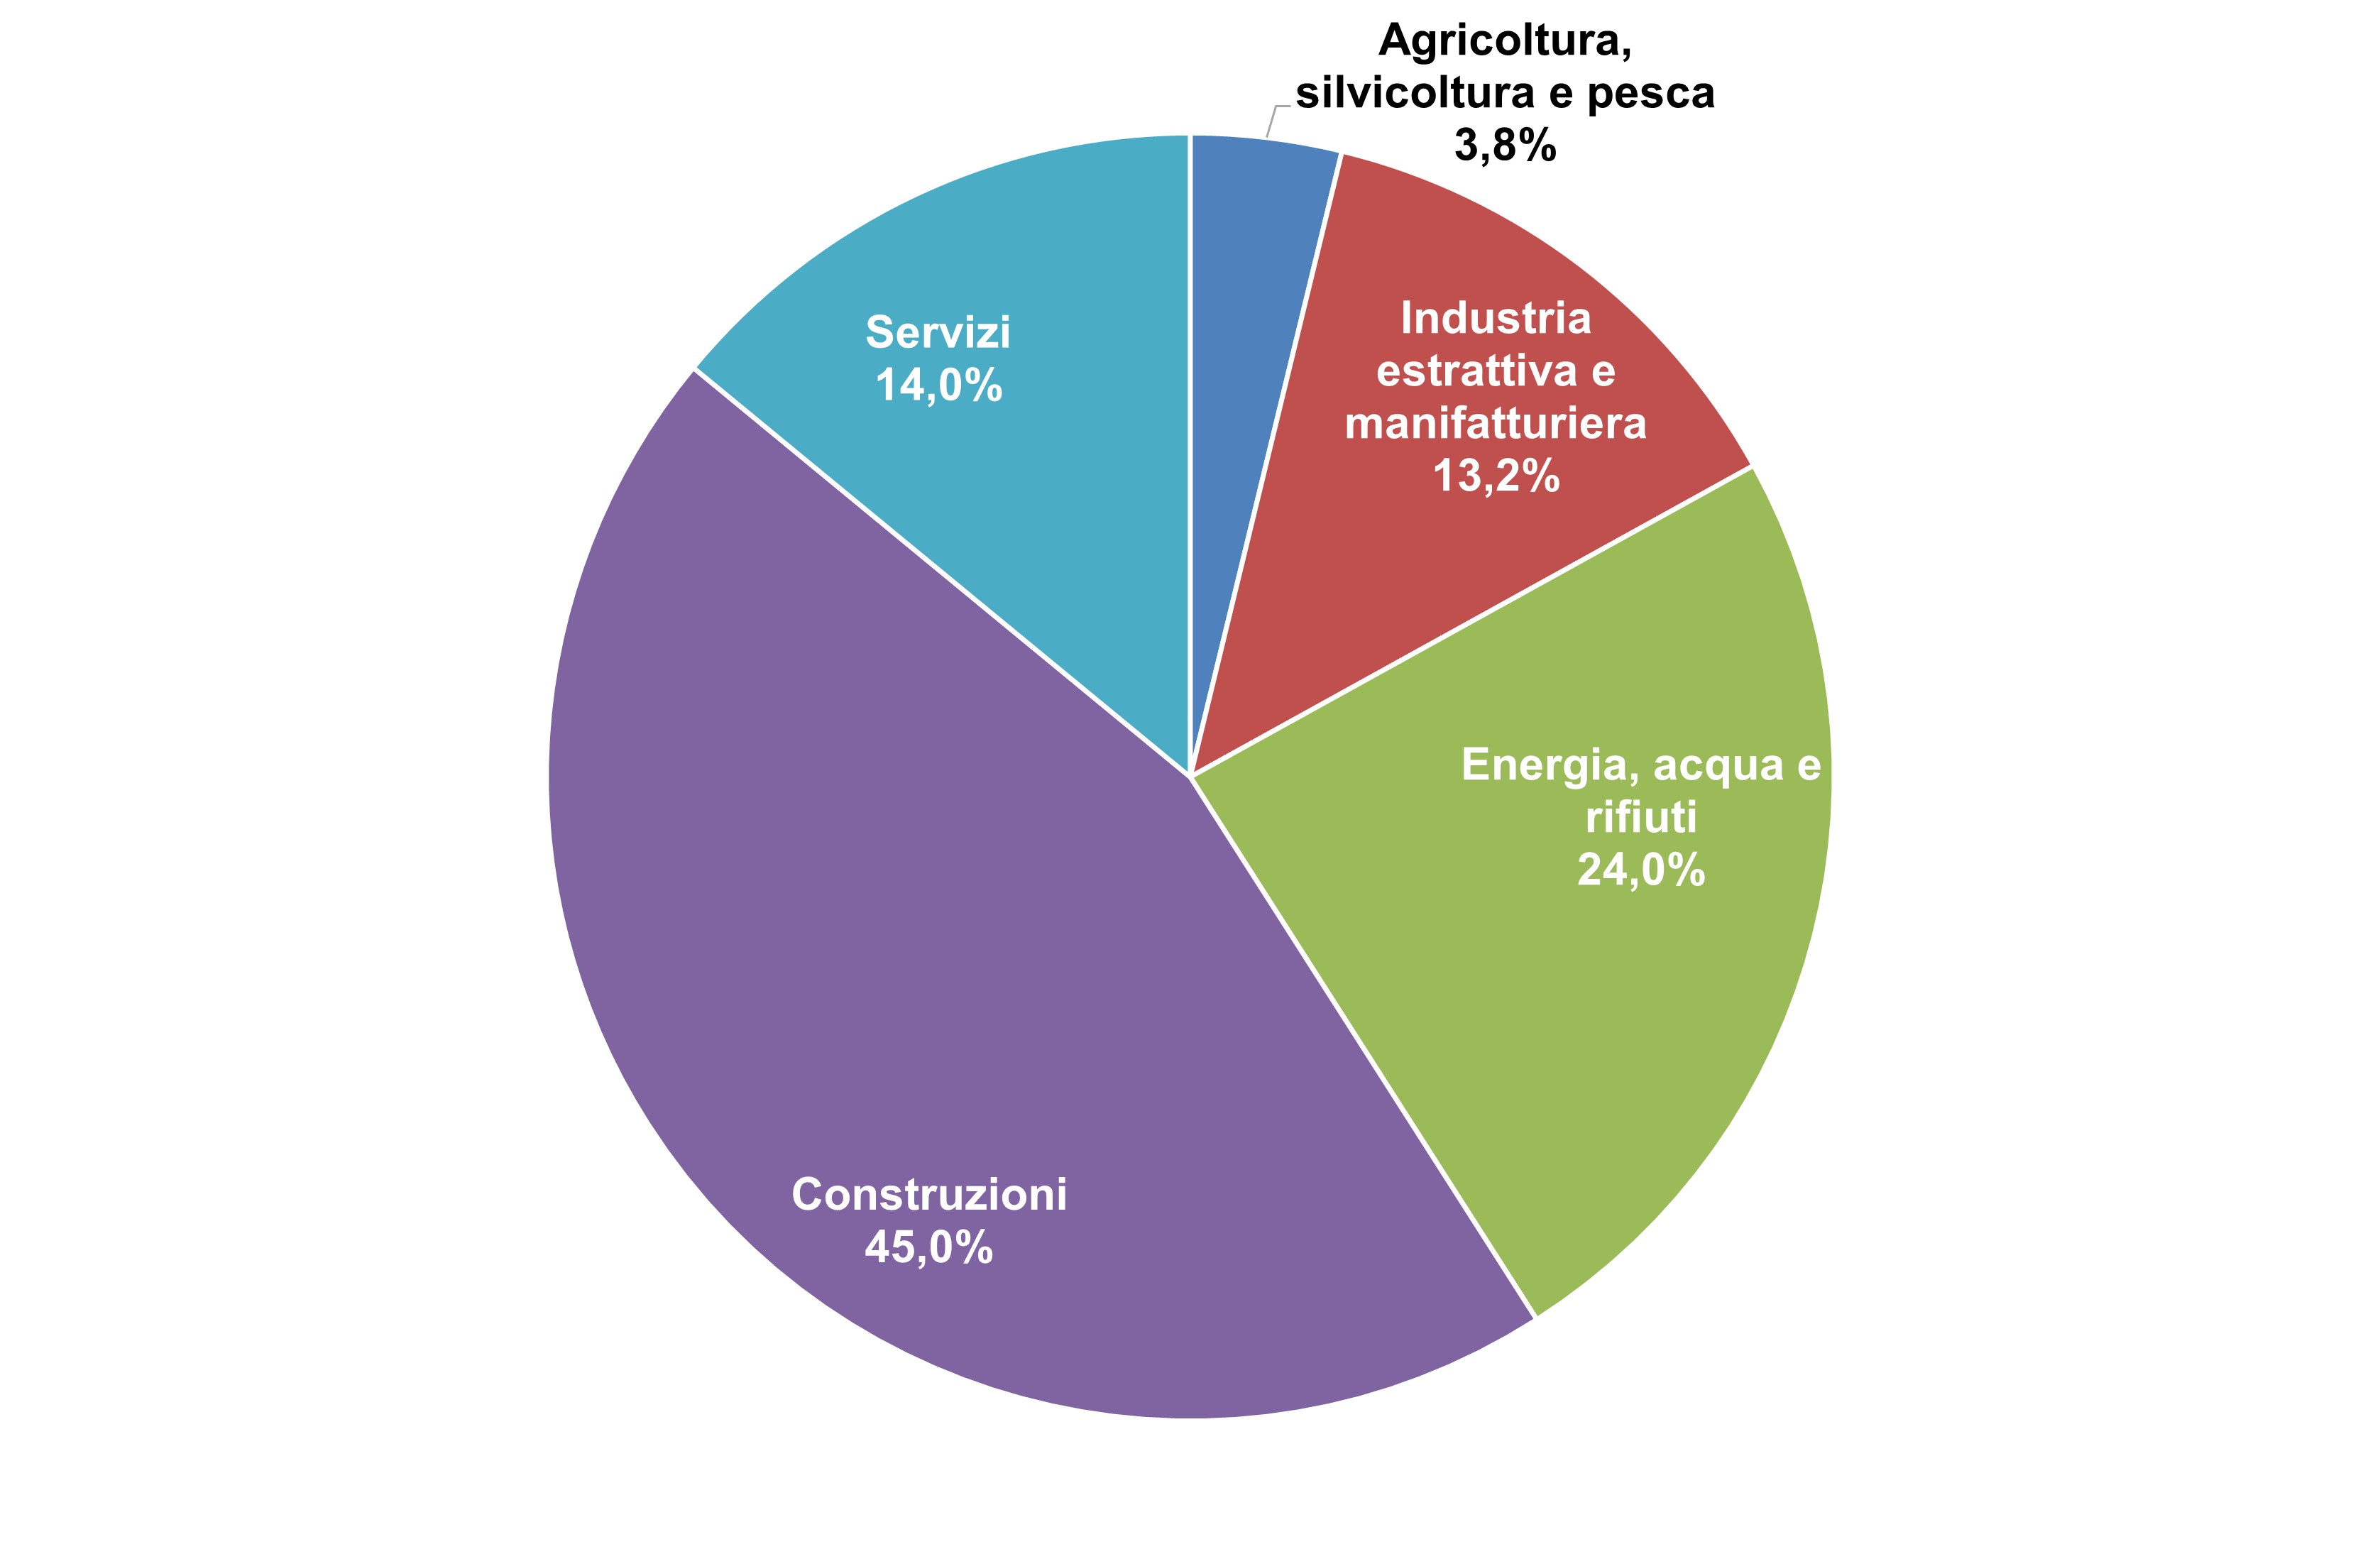
Figure 3: Value added of environmental goods and services by economic activity (2022) Data source
ISPRA elaboration on Istat data |
Thumbnail
Headline
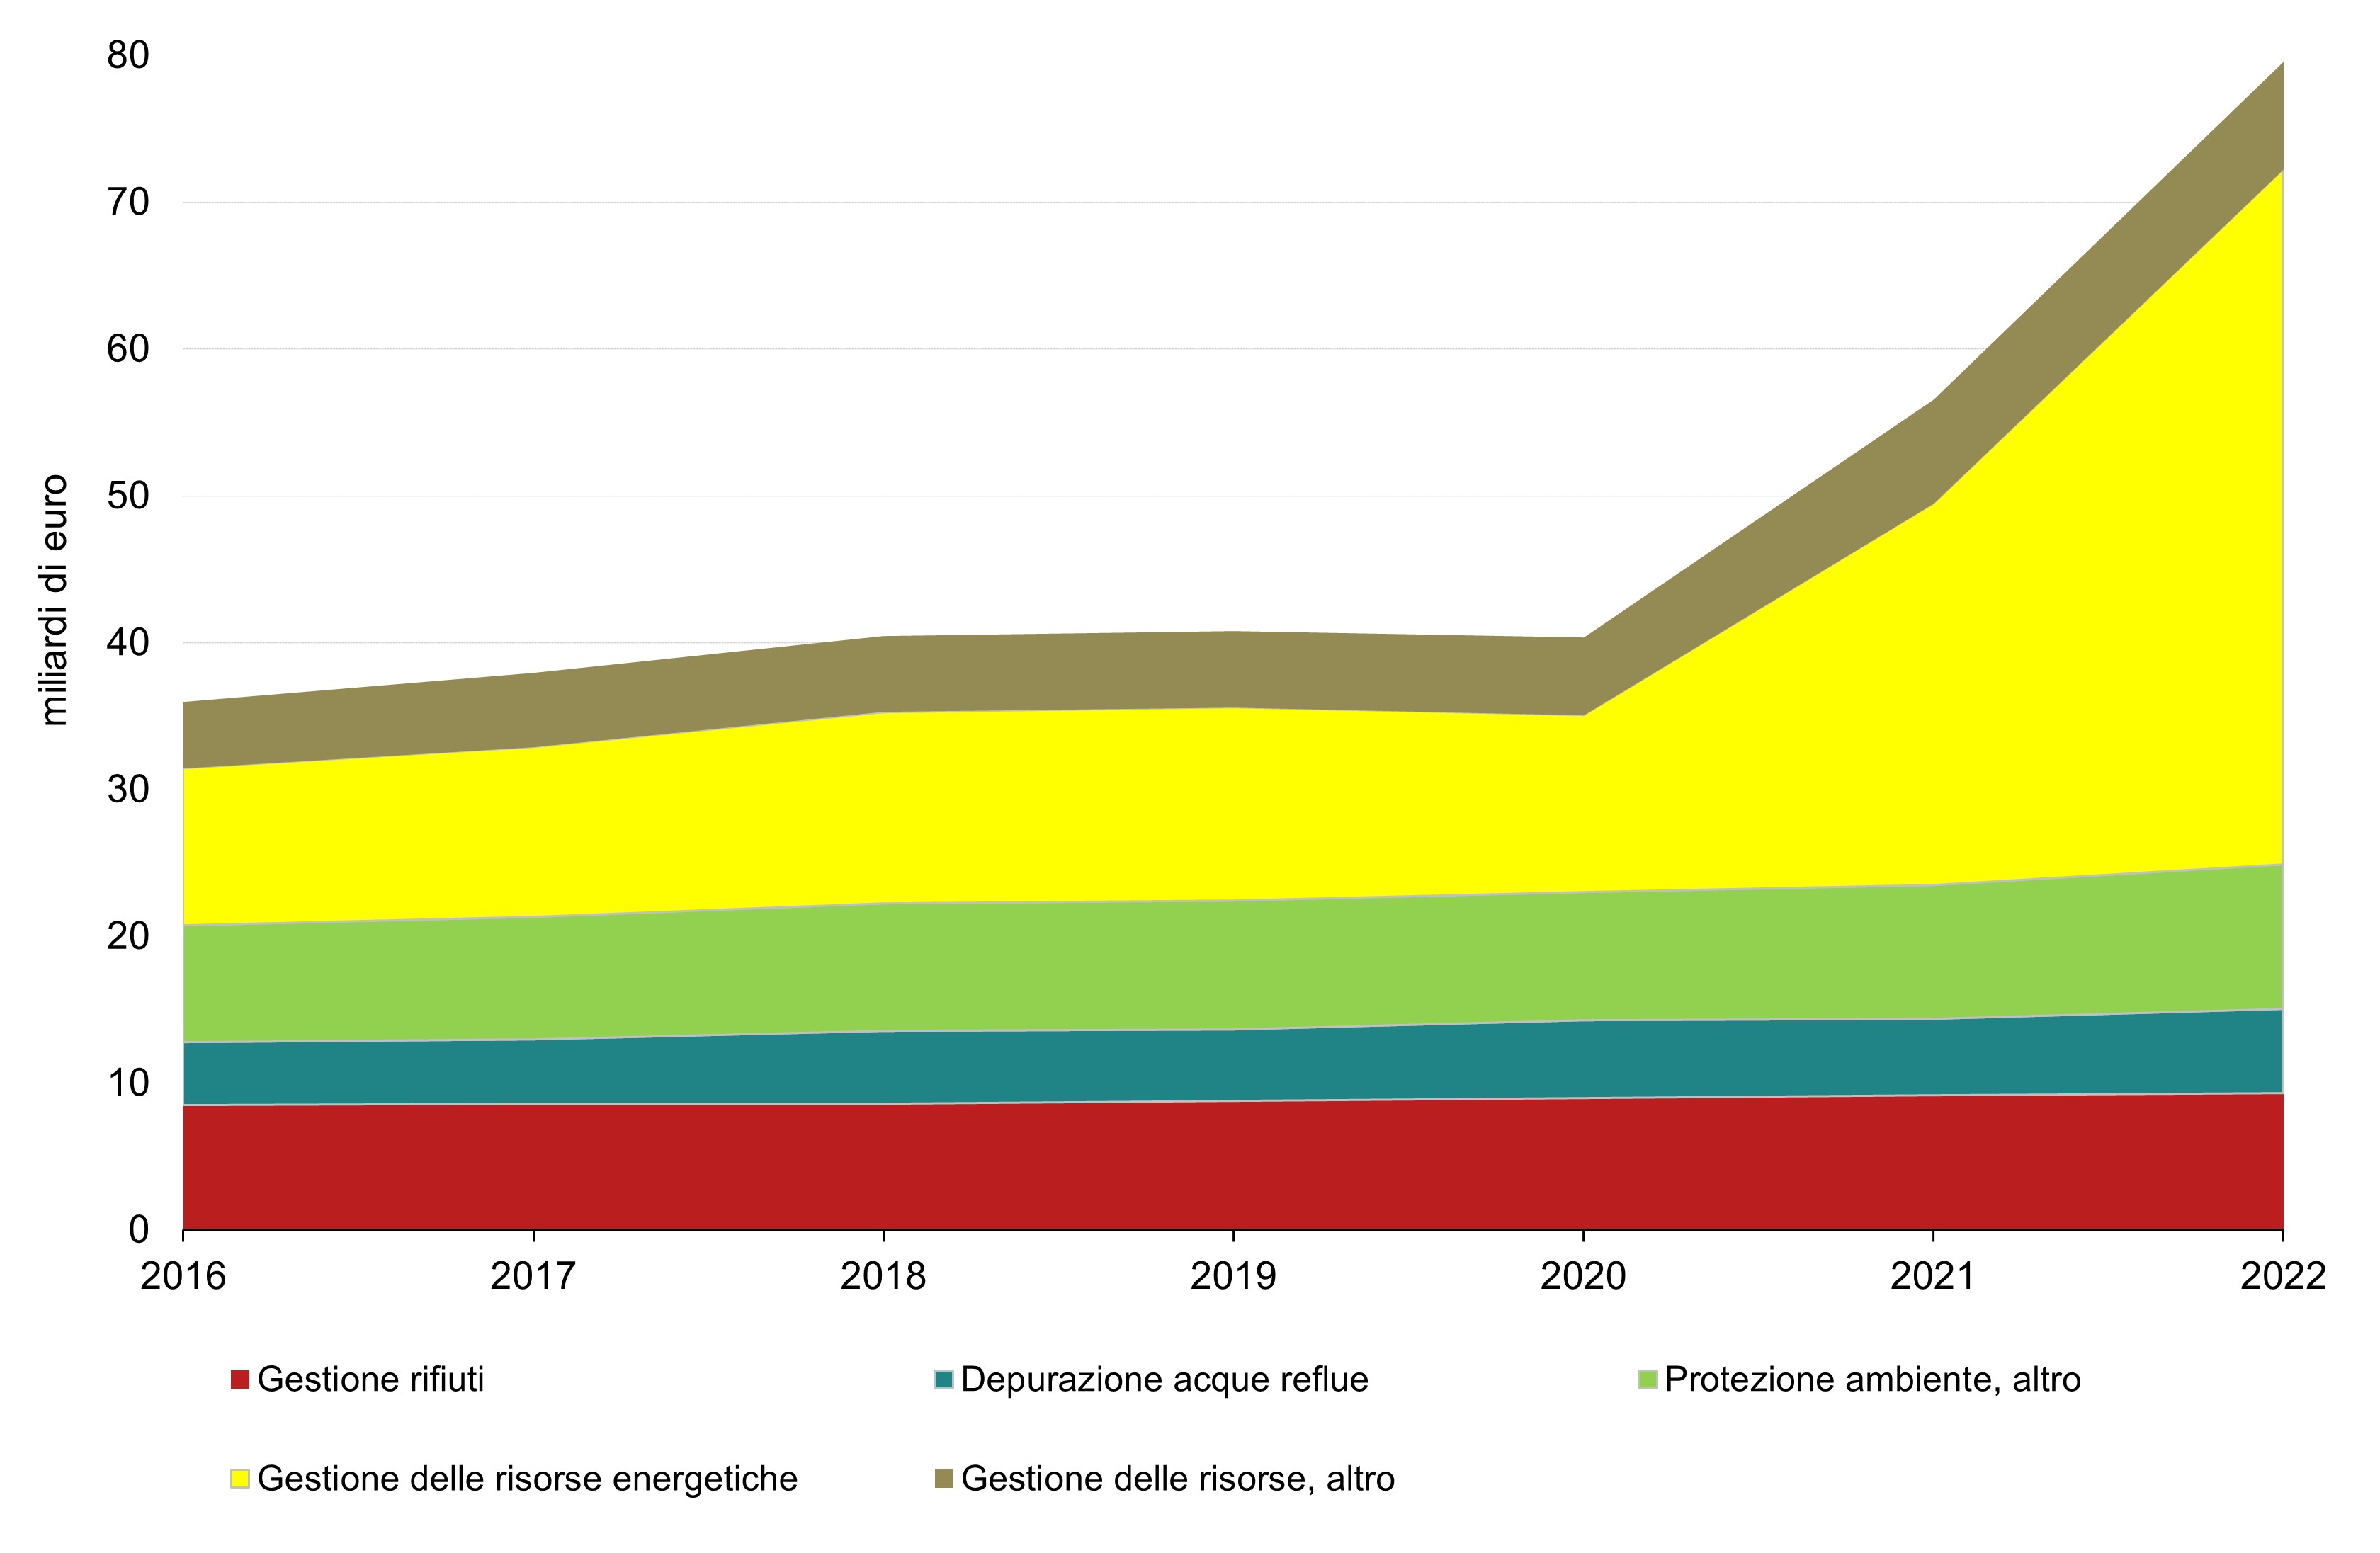
Figure 4: Value added of eco-industries by environmental purpose (environmental protection and resource management) Data source
ISPRA elaboration on Istat data |
In recent years, the eco-industry sector has recorded widespread growth, with positive trends across all major areas. In particular, there has been a strong increase in activities related to improving energy efficiency—a central component of energy resource management (Figures 2 and 4)—supported by the evolution of European regulations. Directive 2010/31/EU, which from 2021 imposes nZEB standards for all new buildings and deep renovations, has stimulated demand for high energy-performance interventions, fostering the expansion of employment and value added in the sector. Within energy resource management, positive effects are also observed in renewable energy production, partly driven by rising energy prices and the consequent strengthening of investments in clean technologies. In 2022, this segment represents the largest share of the sector, accounting for 61.5% of employment and 59.5% of total value added (Figures 2 and 4). Analysis by economic activity confirms the leading role of construction, which in 2022 accounted for more than half of employment in the eco-industry sector (53.4%) and generated the highest share of value added (45%), with labour productivity levels higher than those of other economic activities (Table 1 and Figure 3). This reflects the growing integration of environmental objectives into building renovation policies and the adoption of more sustainable technologies, in line with trends observed at the European level.