Cristina Frizza
The circular material use rate measures the share of material resources reused by an economy. In the period 2004–2023, Italy's circular material use rate increased from 5.8% to 20.8%.
The circular material use rate (Circular Material Use Rate – CMUR in English) measures the contribution of reused materials (R) relative to total material use (T) across the entire economy and by resource category (biomass, metal ores, non-metallic minerals, fossil fuels). The indicator thus represents the percentage of secondary raw materials used in production processes. This indicator was developed by Eurostat and published, starting in January 2018, within the Monitoring Framework of the European Commission's Communication 'Closing the loop - An EU action plan for the Circular Economy', COM(2015) 614 final, followed by Communication COM(2020) 98 final of March 2020 'A new Circular Economy Action Plan - For a cleaner and more competitive Europe'.
The purpose is to measure the contribution of recycled materials relative to the total demand for materials. A higher CMUR indicates that a greater amount of secondary raw materials replaces extracted or imported materials, and the indicator also emphasizes, as it is structured, the effort an economy puts into collecting materials intended for recovery.
Communication COM(2020) 98 final of March 11, 2020, 'A new Circular Economy Action Plan - For a cleaner and more competitive Europe'. The COM(2020) 98 Communication aims to "double the percentage of circular material use in the next decade.
Circular material use rate — Calculation method — 2018 edition. Eurostat, Luxembourg (https://ec.europa.eu/eurostat/web/products-manuals-and-guidelines/-/KS-GQ-18-013?inheritRedirect=true&redirect=%2Feurostat%2Fpublications%2Fmanuals-and-guidelines)
The material input of an economic system consists of both raw materials and secondary raw materials, both domestic and imported. Secondary raw materials are subdivided as follows: a) materials (wastes) recovered; b) materials (not derived from waste management) generated as by-products of certain production processes; these by-products can be further subdivided into b.1) materials with economic value exchanged between plants; b.2) intra-plant flows. Case a) can be approximated by waste statistics, assuming that the input to recovery plants equals the output and that all of it becomes secondary raw material. Case b) is currently excluded from official statistics. Ultimately, what is currently evaluated is only the contribution of the waste management system to the circular economy. Other circular uses of materials, such as industrial symbiosis, are excluded. In the future, the portion of secondary raw materials not derived from waste may grow due to its increasing value. In other words, it is expected that the valorization of these materials and their circular flows will be more integrated into the ordinary economy. This will not be visible as circular use but only as reduced extraction of natural resources.
Eurostat, Istat, ISPRA
Eurostat Database for EU27 data and Member States: https://ec.europa.eu/eurostat/databrowser/view/env_ac_cur/default/table?lang=en
National
2004-2023
The processing relies on the integration of three data sources: waste statistics (ISPRA); international trade statistics (Istat); material flow accounts (Istat). The indicator is defined as the ratio (R / T) between reused materials (R) and total material use (T). A higher rate corresponds to a greater use of secondary materials replacing primary raw materials (and thus extracted natural resources). The numerator (R) includes: "Waste recovery" minus "Waste imports for recovery" plus "Waste exports for recovery." Note that "Waste recovery" does not include energy recovery and backfilling. The denominator (T) includes: "Domestic material consumption" plus reused materials (R). For further details: Circular material use rate — Calculation method — 2018 edition.
Eurostat, Luxembourg (https://ec.europa.eu/eurostat/web/products-manuals-and-guidelines/-/KS-GQ-18-013?inheritRedirect=true&redirect=%2Feurostat%2Fpublications%2Fmanuals-and-guidelines)
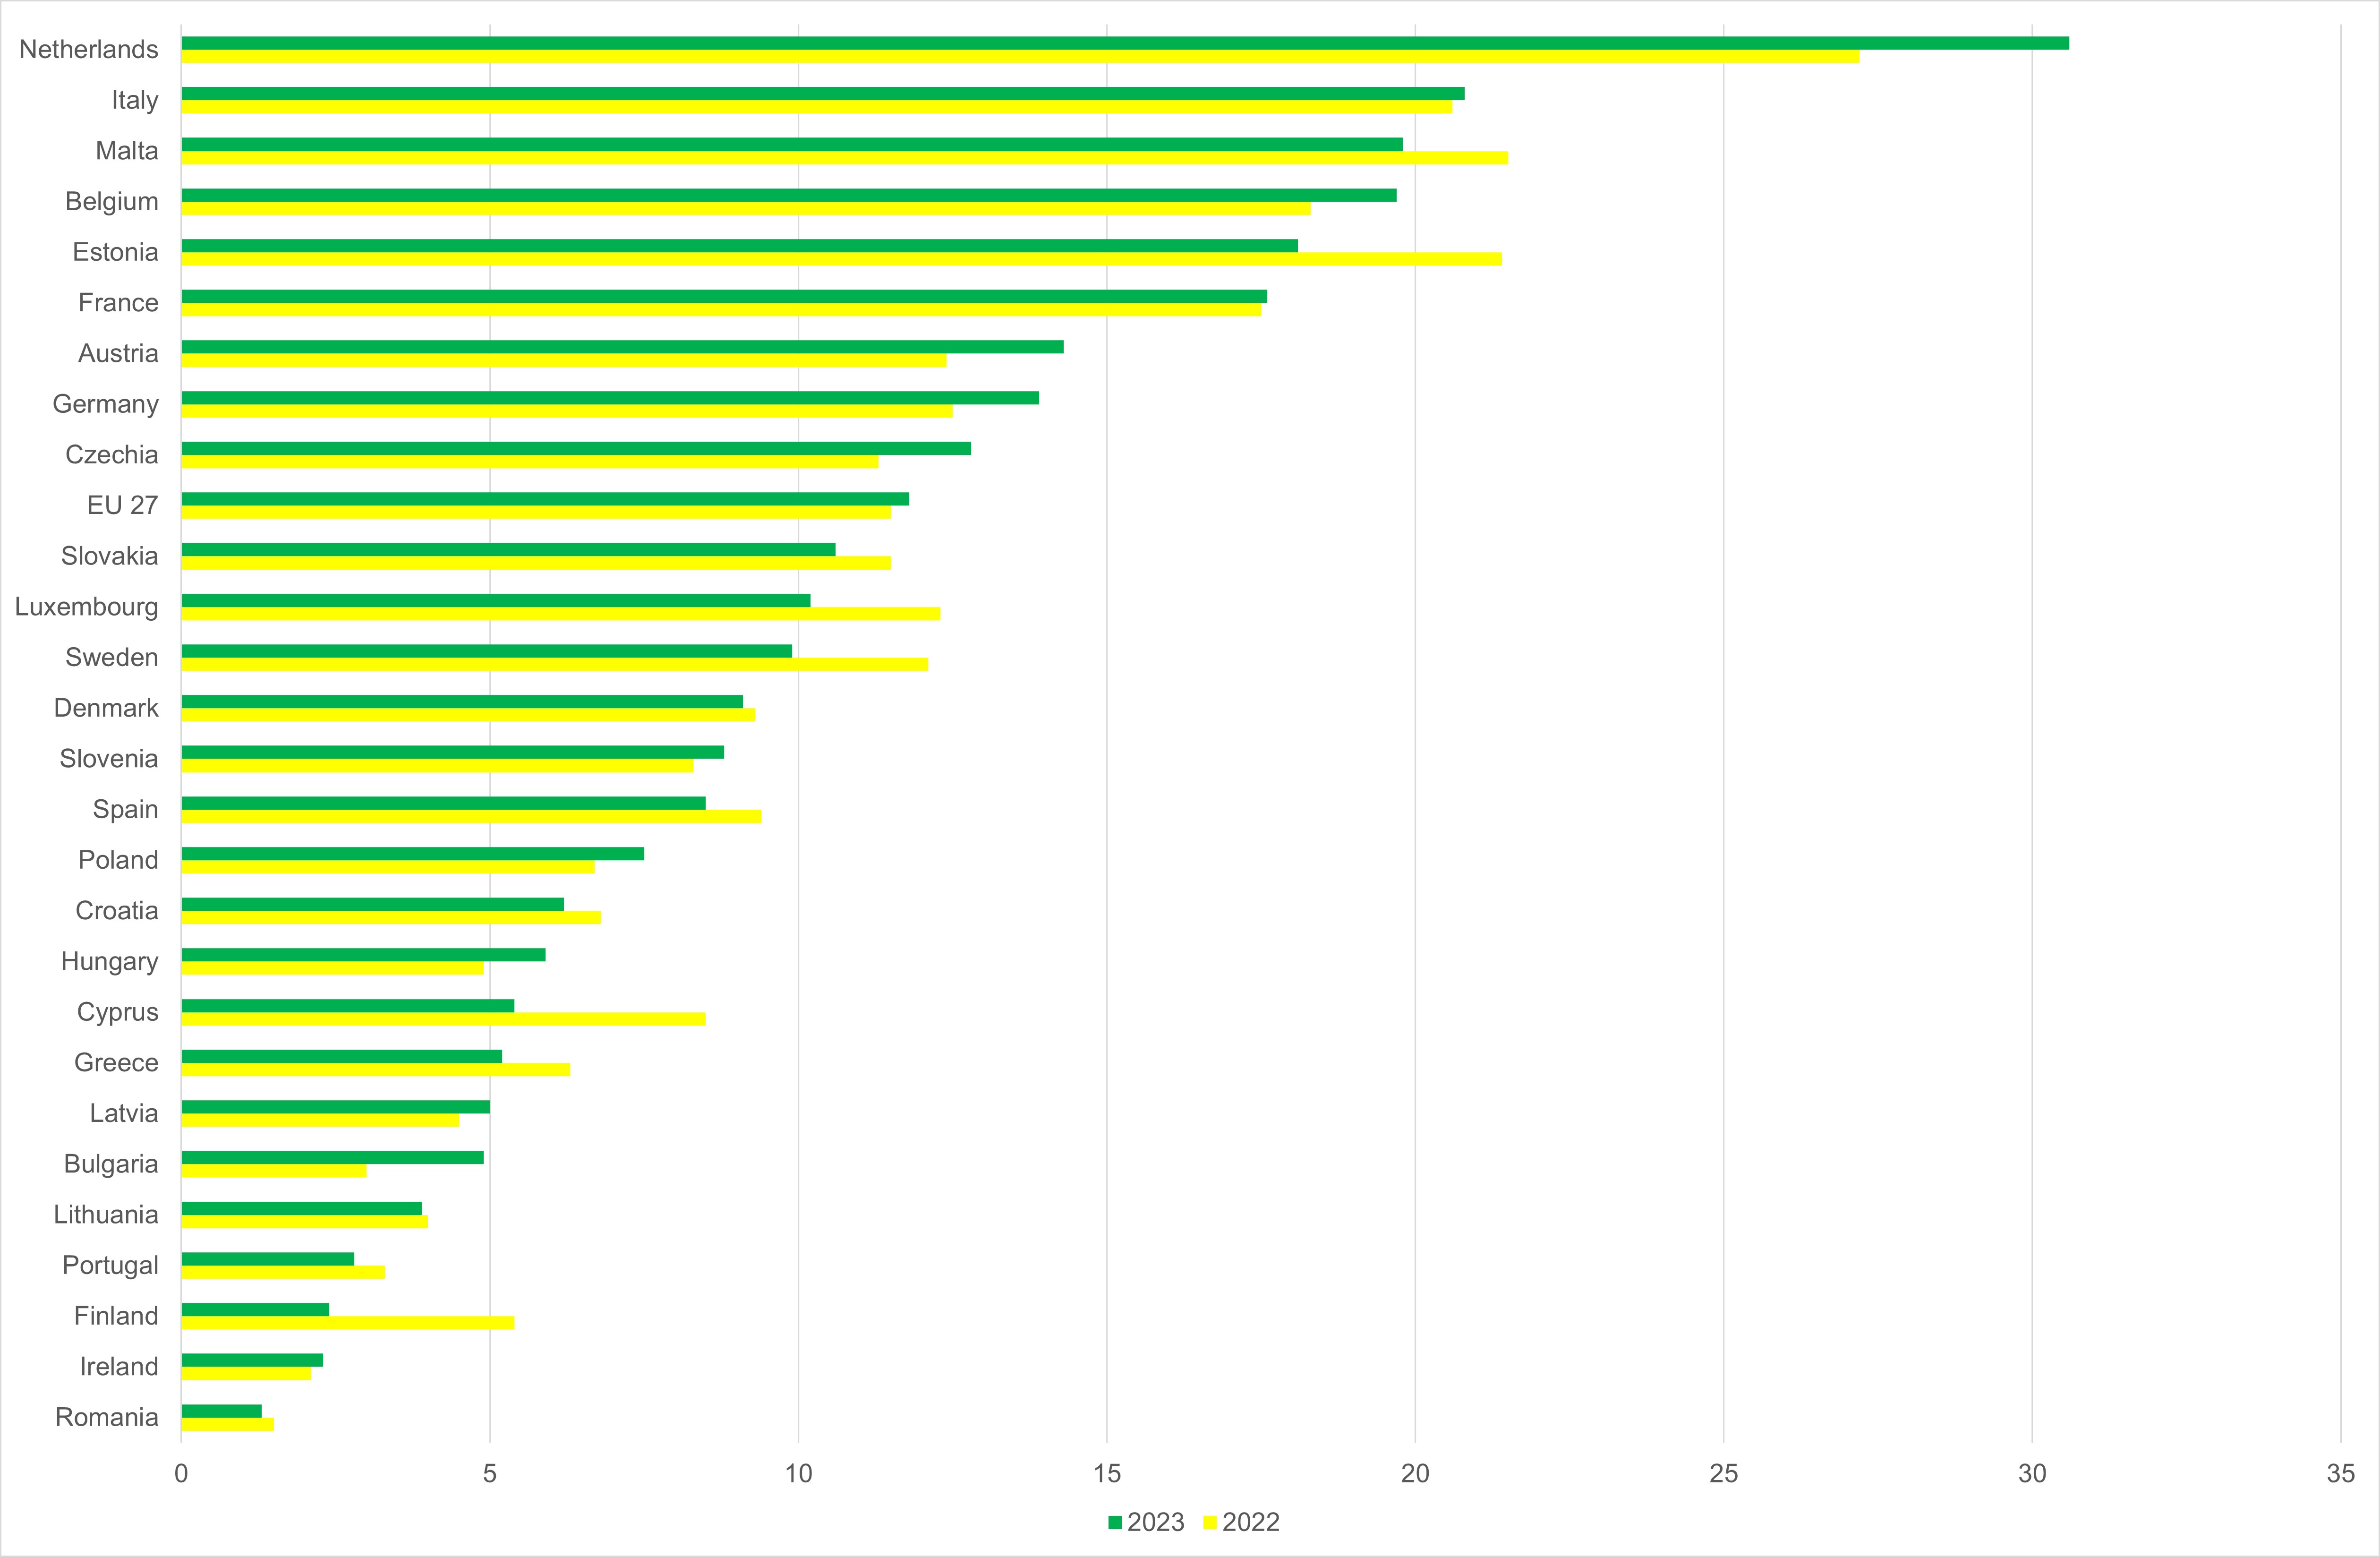
In 2023, the circular material use rate for Italy stood at 20.8%, reaching the highest value recorded in the period from 2004 to 2023. This figure is higher than the European average, which in 2023 was 11.8% (Table 1, Figure 1).
The circular material use rate increased from 5.8% to 20.8% between 2004 and 2023, marking a rise of nearly 15 percentage points. This trend can be considered positive (Table 1, Figure 1).
| Allegati |
|---|
Titolo
Table 1: Circular Material Use Rate Fonte
ISPRA elaborations based on Eurostat and ISPRA data Note
2023: provisional estimates |
Thumbnail
Titolo
Figure 1: Circular material use rate in the EU 27 Fonte
ISPRA elaboration based on Eurostat data Note
The 2023 data are provisional estimates |
In 2023, Italy recorded a circular material use rate of 20.8%, ranking second among European Union countries, just behind the Netherlands (30.6%) and ahead of Malta (19.8%) (Figure 1). Italy’s result is significantly above the EU average, which was 11.8% in 2023. This figure reflects the country’s commitment to promoting recycling and material reuse practices, helping to reduce dependency on virgin raw materials and moving towards a more sustainable economy.
However, despite this progress, the EU as a whole is still not on track to double the circular material use rate by 2030, as outlined in the 2020 Circular Economy Action Plan. Achieving this ambitious target will require further efforts at both national and European levels to improve recycling infrastructure, encourage innovation, and promote more sustainable consumption models.