Serena Bernabei, Marilena Insolvibile
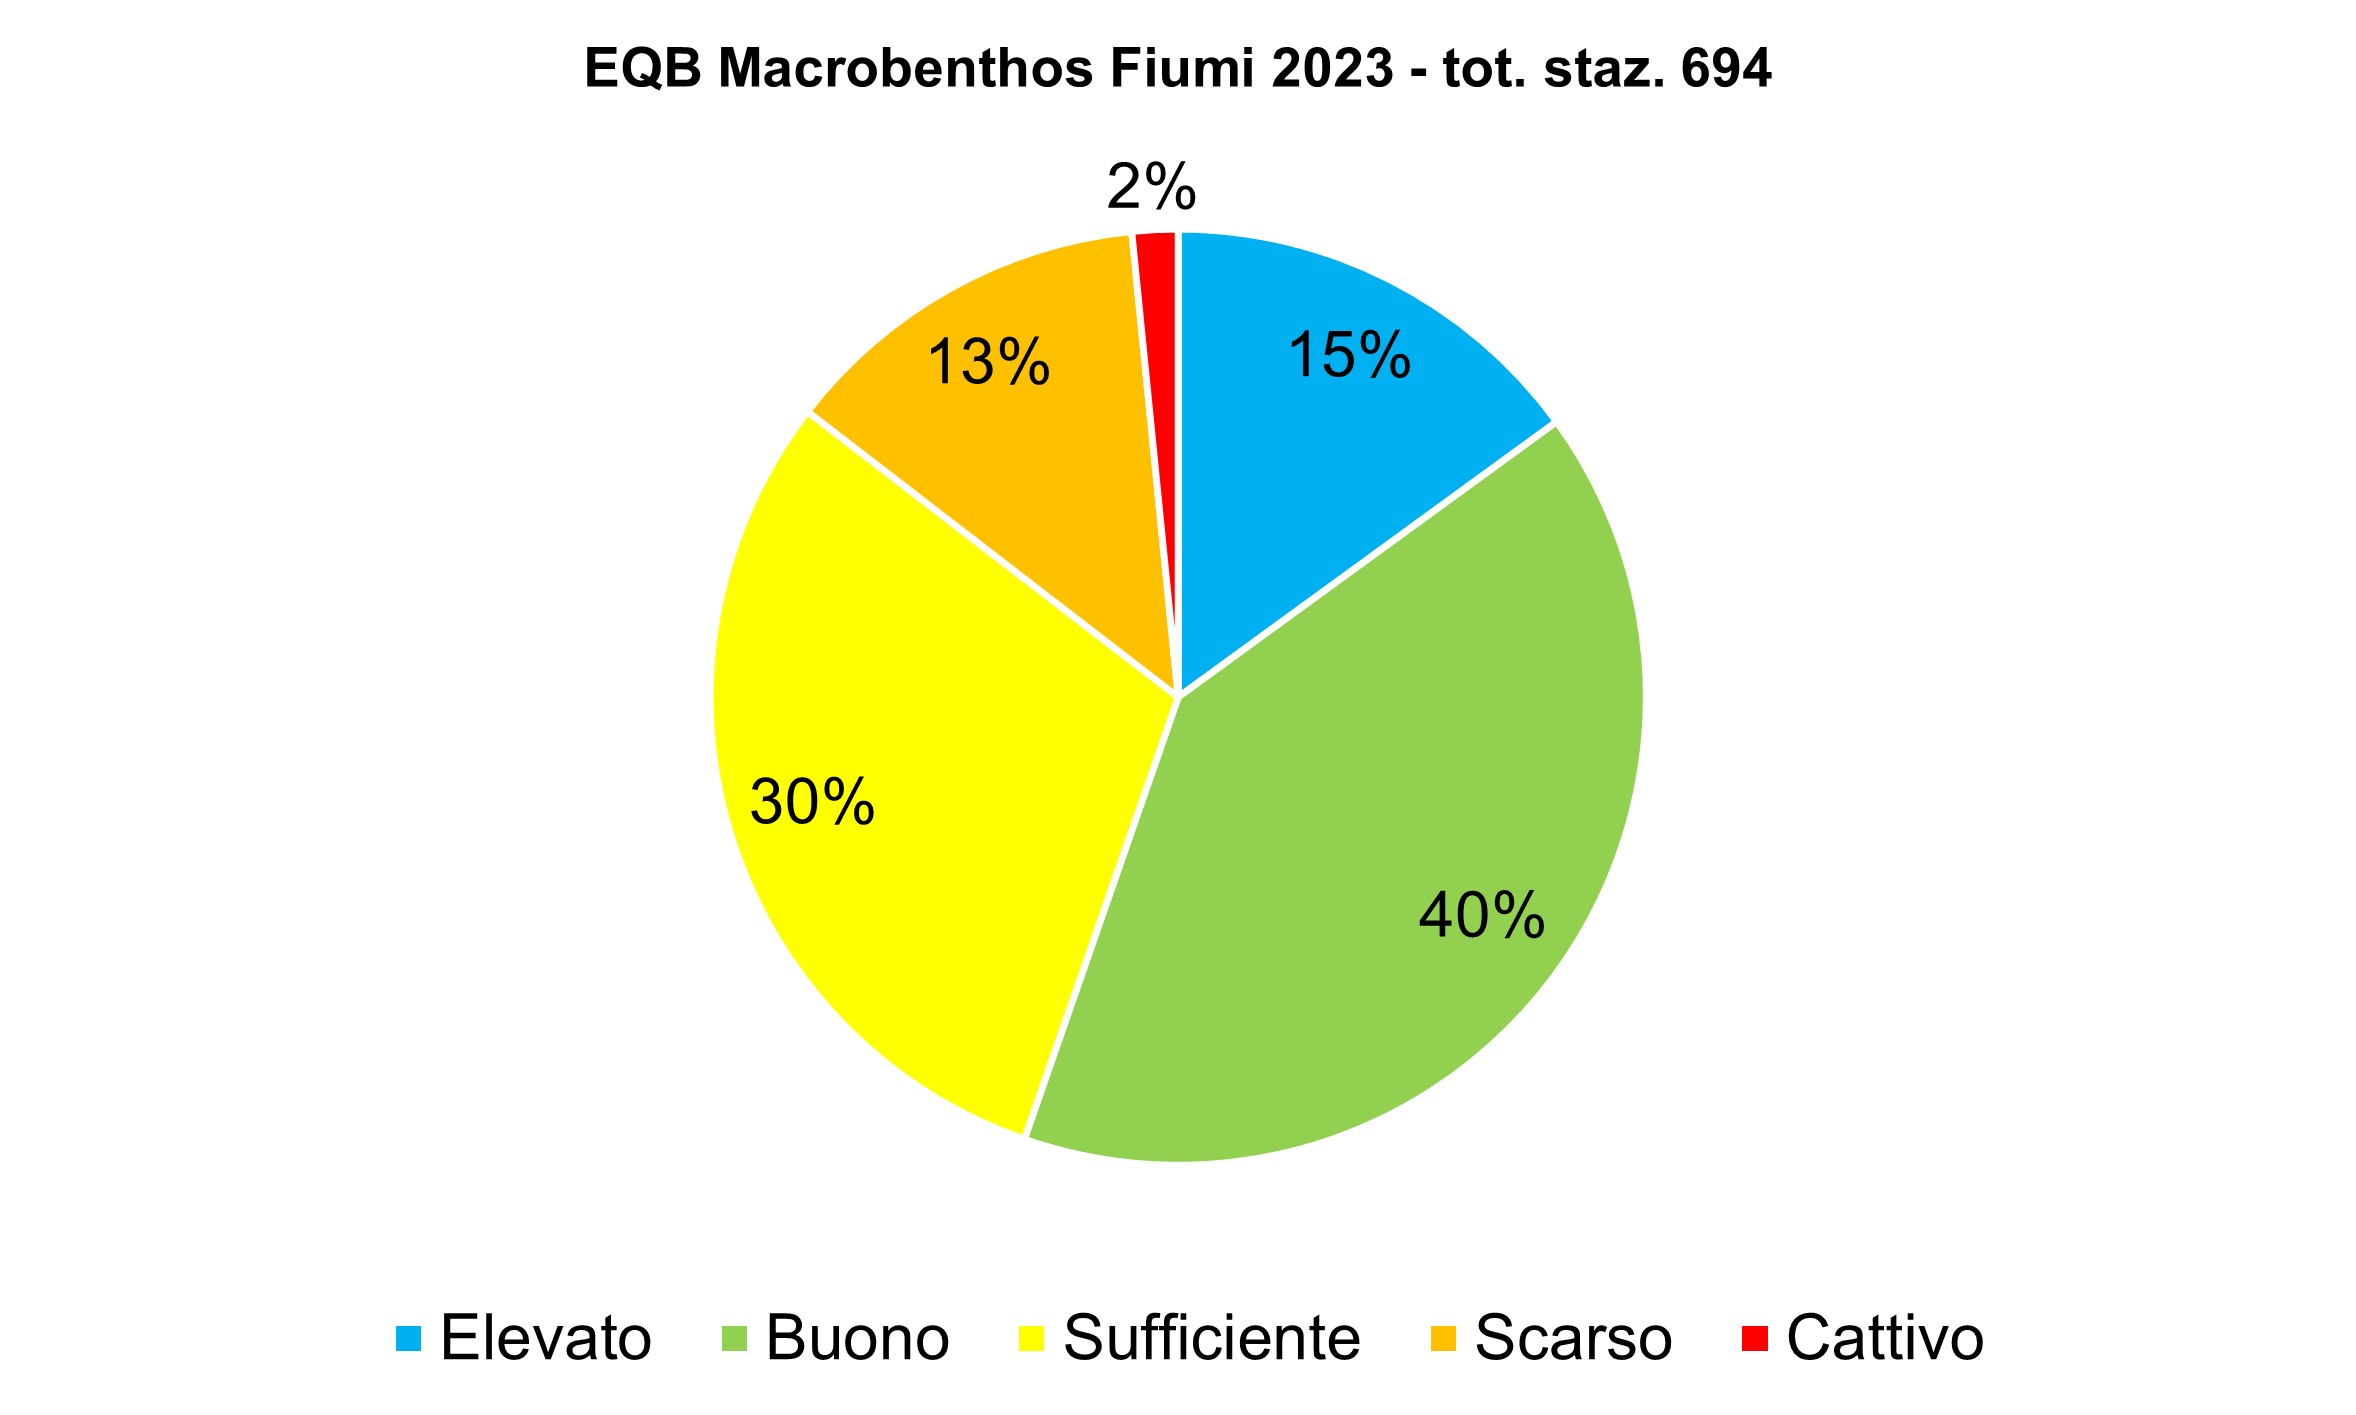
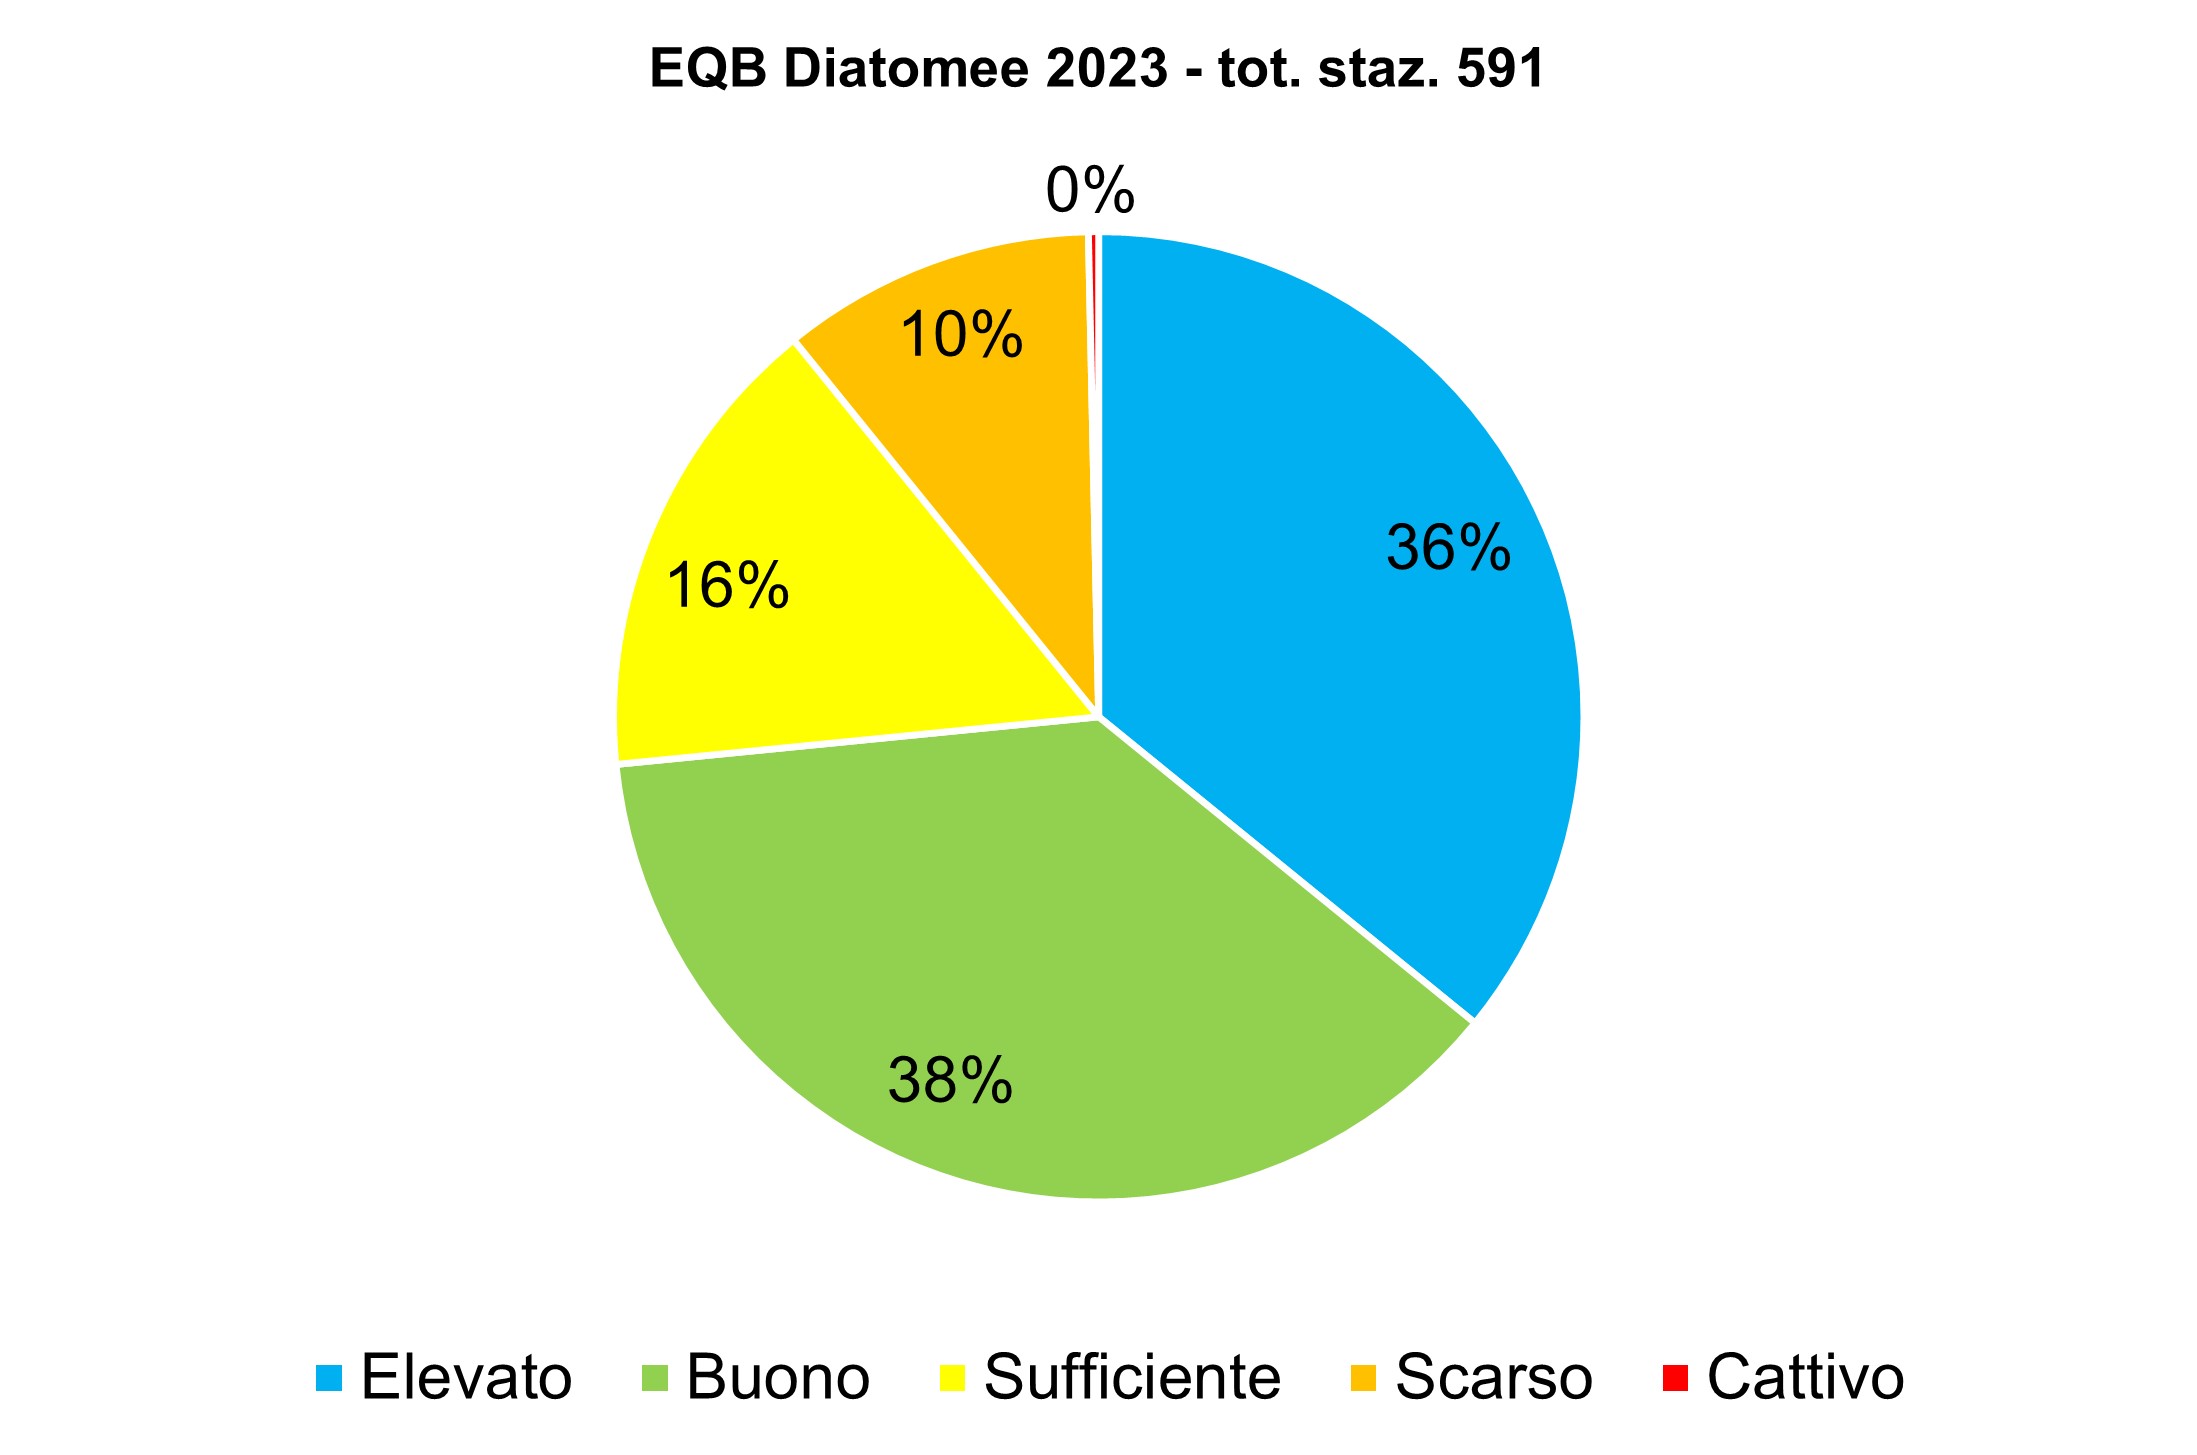
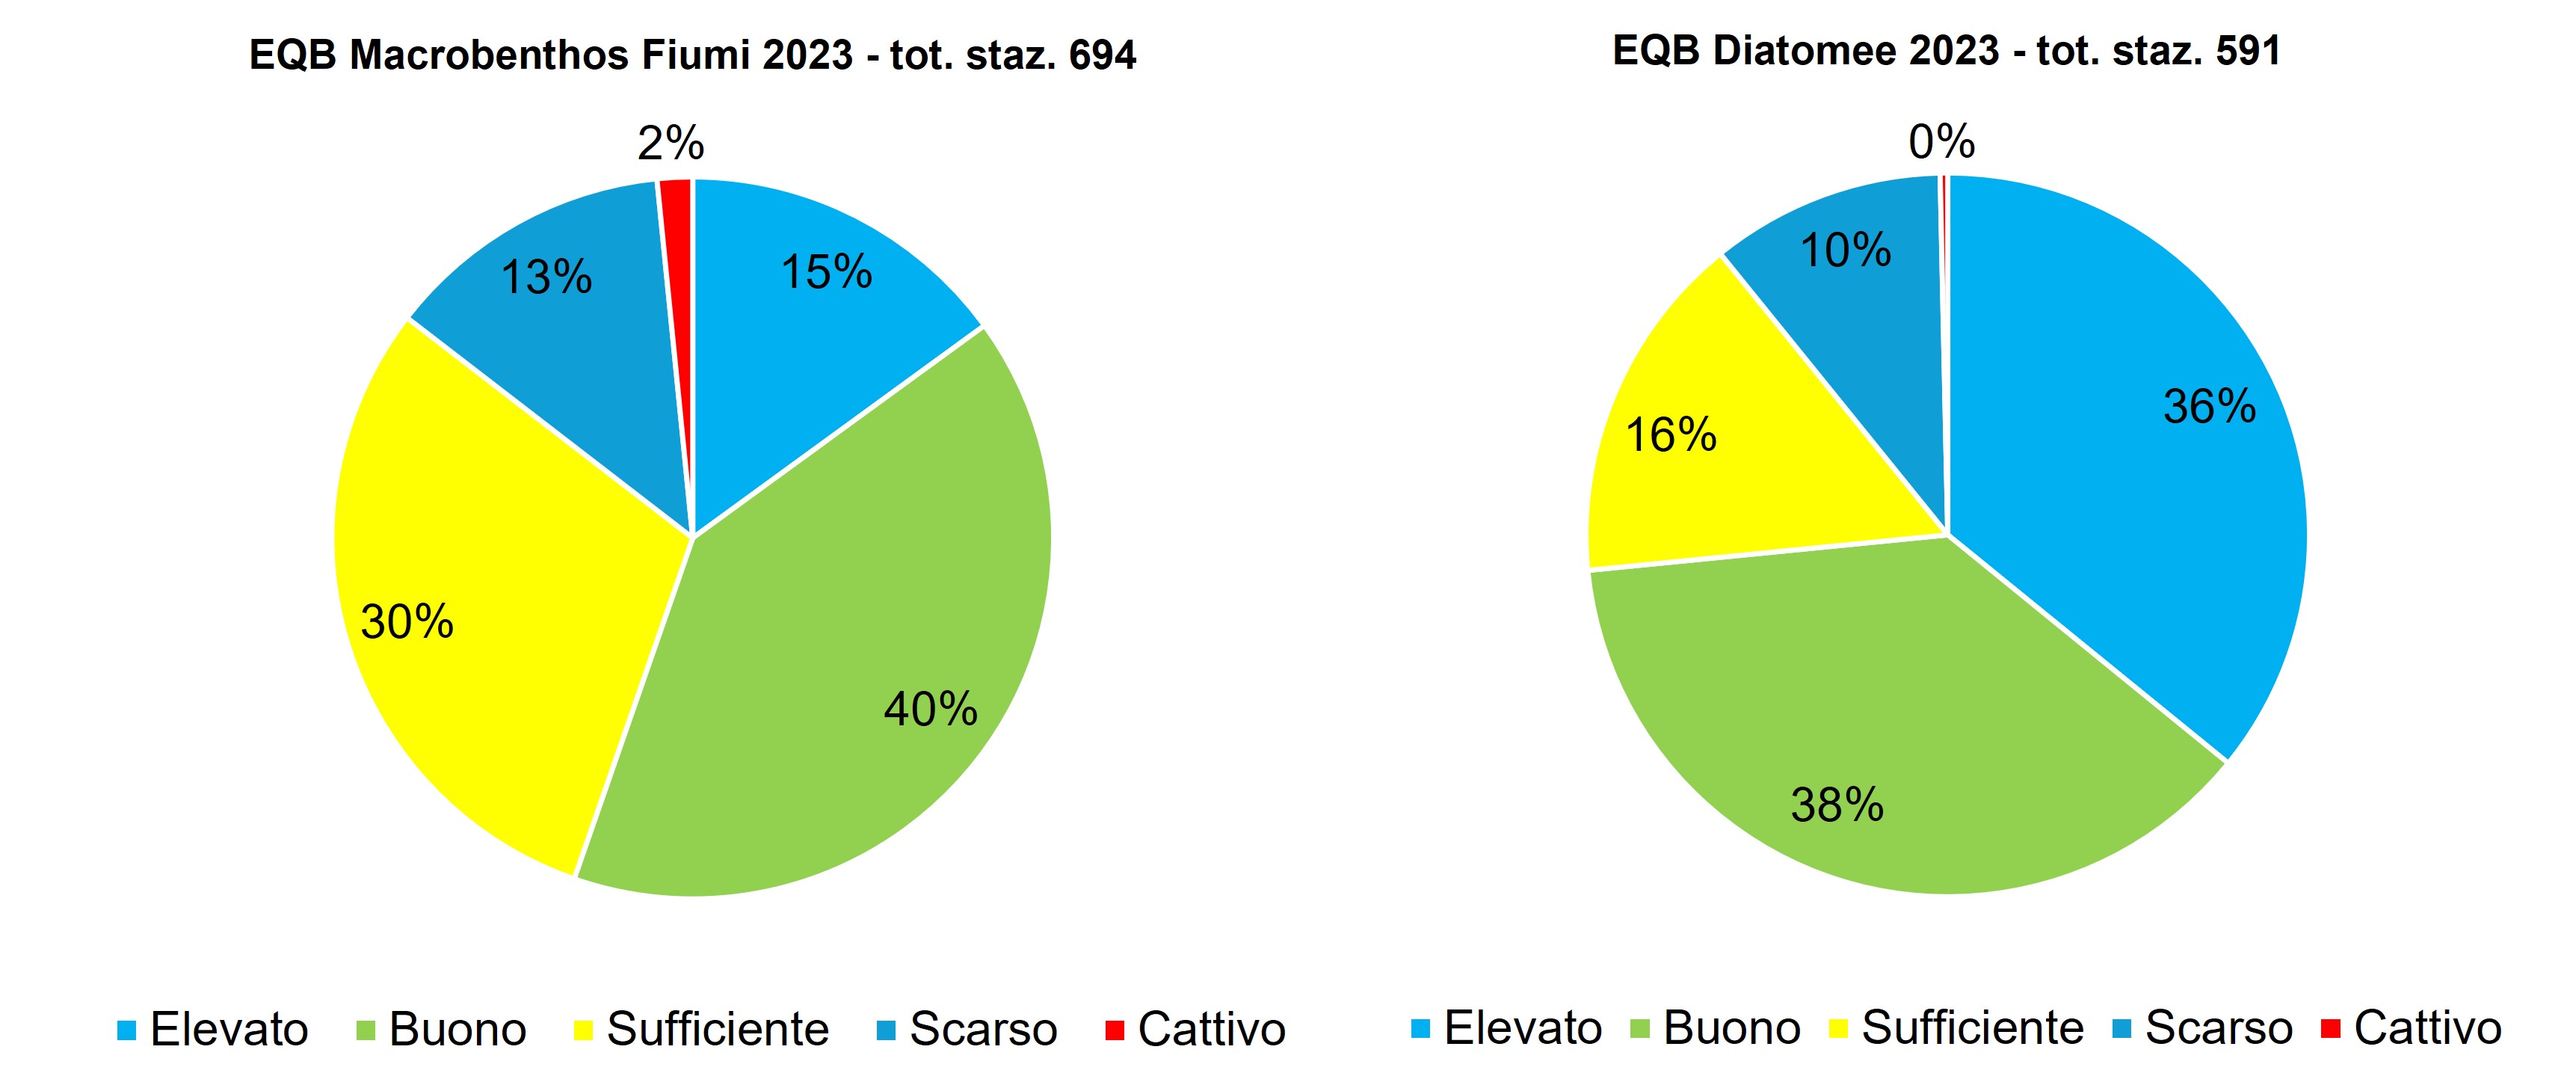
The indicator derives from the application of the reference legislation for the determination of the ecological status of surface water within the meaning of Directive 2000/60/EC. For 2023, as part of the Soe WISE2 data stream, data on 694 monitoring stations for the EQB Macrobenthos were transmitted, which in 55% of them reached the "good or higher" ecological status. In the remaining 45% of the stations there is a state of lower quality than the good. For the EQB Diatomee in 2023, data from 591 monitoring stations were transmitted: in 74% of them there was a "good or higher" ecological status, the remaining 26% has an ecological status lower than the voucher.
The indicator represented derives from the application of the reference legislation for the determination of water quality, which provides for the classification of water bodies through the integration of different indicators, with the timing of validity of the Sensennial Management Plans. The same data is also transmitted annually through the WISE-SoE data stream to the European Environment Agency. The monitoring data transmitted for the WISE-SoE are due pursuant to Regulation (EC) No 401/2009 of the European Parliament and of the Council of 23 April 2009 on the European Environment Agency and the European Environment Information and Observation Network on the Environment. The monitoring data of the sampling stations identified as part of the annual planning are transmitted by ARPA/APPA, such as to complete the spatial monitoring coverage at the end of the six-year cycle. For Macrobenthos, the STAR-ICMi multi-metric index is used based on a series of indicators (sub-indexes) that give information about tolerance, abundance/habitat and community wealth/diversity. For the Diatomee, the ICMi Multimetric Index is applied, which assesses the abundance of species and their sensitivity to pollutants. The ICMi is composed of two indices: the Pollutant Sensitivity Index (IPS) and the Trophic Index (IT). The calculations of the indices for each Organic Quality Element (EQB) must be conducted on a specific-type basis, as required by the legislation. The quality classes for both indices are five and are represented graphically with standard colors: High (blue), Good (green), Sufficient (yellow), Poor (orange), Bad (orange), Bad (red).
It allows to derive the quality class for macrobenthonic organisms and diatomic organisms for the definition of ecological status for river bodies.
Water Framework Directive (2000/60/EC); Legislative Decree 152/06 ss.mm.ii; DM 260/2010.
In accordance with Legislative Decree 152/06 and ss.mm.ii., all river water bodies must achieve the environmental quality objective corresponding to the "good" state by 2015. Article 77 also defines the conditions for the use of extensions or derogations from this obligation. The environmental status of a surface water body is given by the worst between the chemical status and the ecological state, defined as established in Annex 1 to Legislative Decree 152/06 and ss.mm.ii. The classification of ecological status is based on the evaluation of biological quality elements (EQB) and physico-chemicals, chemical (specific pollutants) and hydromorphological elements, as reported in DM 260/2010.
APAT, 2007, Metodi Biologici per le acque. Parte I;
ISPRA - Manuali e Linee Guida 107/2014 - "Linee guida per la valutazione della componente macrobentonica fluviale ai sensi del DM 260/2010”
Macroinvertebrates do not provide adequate answers to all types of stress: they are not sensitive to the effects of herbicides; they do not respond quickly to minor impacts, being adapted to a naturally unstable ecosystem. Furthermore, community analysis does not allow to distinguish between the various types and degrees of stress and to identify the individual pollutant. Finally, the distribution of some taxa can depend on natural factors, regardless of those closely related to the quality of the site: nature of the substrate, temperature, speed of current. The Diatomies have microscopic dimensions that do not allow their identification and analysis with the naked eye, unlike other macroscopic algae. Microscopic recognition at the species level may have difficulties. Responding mainly to changes in the degree of water atrophy, diatoms can provide “overtimes” on the overall quality.
ARPA/APPA (Agenzie Regionali e delle Province Autonome per la Protezione dell'Ambiente)
http://www.sintai.isprambiente.it/faces/public/SOE/index.xhtml (con credenziali)
17 regioni e 2 province autonome
2023
The final multi-memometric index for the Macrobenthos STAR-ICMi is obtained from the sum of the normalized metrics, each of which is multiplied by its own weight. This weight varies between the individual metrics while taking on a single value for the three general categories (tolerance, abundance/habitat, wealth/diversity). After the calculation of the weighted average of the metrics, the resulting values are normalized on the median value of STAR-ICI observed for the reference sites. For each monitored biological component, the result of RQE (ratio between the value of the index found at the site and the value of the index relative to the reference conditions) is compared with the threshold values reported in the DM Ambiente 260/2010 corresponding to the 5 ecological status classes provided for each monitored component. The final multi-memometric index for the ICM Diatomies is based on the identification and counting of 400 individuals. The final formula is ICMi (EQR-IPS + EQR-TI)/2. For diatoms, as well as for each biological component monitored, in fact, the result of RQE (ratio between the value of the index found in the site and the value of the index relative to the reference conditions) is compared with the threshold values of DM 260/2010 corresponding to the 5 ecological status classes provided for each monitored component.
Compliance with regulatory objectives can only be assessed with the classification data of water bodies at the end of each six-year monitoring cycle. In 2023, the status of the EQB Macrobenthos of 694 monitoring stations was transmitted. The objective of "good or higher" environmental quality was achieved in 55% of them (15% in high state and 40% in good condition). With reference to the EQB Diatomee, of the 591 monitoring stations transmitted, 74% of them reach the environmental quality target "good or higher" (36% in high state and 38% in good condition).
-
| Data |
|---|
Headline
Table 1: Number of monitoring stations transmitted by autonomous regions/provinces - EQB Rivers (2023) Data source
ISPRA processing on data data transmitted by ARPA/APPA for Wise 2 |
Headline
Table 2: Number of autonomous region/province stations and for quality classes - EQB Macrobenthos Rivers (2023) Data source
ISPRA processing on data transmitted by ARPA/APPA for Wise 2 data stream Data legend
Quality Classes: 1 High, 2 Good, 3 Sufficient, 4 Poor, 5 Bad |
Headline
Table 3: Number of autonomous region/province stations and quality classes - EQB Diatomee Rivers (2023) Data source
ISPRA processing on data transmitted by ARPA/APPA for WISE 2 data stream Data legend
Quality Classes: 1 High, 2 Good, 3 Sufficient, 4 Poor, 5 Bad |
Thumbnail
Headline
Figure 1: Percentage distribution by quality classes - EQB Macrobenthos Rivers (2023) Data source
ISPRA processing on data transmitted by APRA/APPA for WISE 2 data stream |
Thumbnail
Headline
Figure 2: Percentage distribution by quality classes - EQB Diatomee Rivers (2023) Data source
ISPRA processing on data transmitted by ARPA/APPA for WISE 2 data stream |
Thumbnail
Headline
EQB Rivers - Quality Classes (2023) Data source
Ispra processing on data transmitted by ARPA/APPA for WISE 2 data stream |
The number and distribution of the monitoring points transmitted in recent years by the different regions are heterogeneous, as they are dependent on the respective Monitoring Plans, which must be completed during the six-year cycle provided for by the Management Plans. However, it should be noted that some regions have not transmitted data for several consecutive years, or have sent an extremely limited number of monitoring points. This inhomogeneity undermines the completeness of information at national level, hampering an integrated environmental status assessment.
ARPAs monitor the internal surface water bodies (rivers and lakes) for the determination of the ecological status under Directive 2000/60/EC; monitoring is distinguished in surveillance, operational and investigation according to specific purposes and objectives. With reference to biological quality elements (EQB), the monitoring programs differ in duration, the choice of EQBs to be monitored and frequency of the measurements; therefore, in the period of the reference se years for the classification of water bodies, within the period of validity of the management plan, the water bodies to be monitored and then chosen the monitoring stations are identified, with an annual programming. It follows that the comparability of the quality status data of EQBs is guaranteed at the end of each six-year cycle. The data transmitted by ARPA/APPA in the context of the WISE 2 data stream, for rivers, concern the EQB Macrobenthos, Diatomee and Pisces referring to the monitoring carried out in 2023; in particular, 17 regions and 2 autonomous provinces transmitted data referring to the EQB Macrobenthos, 15 regions and 2 autonomous provinces transmitted monitoring data referring to the EQB. The latter monitoring is the least represented by the spatial point of view, however, there has been an increase over the years in the years of the regions that submit data. With reference to the EQB Macrobenthos (Table 2, Figure 1), it is noted that the “good or higher” state represents 55% of the monitored water bodies, for a total of 387 monitoring stations respectively. The remaining of the monitored stations has a state of lower quality than good (45%). With reference to the EQB Diatomee (Table 3, Figure 2), it is noted that the “good or higher” state represents 74% of monitoring stations, for a total of 434 monitoring stations respectively. The remaining of the monitored stations has a quality status that is lower than good (26%). The diversity of results on the award of quality classes comes from the different environmental stresses to which the two EQBs respond.
Table 1 also shows the other EQBs monitored under the Water Directive, even if not transmitted within the SOE Wise2 flow. These data have been requested from 2021 monitoring and although there is an increase compared to previous years, they are not yet representative of the national context.