Giovanni Braca, Barbara Lastoria
The indicator provides the evaluation, expressed in mm, of the height of water, summarised to the surface of the national territory, which precipitates to the ground (both in liquid and solid form) for each month and for the entire year.
The indicator for 2024 shall be compared, for each month of the year, with the corresponding average values for the period 1951–2024 obtained by the same methodology. In 2024 the value of total annual rainfall in Italy was 1,055.5 mm (318.8 billion cubic meters), greater than 10% of the corresponding long-term average value (LTAA-Long-Term Annual Average) and about 8% compared to the annual average over the last thirty years of the climate 1991-2020.
Going down to the regional and district level, the situation is very diversified, with Northern Italy being affected in 2024 by quantities of precipitation higher than the long-term averages. On the other hand, the precipitation anomaly compared to the LTAA was negative in the Center and the South and the larger islands.
It is a state indicator that measures the volumes of water flowing into the national territory through the spatial interpolation of the rains measured by rain meters. The rains measurement is mainly carried out by the regional structures in the peripheral offices of the National Hydrographic and Tire Service (SIMN), according to standards and procedures regulated by the World Meteorological Organization (WMO), transposed by the SIMN in the notebook "Technical standards for the collection and processing of hydromeal data - part I". The precipitation measures are also carried out by the Air Force, other regional structures and the managers of agrometeorological networks.
The precipitation assessment on the regular grid was carried out by spatial interpolation of the monthly precipitation values detected by more than 2,500 pluviometric stations, not evenly distributed throughout the national territory.
The knowledge of meteoric inflows on a monthly scale is necessary to carry out the hydrological balance aimed at the management of water resources and for the study and prevention of extreme hydrological drought events. It is also necessary, more generally, for the climatic characterization of a territory.
La normativa vigente non fissa obiettivi ambientali specifici.
Le norme di riferimento per lo svolgimento del monitoraggio sono:
- Legge 267/98, recante "Conversione in legge, con modificazioni, del decreto-legge 11 giugno 1998, n. 180, recante misure urgenti per la prevenzione del rischio idrogeologico ed a favore delle zone colpite da disastri franosi nella regione Campania" (G.U. Serie Generale n. 183 del 7 agosto 1998);
- D.Lgs. 152/06, recante "Norme in materia ambientale" (G.U. Serie Generale n. 88 del 14-04-2006 - Suppl. Ordinario n. 96), che recepisce la Direttiva Quadro sulle Acque 2000/60/CE;
- D.Lgs. 49/2010, recante "Attuazione della Direttiva 2007/60/CE relativa alla valutazione e alla gestione dei rischi di alluvioni" (G.U. Serie Generale n. 77 del 02.04.2010);
- European Water Resilience Strategy, adottata dalla Commissione Europea il 4 giugno 2025.
- Braca, G., Mariani, S., Lastoria, B., Tropeano, R., Casaioli, M., Piva, F., Marchetti, G., e Bussettini, M., 2024: Bilancio idrologico nazionale: stime BIGBANG e indicatori sulla risorsa idrica. Aggiornamento al 2023. Rapporti n. 401/2024, ISPRA, Roma. Disponibile online all’indirizzo: https://www.isprambiente.gov.it/it/pubblicazioni/rapporti/bilancio-idrologico-nazionale-stime-bigbang-e-indicatori-sulla-risorsa-idrica-aggiornamento-al-2023.
- Braca, G., Mariani, S., Lastoria, B., Piva, F., Archi, F., Botto, A., Casaioli, M., Forte, T., Marchetti, G., Peruzzi, C., Tropeano, R., Vendetti, C., e Bussettini, M., 2023: Bilancio idrologico nazionale: focus su siccità e disponibilità naturale della risorsa idrica rinnovabile. Aggiornamento al 2022. Rapporti n. 388/2023, Roma. Disponibile online all’indirizzo: https://www.isprambiente.gov.it/it/pubblicazioni/rapporti/bilancio-idrologico-nazionale-focus-su-siccita-e-disponibilita-naturale-della-risorsa-idrica-rinnovabile-aggiornamento-al-2022.
- Braca, G., Bussettini, M., Lastoria, B., Mariani, S., e Piva, F., 2021: Il Bilancio Idrologico Gis BAsed a scala Nazionale su Griglia regolare – BIGBANG: metodologia e stime. Rapporto sulla disponibilità naturale della risorsa idrica. Rapporti n. 339/21, Roma. Disponibile online all’indirizzo: https://www.isprambiente.gov.it/it/pubblicazioni/rapporti/il-bilancio-idrologico-gis-based-a-scala-nazionale-su-griglia-regolare-bigbang.
- Mariani, S., Braca, G., Lastoria, B., Tropeano, R., Casaioli, M., Piva, F., Bussettini, M., 2024: “Il bilancio idrologico, la disponibilità di risorsa idrica e il bilancio idrico”, in Siccità, scarsità e crisi idriche, Emanuele Romano, Ivan Portoghese (a cura di), Habitat signa 1, 29-46. Roma: Cnr Edizioni. Disponibile online all'indirizzo: https://www.cnr.it/sites/default/files/public/media/attivita/editoria/SiccitaInterattivo_ver2.pdf.
- Servizio Idrografico e Mareografico Nazionale, 1997: Norme tecniche per la raccolta e l’elaborazione dei dati idrometeorologici, Roma.
- Servizio Idrografico e Mareografico Nazionale, 1970: Pubblicazione n. 17, Roma.
- Servizio Idrografico e Mareografico Nazionale - Annali Idrologici.
- WMO, 2008: Guide to Hydrological Practices, Volume I. Hydrology – From Measurement to Hydrological Information, WMO-No. 168, Geneva.
The indicator is estimated on the basis of a set of rainforest stations that could be not homogeneously distributed on the territory and whose number could be different from one year to another. Such circumstances, together with the different spatial estimation method used, suggest special attention and caution when comparing the indicator in space and time.
No further action.
ISPRA
Regional hydro-meteorological services and autonomous provinces
The precipitation data used are mostly those collected and published by the regional and provincial structures to which, according to Article 92 of Legislative Decree no. 112 of 31 March 1998, the functions and tasks of the peripheral offices of the National Hydrographic and Tire Service (SIMN, now merged into ISPRA) of the Department for National Technical Services, were transferred. The precipitation data used in the processing of the indicator shall be accessible by consulting the websites of the institutions or through appropriate request. The data are aggregated to the monthly scale on the regular grid of the 1 km resolution BIGBANG, which covers the entire national territory, and is available on the Groupware portal of ISPRA at the address: https://groupware.sinanet.isprambiente.it/bigbang-data/library/bigbang_90.
National
1951–2024
The calculation of the indicator is developed from the assessment of precipitation on a regular grid of resolution 1 km, which covers the entire national territory, carried out on the basis of the values detected by the pluviometric monitoring stations.
The spatial interpolation method used is the Natural Neighbor, as well as implemented in the BIGBANG-Billion Cycle Gis BAsed model at National Scale on Regular Grid, 9.0 version, developed and implemented in GIS environment by ISPRA.
At the national level, the value of the total annual precipitation of 2024 was higher than the average of the period. This means a greater availability of renewable water resources.
The percentage anomaly of precipitation throughout the country for the year 2024 was about 11%, compared to the long-term 1951–2024 average. The increase is attributable to precipitation surplus recorded in the North.
It is not found, through the Mann-Kendall test, any statistically significant trend at 5%, of the total annual value of precipitation in the period 1951–2024.
| Data |
|---|
Thumbnail
Headline
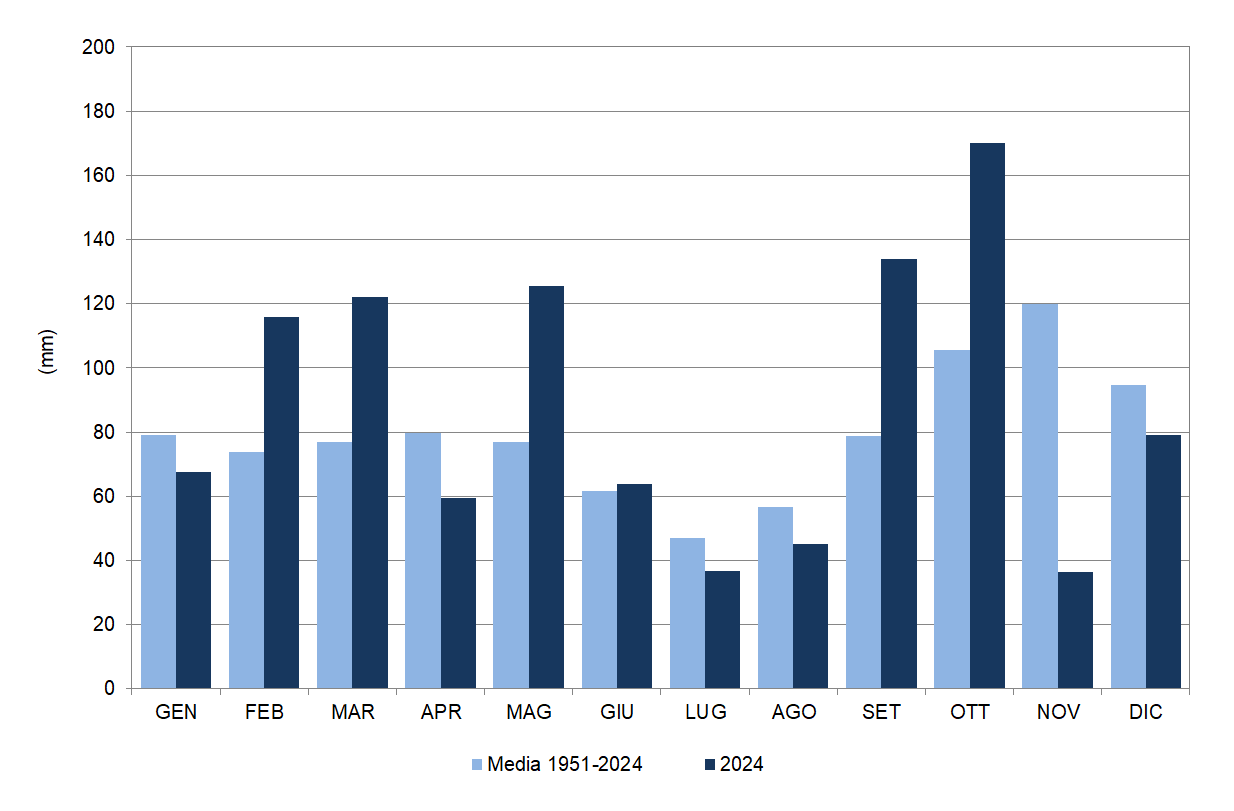
Figure 1: Monthly precipitation height, as concurrence to the national territory for 2024 and the average period 1951–2024 Data source
ISPRA elaboration on data from regional hydro-meteorological offices and autonomous provinces and on historical data of the Suppressed SIMN |
Thumbnail
Headline
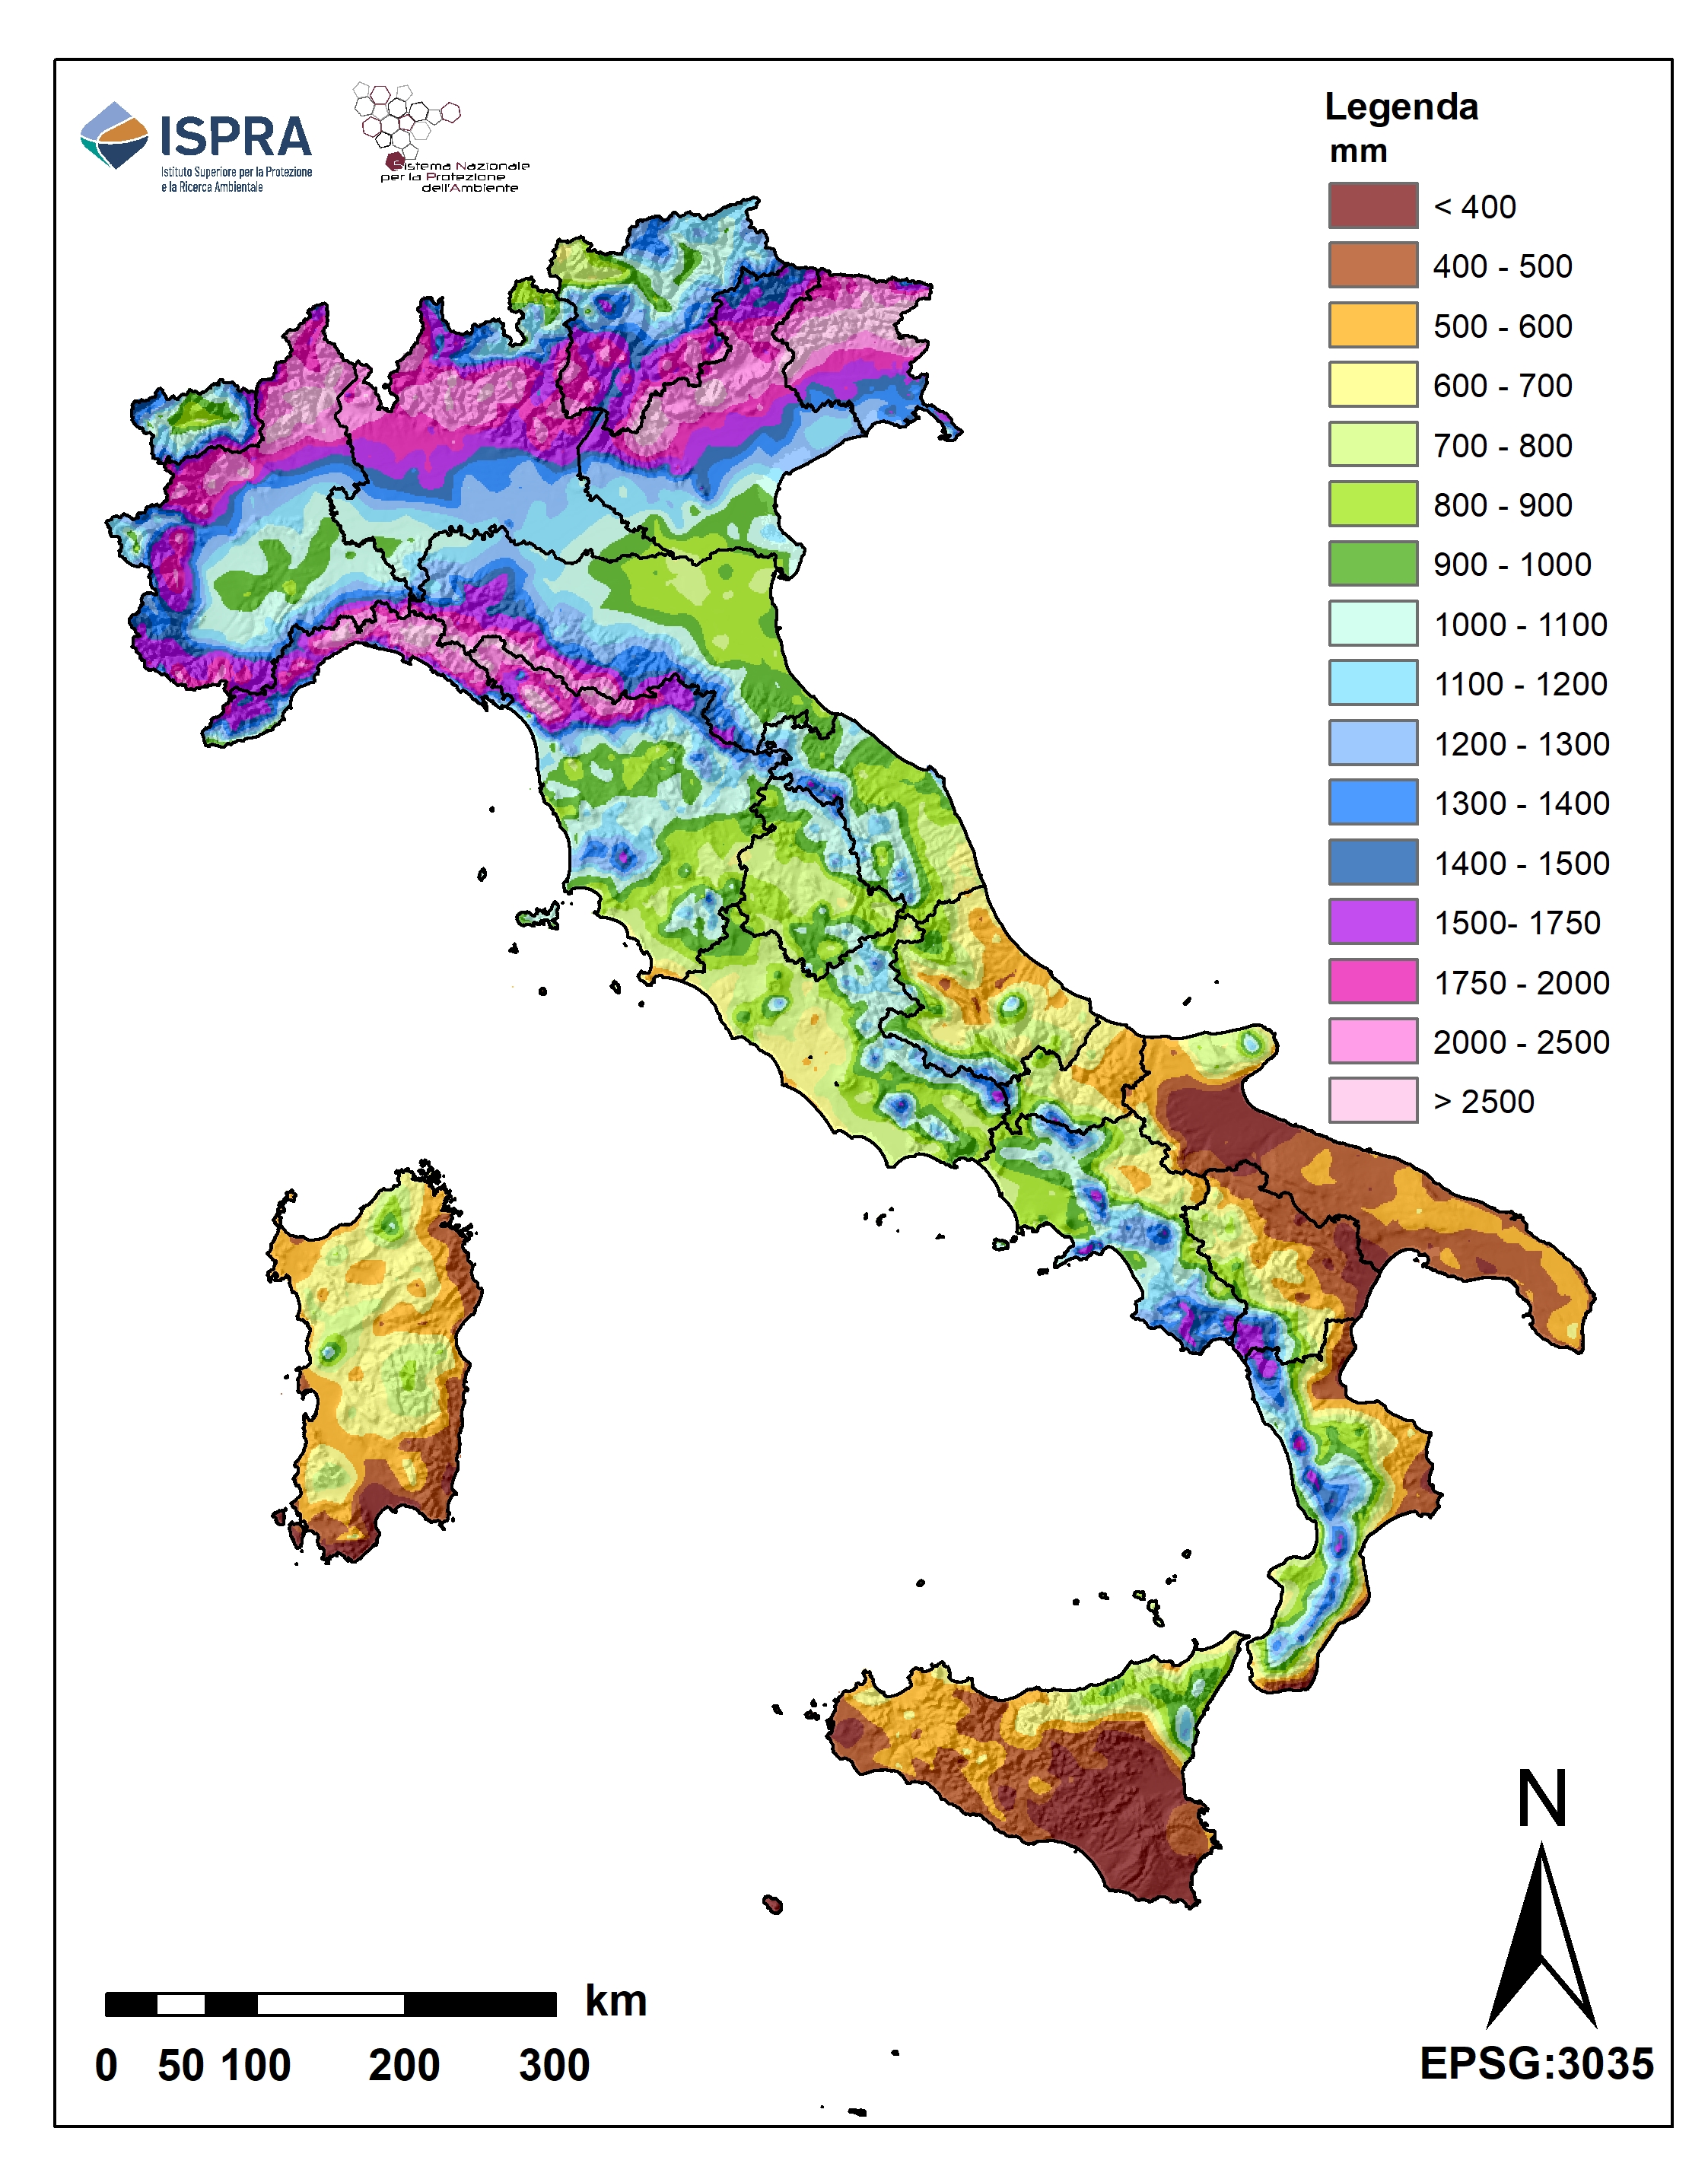
Figure 2: Space distribution of the annual precipitation height for 2024 Data source
ISPRA elaboration on data from regional hydro-meteorological offices and autonomous provinces and on historical data of the Suppressed SIMN |
Thumbnail
Headline
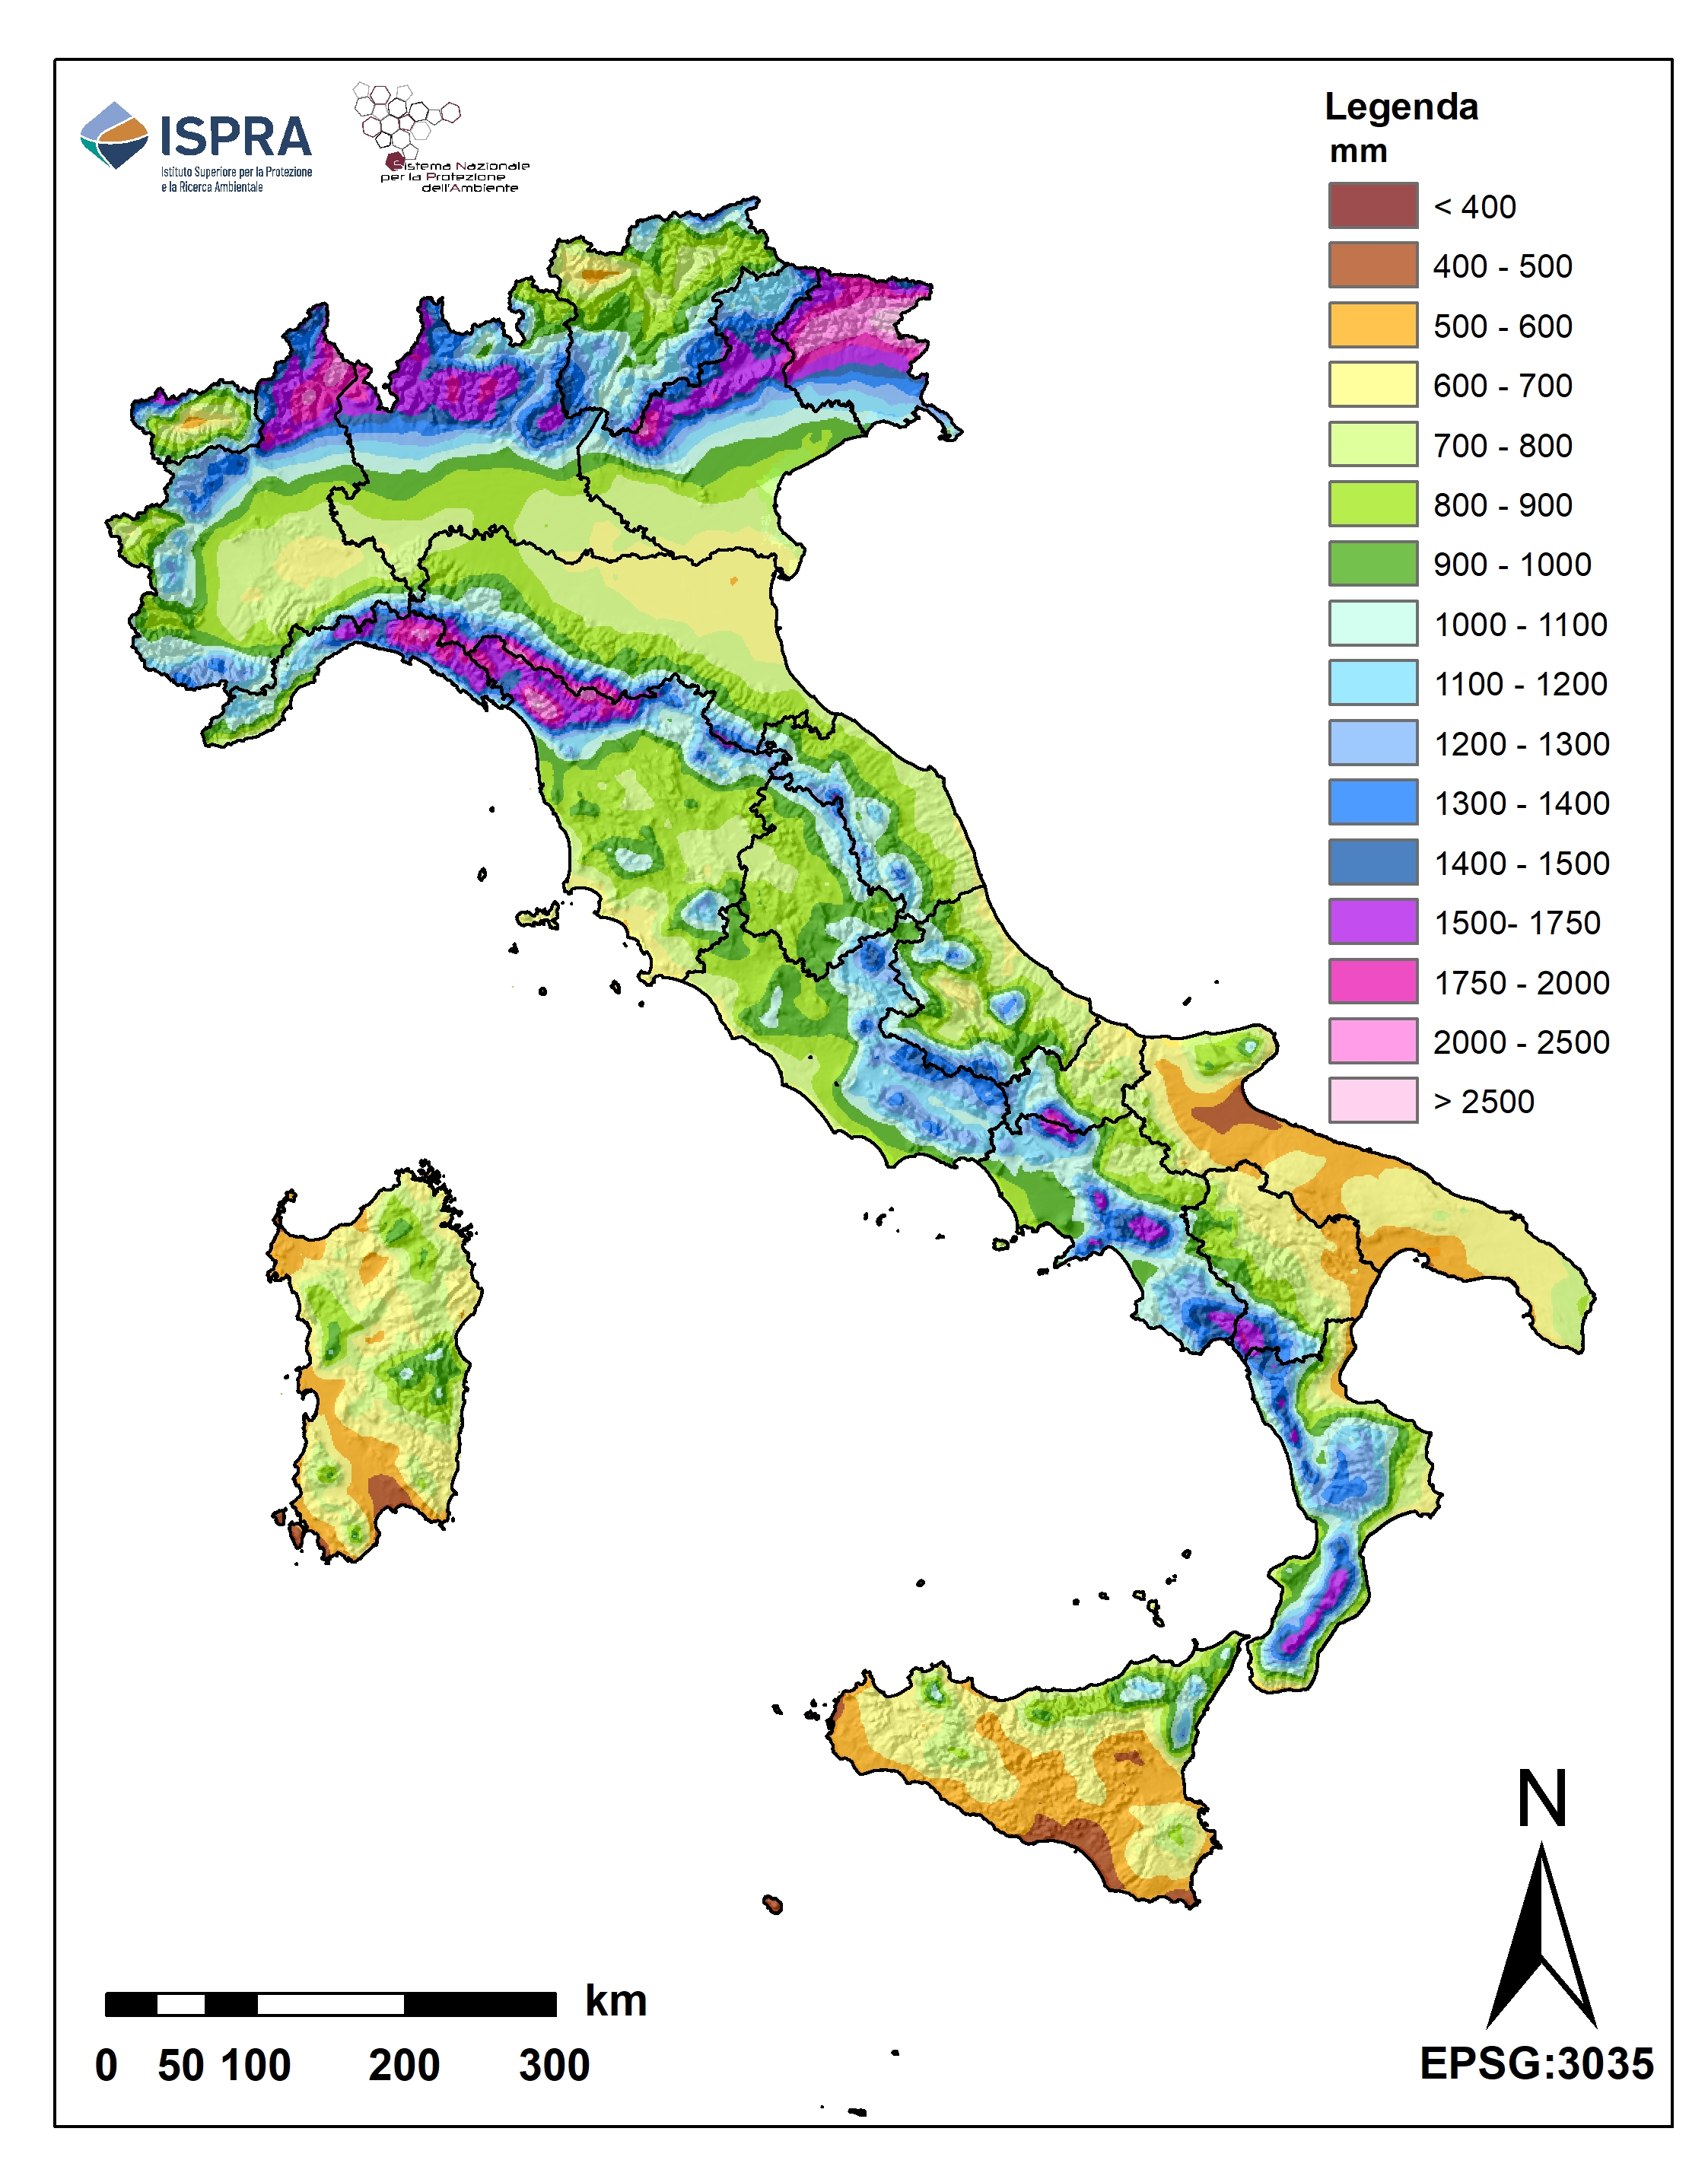
Figure 3: Spatial distribution of average annual precipitation height over the long term (LTAA, 1951–2024) Data source
ISPRA elaboration on data from regional hydro-meteorological offices and autonomous provinces and on historical data of the Suppressed SIMN |
Thumbnail
Headline
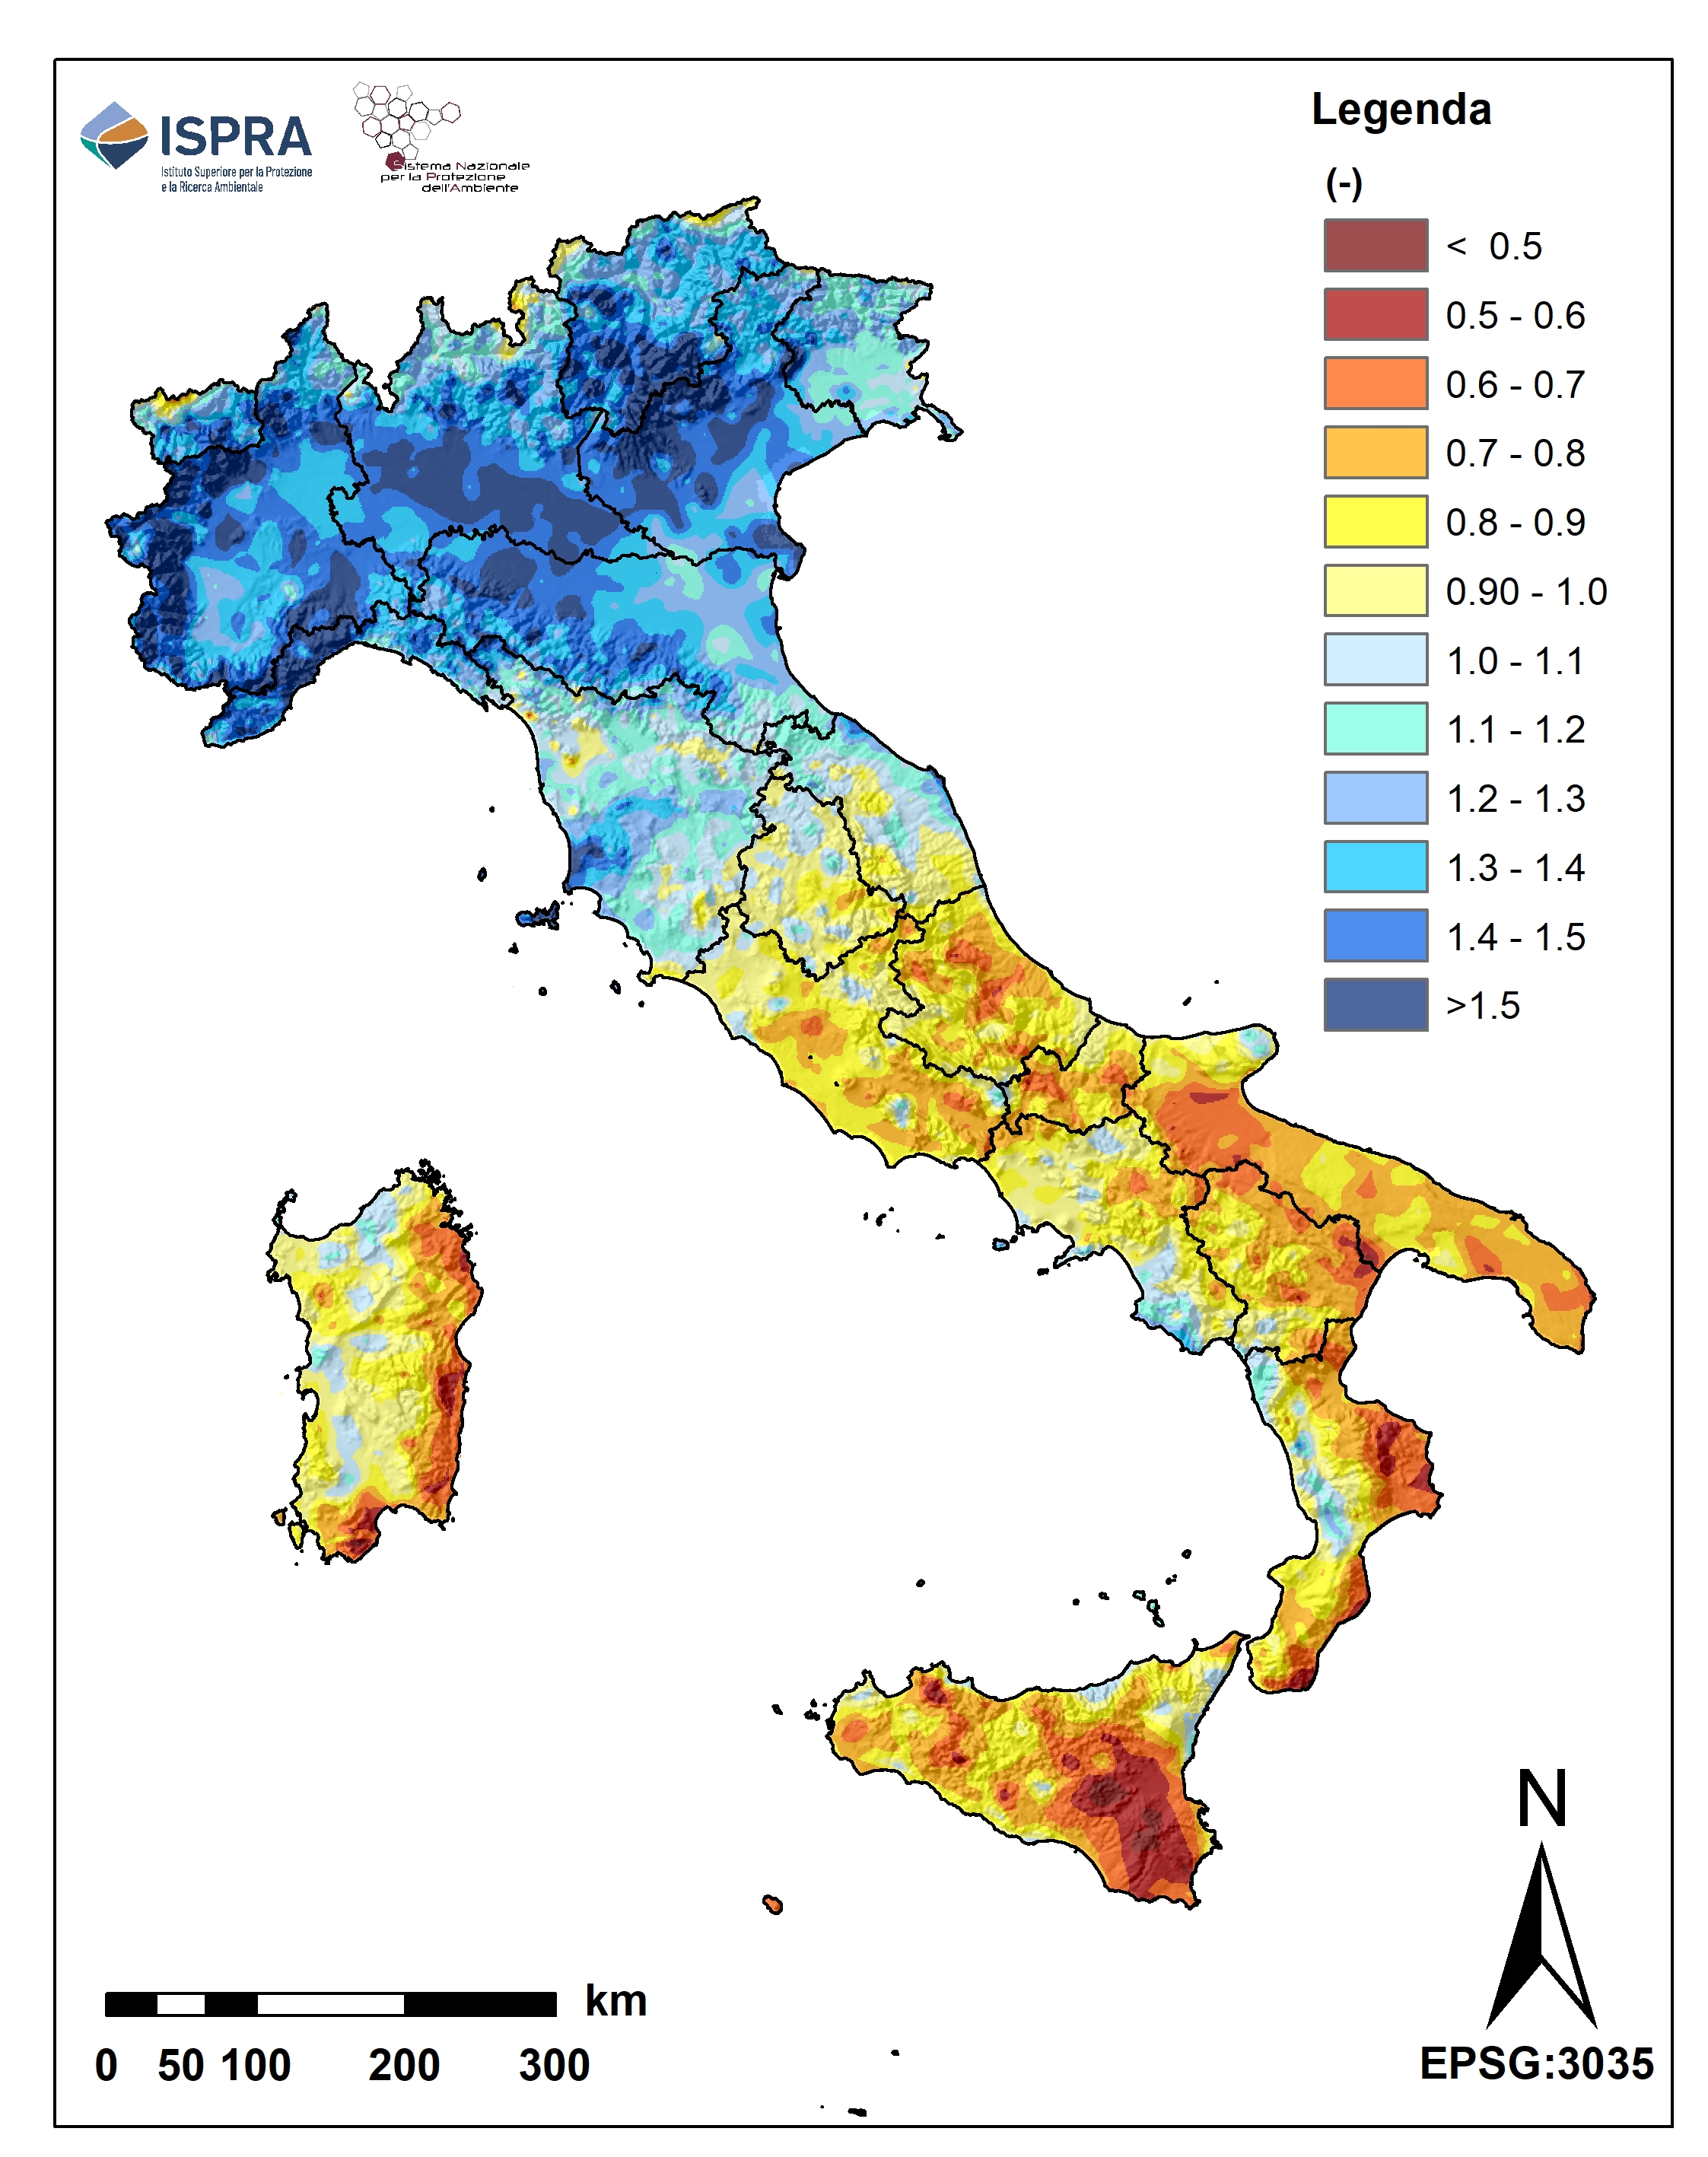
Figure 4: Ratio between the annual precipitation height of 2024 and the average height of the period 1951–2024 Data source
ISPRA elaboration on data from regional hydro-meteorological offices and autonomous provinces and on historical data of the Suppressed SIMN |
Headline
Dati per Figura 1 Data source
Elaborazione ISPRA su dati degli uffici idro-meteorologici regionali e delle province autonome e su dati storici del soppresso SIMN |
Estimates of 2024 monthly and annual precipitation are compared with their LTAA-Long-Term Annual Average (LTAA-Long-Term Annual Average) with the same methodology.
The 2024 was characterized, overall at the national level, by a surplus of precipitation. However, the value of a positive anomaly was determined by the precipitation access that affected northern Italy while the Center and the South and the larger islands suffered a considerable precipitation deficit, with severe and extreme drought conditions and consequent problems of water resource availability (see the indicators "hydrological drought", "Standardized hydro-climatic balance" and "Percentage of the Italian territory subject to precipitation deficit and surplus" present in the Environmental Theme "Water sources and Balance" of the Environmental Indicators Database). The total annual precipitation for the national territory for 2024 was estimated at 1,055.5 mm (318.8 billion cubic meters), compared to an average (1951–2024) estimated at 95.0 mm (287.3 billion cubic meters). The percentage anomaly compared to the LTAA average for the period 1951–2024, recorded throughout the national territory, was therefore +11%.
If the annual total of precipitation in 2024 deviated by +11% compared to the long-term average, very different were the deviations of the monthly rainfall of the same year compared to the corresponding average values for the period 1951–2024. As can be seen from Figure 1, in the months of February, March, May, June, September and October, the monthly precipitation was higher than the monthly reference average, calculated over the long term, while in the other months it was lower with a minimum in November with –70%. The month of September recorded a 70% higher precipitation than the average one. The spatial distribution of annual precipitation on the national territory in 2024 (Figure 2) was also different from the long-term average (Figure 3).
The ratio of precipitation of 2024 to the long-term average shows in 2024 a country divided in half with a high surplus of precipitation that affected Northern Italy with values above 1.5 and a high precipitation deficit that affected the Center and the South and the Islands with higher values locally even less than 0.5 which means less than half of the average annual precipitation (Figure 4).
Sicily was the region most affected by the precipitation deficit (510.4 mm), with a negative anomaly of –25% compared to the annual average calculated over the long term (644.5 mm). Apulia followed, with an annual deficit of precipitation of the order of –23% compared to the LTAA, and Molise and Basilicata with a deficit of the order of –20%. Piedmont, Veneto and Liguria were the regions that in 2024 saw an annual precipitation surplus of more than 40%, compared to the long-term average.
The indicator is forwarded to the European Environmental Agency as part of the WISE-SoE (Water Information System for Europe-State of Environment) data stream.