Giovanni Braca, Robertino Tropeano
The indicator provides, for each month and for the entire year, the evaluation of the monthly and annual cumulative water height, expressed in mm, in detail to the surface of the national territory, which infiltrates deep into the soil as a result of rainfall.
In 2024, the value of the annual total of the infiltration estimated at 226.8 mm, corresponding to 68.5 billion cubic meters, was slightly higher than the average of the period 1951, 2024 estimated at 216.1 mm, corresponding to 65.3 billion cubic meters.
Deep infiltration is the rate of precipitation that, crossing the surface layer of the soil, feeds groundwater (aquifer recharge or groundwater recharge). An rate of water of precipitation that infiltrates, through underground circulation, returns to the surface as the basic runoff of the waterways while the other rate is discharged directly into the sea in depth. The supply of groundwater is regulated by multiple factors such as topographic exposure, vegetation, soil nature, lithology, intensity and frequency of rains.
The infiltration assessment shall be carried out using the ISPRA BIGBANG hydrological balance model on the basis of the potential infiltration coefficient (CIP) associated with hydrogeological complexes. This assessment is forwarded to the European Environmental Agency (Water Information System for Europe-State of Environment) in the context of the WISE-SoE (Water Information System for Europe-State of Environment) data stream.
Provide, as part of the estimation of the available or potential water resource, an assessment of the amount of water that infiltrates the subsoil and which constitutes an important rate of renewable water resource.
Existing legislation does not set specific environmental targets.
- Braca, G., Mariani, S., Lastoria, B., Tropeano, R., Casaioli, M., Piva, F., Marchetti, G., e Bussettini, M., 2024: Bilancio idrologico nazionale: stime BIGBANG e indicatori sulla risorsa idrica. Aggiornamento al 2023. Rapporti n. 401/2024, ISPRA, Roma. https://www.isprambiente.gov.it/it/pubblicazioni/rapporti/bilancio-idrologico-nazionale-stime-bigbang-e-indicatori-sulla-risorsa-idrica-aggiornamento-al-2023
- Braca, G., Bussettini, M., Gafà, R.M., Monti, G.M., Martarelli, L., Silvi, A., and La Vigna, F., 2022: The Nationwide Water Budget Estimation in the light of the New Permeability Map of Italy. Acque Sotterranee–Italian Journal of Groundwater, 11(3), 31–39. https://doi.org/10.7343/as-2022-575.
- Braca, G., Mariani, S., Lastoria, B., Piva, F., Archi, F., Botto, A., Casaioli, M., Forte, T., Marchetti, G., Peruzzi, C., Tropeano, R., Vendetti, C., e Bussettini, M., 2023: Bilancio idrologico nazionale: focus su siccità e disponibilità naturale della risorsa idrica rinnovabile. Aggiornamento al 2022. Rapporti n. 388/2023, Roma https://www.isprambiente.gov.it/it/pubblicazioni/rapporti/bilancio-idrologico-nazionale-focus-su-siccita-e-disponibilita-naturale-della-risorsa-idrica-rinnovabile-aggiornamento-al-2022.
- Braca, G., Bussettini, M., Lastoria, B., Mariani, S., e Piva, F., 2021: Il Bilancio Idrologico Gis BAsed a scala Nazionale su Griglia regolare – BIGBANG: metodologia e stime. Rapporto sulla disponibilità naturale della risorsa idrica. Rapporti n. 339/21, Roma. Disponibile online all’indirizzo: https://www.isprambiente.gov.it/it/pubblicazioni/rapporti/il-bilancio-idrologico-gis-based-a-scala-nazionale-su-griglia-regolare-bigbang.
- Celico, P., 1988: Prospezioni idrogeologiche, Liguori, Napoli.
- Mariani, S., Braca, G., Lastoria, B., Tropeano, R., Casaioli, M., Piva, F., Bussettini, M., 2024: “Il bilancio idrologico, la disponibilità di risorsa idrica e il bilancio idrico”, in Siccità, scarsità e crisi idriche, Emanuele Romano, Ivan Portoghese (a cura di), Habitat signa 1, 29-46. Roma: Cnr Edizioni. Disponibile online all’indirizzo: https://www.cnr.it/sites/default/files/public/media/attivita/editoria/SiccitaInterattivo_ver2.pdf.
The indicator is estimated on the basis of a mathematical model and, as such, can therefore only be compared with indicators obtained with the same model. In addition, it is estimated on the basis of precipitation, which are estimated on the basis of a set of rainforest stations that could be not homogeneously distributed over the territory and whose number could be different from one year to another. Such circumstances, together with the different hydraulic characterization of hydrogeological and soil complexes, suggest special attention and caution when comparing the indicator in space and time. In addition, previously published estimates referring to earlier versions of the BIGBANG model may have slight deviations from the estimates of the latest version available as some data or schematizations at the base of the model may have changed. Correct comparisons between the values of the indicator must therefore be made using the same version of the BIGBANG model.
-
ISPRA
Regional hydro-meteorological services and autonomous provinces
The precipitation and temperature data used are mostly those collected and published by the regional and provincial structures to which, according to Article 92 of Legislative Decree no. 112 of 31 March 1998, the functions and tasks of the peripheral offices of the National Hydrographic and Tiring Service (SIMN, now merged into ISPRA) of the Department for National Technical Services, were transferred. The precipitation data are collected directly from the regional structures and autonomous provinces, while the temperature data used in the processing of the indicator are accessible by consulting the websites of the institutions, or through the SCIA portal of ISPRA (https://scia.isprambiente.it). The precipitation data aggregated to the monthly and infiltration scales, both on the regular grid of the 1 km resolution BIGBANG, which covers the entire national territory, are available on the Groupware portal of the ISPRA (https://groupware.sinanet.isprambiente.it/bigbang-data/library/bigbang_90).
National
1951–2024
The calculation method uses the potential infiltration coefficient (CIP), between 0 and 1, associated with hydrogeological complexes as implemented in the BIGBANG-Billion Gis BATS-National-National-wide Dryer Trend on Regular Grid, version 9.0, developed and implemented in GIS environment by ISPRA. In particular, infiltration I is provided by the expression:
The CIP * (A – E – ?WS) where A is the liquid inflow (rain + nival melting), And it is the actual evapotranspiration and the volume of water stored in the surface layer of the soil. The calculation of the indicator is carried out from the evaluation of infiltration on a regular grid of resolution 1 km covering the entire national territory.
In 2024, the value of the annual infiltration total was slightly higher than the 1951–2024 average. This has been more renewable underground water resource for this year.
Although 2024 was above average, a statistically significant, statistically significant, ISPRA version is detected through the Mann-Kendall test. A negative trend leads to a reduction in the availability of renewable underground water resources.
| Data |
|---|
Thumbnail
Headline
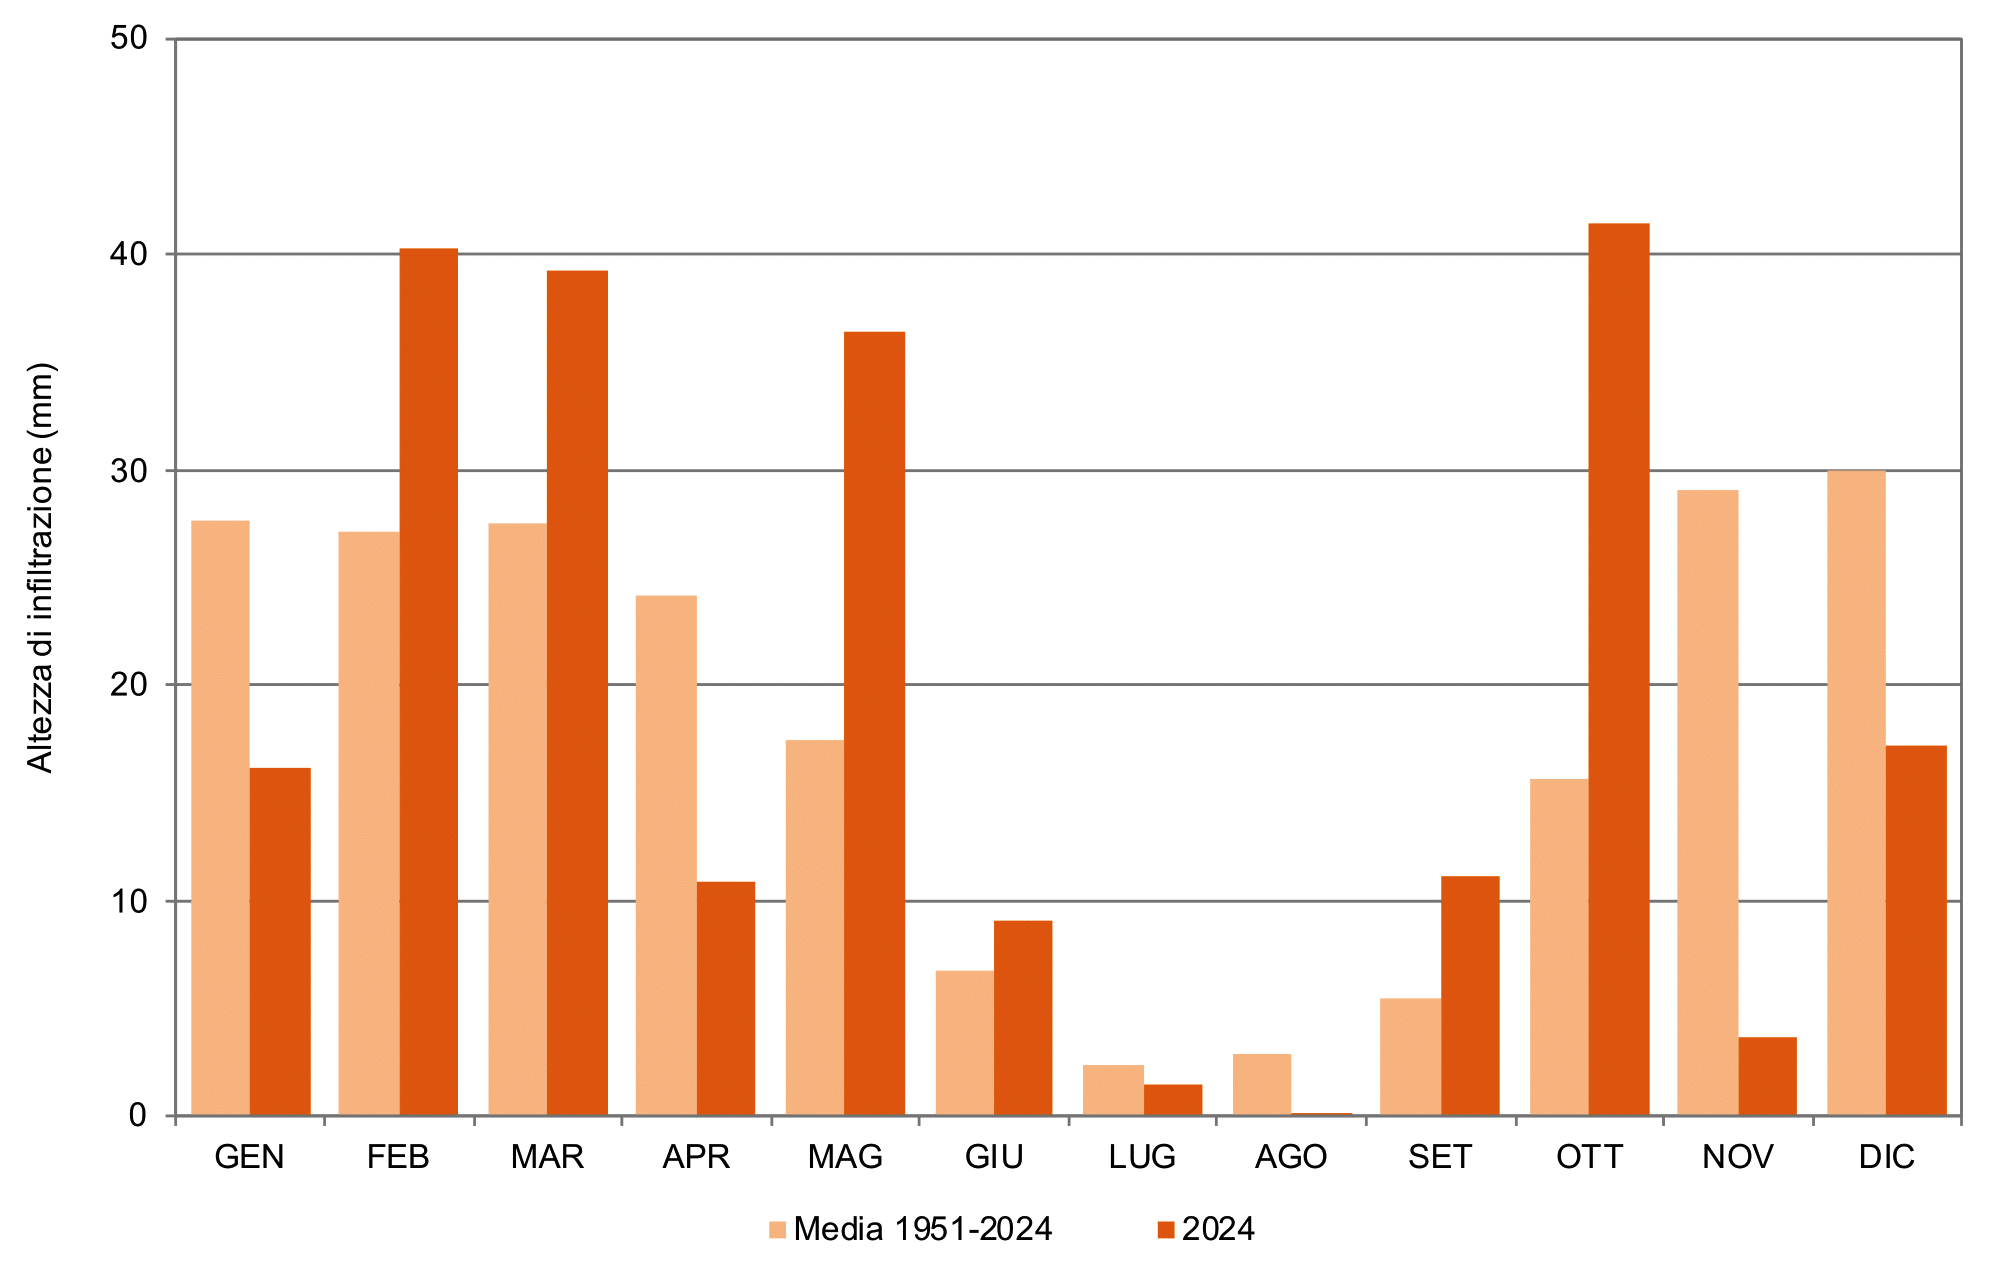
Figure 1: Monthly infiltration height in detail to the national territory for 2024 and average for the period 1951-2024 Data source
ISPRA elaboration on data from regional hydro-meteorological offices and autonomous provinces and on historical data of the Suppressed SIMN |
Headline
Dati per Figura 1 Data source
Elaborazione ISPRA su dati degli uffici idro-meteorologici regionali e delle province autonome e su dati storici del soppresso SIMN |
In 2024, the total annual infiltration was estimated to be 226.8 mm, with a deviation of +5% from the 1951–2024 average, which was equal to 216.1 mm. The infiltration during 2024 was very variable monthly from the average, with percentage deviations between the lowest –97% in August and a maximum of +164% in October. The months of February, March, May, June and September also recorded positive deviations from the average (Figure 1).
The positive anomaly of infiltration in 2024, for the entire national territory, is explained by the considerable amount of rainfall that has affected, however, only northern Italy, in particular in the months of September and October, with a positive anomaly of total rainfall of the order of +11% compared to the annual average over the long period 1951-2024 (see the indicator "Precipitations" present in the environmental theme "Water resource and balance" of Environmental Indicators Database).