Antonio Caputo, Giulia Iorio
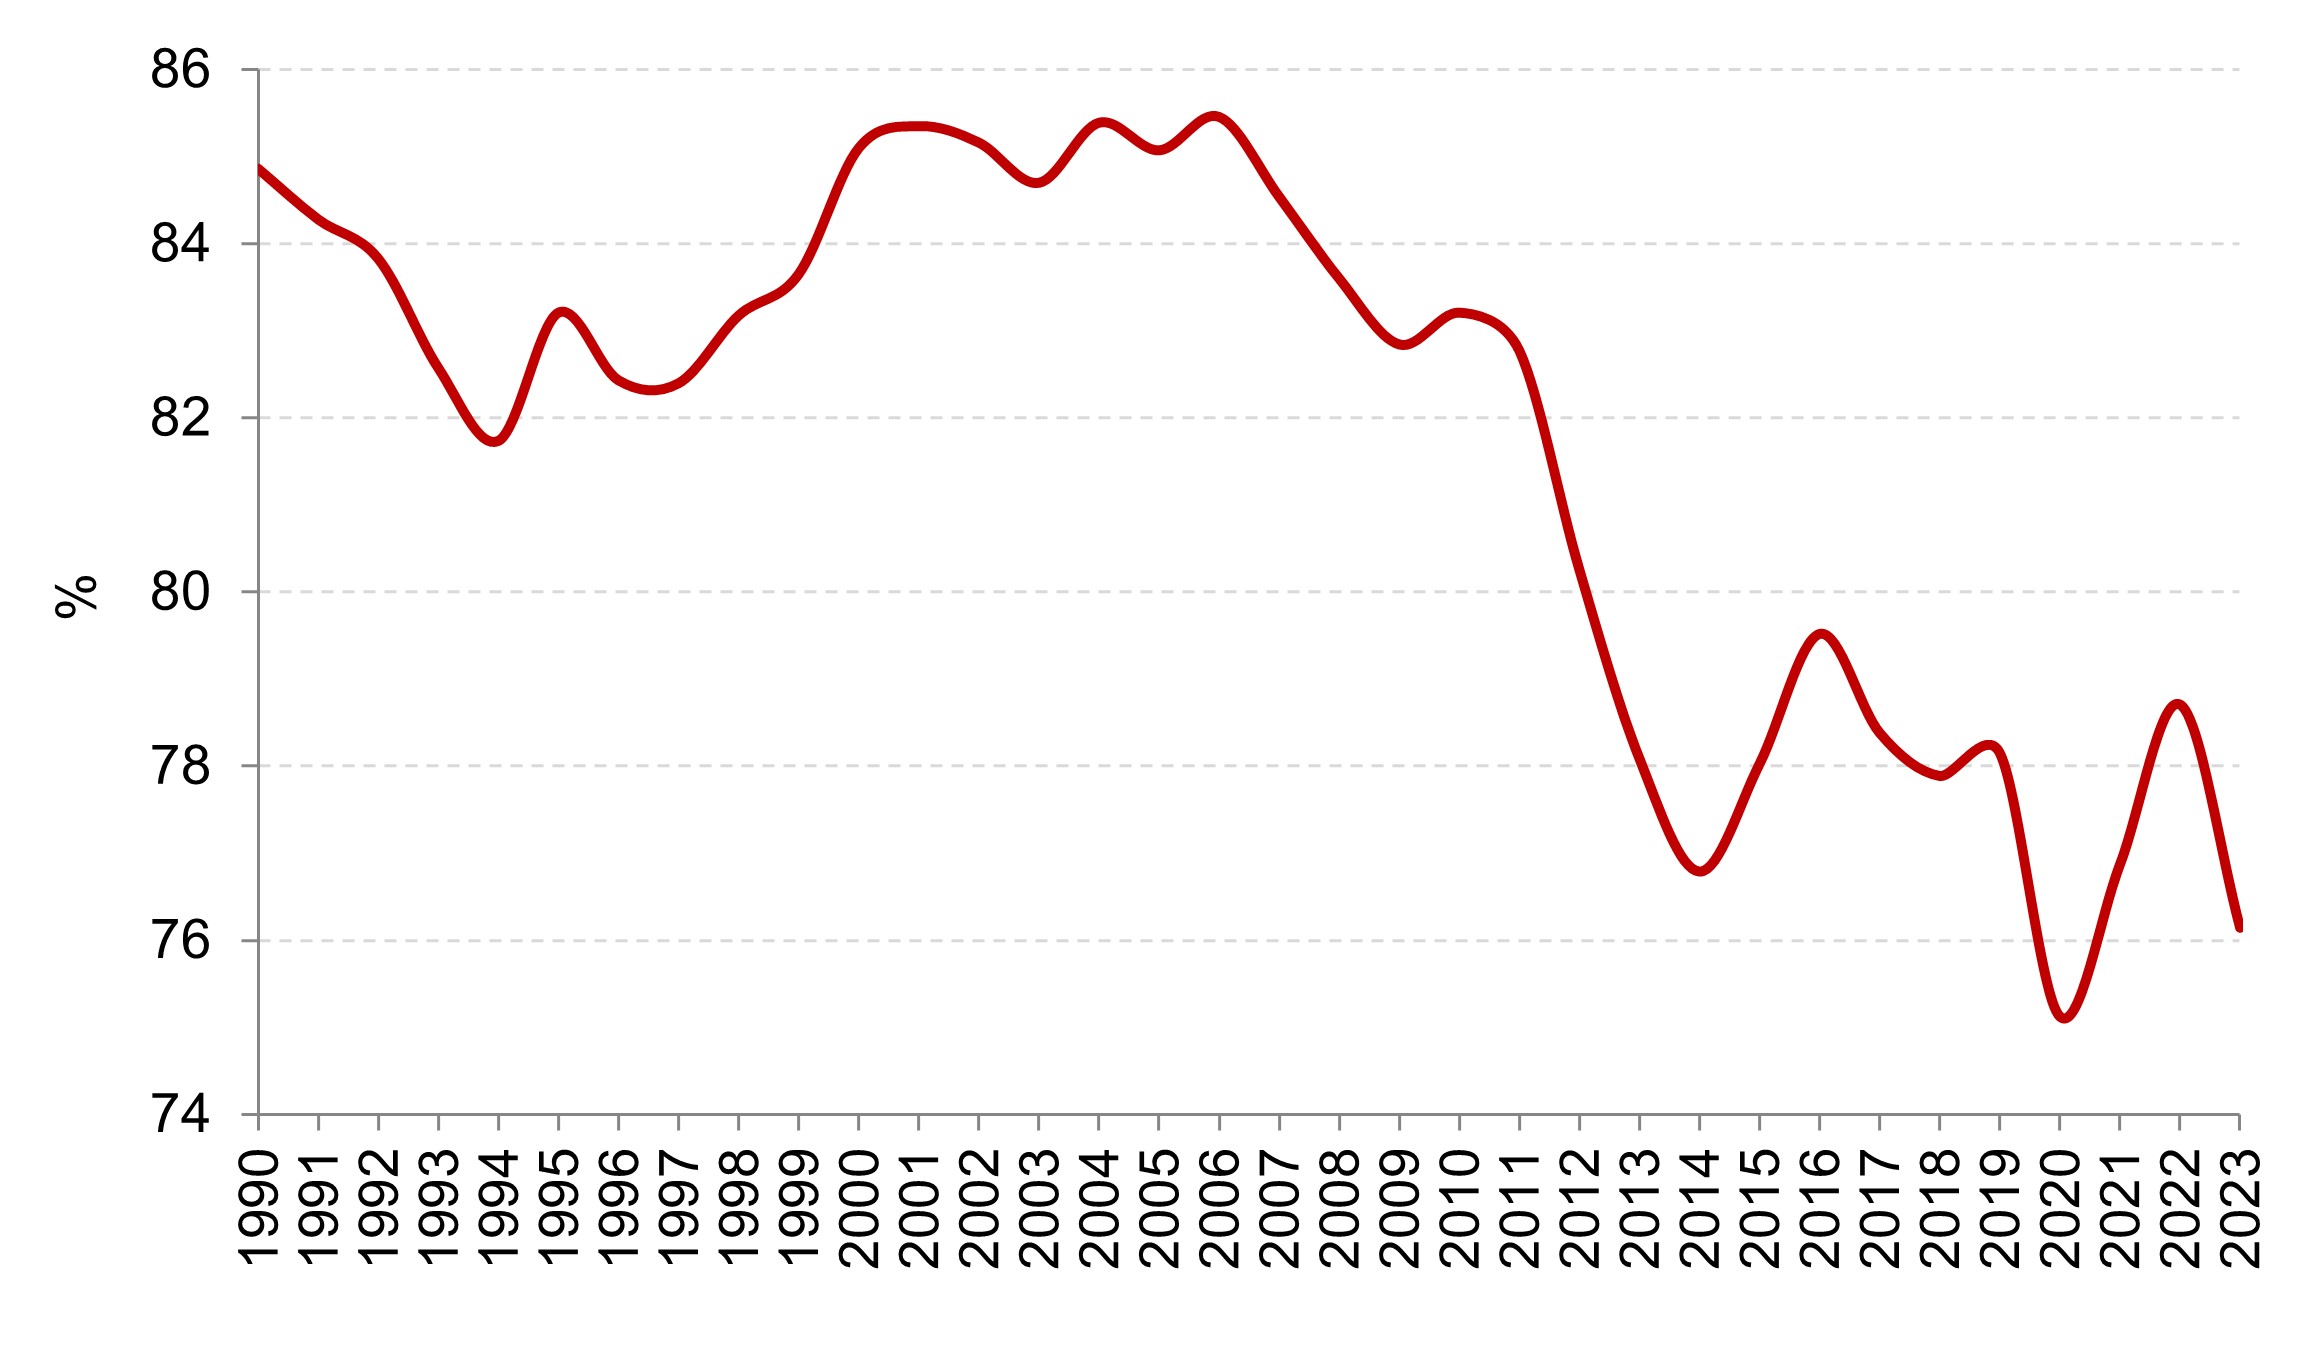
The indicator illustrates the dependency of the national economy on imports of various energy sources to meet its domestic demand. The decrease in the share of oil and the concurrent increase in the share of energy from renewable sources have led to a reduction in the nation's energy dependence. A decline in energy dependency has been observed since 2007, falling from a peak of 85.5% in 2006 to a low of 75.1% in 2020. In 2023, the dependency rate was recorded at 76.1%.
This indicator quantifies the dependency of the national economy on imports of various energy sources to meet its domestic demand. It is calculated as the ratio of net imports to total domestic energy availability, excluding stock changes.
The purpose is to provide information pertaining to resource supply security, specifically concerning the degree of dependency on imports of energy sources and primary electricity.
With Decision No. 1386/2013/EU, the European Union established the 7th Environment Action Programme (EAP) running until 2020. On 14 October 2020, the European Commission presented the proposal for a decision establishing the 8th Environment Action Programme for the period 2021–2030. On 29 March 2022, the Council of the EU formally adopted the 8th Environment Action Programme (2021–2030). Although no regulatory limits on energy imports are set by current legislation, the indicator falls within the framework of European environmental policies aimed at decarbonization and improving energy efficiency.
MASE, 2024, The National Energy Situation in 2023
ENEA (Ente per le Nuove Tecnologie, l'Energia e l'Ambiente)
MASE (Ministero dell'Ambiente e della Sicurezza energetica)
MASE, National Energy Balance. Available at: https://sisen.mase.gov.it/dgsaie/
Database Eurostat. Available at: https://ec.europa.eu/eurostat/data/database
National
1990-2023
The indicator is calculated as the ratio between net imports and domestic availability net of stock changes. This indicator, together with other energy statistics, constitutes an integral part of the European Statistical System (ESS).
In 2023, energy dependency—defined as the ratio between net imports and energy availability net of stock changes—stood at 76.1%. Dependency on solid fuels was complete, while dependency on oil and natural gas amounted to 93.7% and 95.6%, respectively. Dependency on renewable resources was recorded at 6.8% (Table 1).
Italy's lack of domestic energy resources results in a high level of energy dependence. A decline in energy dependence has been observed since 2007, falling from a peak of 85.5% in 2006 to a low of 75.1% in 2020. This was followed by a renewed increase in subsequent years, stabilizing at 76.1% in 2023 (Table 1 and Figure 1).
| Allegati |
|---|
Titolo
Table 1: Italian Energy Dependency* Fonte
Based on data from MASE, ENEA, EUROSTAT Legenda
* Net Imports / Total Energy Availability (excluding stock changes) |
Thumbnail
Titolo
Figure 1: Italian Energy Dependency* Fonte
Elaborations by ISPRA based on data from MASE, ENEA, EUROSTAT Legenda
* Net Imports / Total Availability (excluding stock changes) |
The average dependency on solid fuels over the period 1990–2023 is 99.5%, with total reliance on imports in recent years. For natural gas and petroleum products, the average dependency is 82% and 95.6%, respectively (Table 1). For petroleum products, a long-term decreasing trend is observed, reaching a minimum of 92.5% in 2014 and 2020; in 2023, dependency stood at 93.7%. The dependency trend for natural gas shows a steady increase from 64.3% in 1990 to 95.6% in 2023. Dependency on renewable energy sources rose from 1.4% in 1990 to a peak of 13.3% in 2011, followed by a steady decline to 6.8% in 2023 (Table 1).