Alessandro Di Menno of Bucchianico, Raffaela Gaddi, with the contribution of the POLLnet-SNPA network and the Aerobiological Monitoring Center of the University of Rome Tor Vergata
The indicator describes the times of pollination of a specific botanical family during the year. The start and end dates and duration of a family's pollen season change based on location, because pollination is extremely sensitive to weather and climate differences. It should be noted that the duration of the pollen season is not related to the greater or lesser quantity of airborne pollen. The comparative examination of the data of the beginning and end of pollination of the monitored families can highlight the presence of airborne pollen, for some locations, even in the months of January and December.
The start and end dates of pollination (calculated according to the Jäger criterion), its duration, the peak of maximum pollen concentration (together with the Annual Pollen Integral, see the indicator "Allergenic and Annual Pollen Integral") are the main information describing the pollen season. This indicator is calculated for each of the seven most allergenic botanical taxa among those widespread on the national territory: the Asteraceae (also called Compositae ), the Betuloideae and the Coryloideae (subfamilies of the Betulaceae which group taxa distinct in the past in the families Betulaceae and Corylaceae ), the Cupressaceae and Taxaceae (counted together), the Oleaceae, the Poaceae (also called Gramineae) and the Urticaceae.
Describe the presence in the atmosphere and the trend in space and time of allergenic pollens potentially dangerous to human health.
Directive no. 92/43/EEC: Council Directive on the conservation of habitat natural and semi-natural and wild flora and fauna.
UNI 11108 – 2004: Air quality - Method of sampling and counting of pollen grains and airborne fungal spores.
UNI CEN/TS 16868 – 2015: Ambient Air - Sampling and analysis of pollen and fungal spores dispersed in the air for allergy monitoring networks - Hirst Volumetric Method.
UNI EN 16868 – 2019: Ambient Air - Sampling and analysis of pollen and fungal spores dispersed in the air for allergy monitoring networks - Hirst Volumetric Method.
There is no specific regulation that sets limits or concentration objectives for airborne pollen.
Jäger S., Nilsson S., Berggren B., Pessi A. M., Helander M. And Ramfjord H., 1996. Trends of some airborne tree pollen in the Nordic countries and Austria, 1980-1993. A comparison between Stockholm, Trondheim, Turku and Vienna. Grana, 35: 171-178.
Di Menno di Bucchianico A., Gaddi R., Brighetti M. A. Et al. TO. Status and Trend of the Main Allergenic Pollen Grains and Alternaria Spores in the City of Rome (2003–2019), Sustainability 2023, 15, 6150. Https://doi. org/10.3390/su15076150.
It describes the pollination characteristics of each individual botanical family but does not take into account the phenomenon as a whole.
The spatial and temporal coverage of the indicator is limited.
Activation of new monitoring stations until there is at least one for each provincial capital.
SNPA (National System for Environmental Protection)
University of Rome "Tor Vergata"
The data provided by the SNPA POLLnet network are directly accessible. https://pollnet. isprambiente. it/
The data for Rome are provided by the University of Rome “Tor Vergata”. https://web. uniroma2. it/
Municipal (63/7,904)
2024
The pollen season of a given botanical family begins on the first day in which at least 1% of the annual total pollen monitored for it is detected. However, this date must not be followed by more than six days of absence of pollen of that species, in which case reference is made to the subsequent event.
The season ends when 95% of the pollen monitored in the year for that family have been counted (Jäger et al. - 1996).
To these parameters is added the date and value of the maximum pollen concentration peak (maximum daily number of granules per cubic meter recorded in the year).
The duration of the pollen season for Asteraceae, Betuloideae, Oleaceae, Poaceae and Urticaceae is calculated on the calendar year. For Coryloideae and Cupressaceae-Taxaceae, the pollen season is calculated considering the concentrations from 1 November 2023 to 31 October 2024, based on the average phenological dynamics, on a national scale, which characterizes the two indicators.
In 2024, 64 stations will be active (of which 62 are from the SNPA POLLnet network); for 58 of the 64 stations series are available with sufficient data coverage to process the indicator (DC > 75% of the data measured in the respective average pollen seasons). The territorial distribution involves 18 out of 20 regions. This year too, as highlighted by the graphs (Figures 1 to 7), a marked territorial variability of the parameters constituting the indicator is confirmed.
The pollen season is affected by the weather trends (in particular temperature and rainfall) recorded during the year in each monitored location. The result is sometimes accentuated variability both between the various stations and for the same station from one year to the next. However, observation periods of many years are needed (many more than those currently available) to be able to identify gods trend .
| Allegati |
|---|
Titolo
Table 1: Asteraceae (2024) Fonte
Processing by ISPRA based on SNPA data and University of Rome “Tor Vergata” Legenda
[1] Data from the Aerobiological and Environmental Monitoring Centre of the University of Rome “Tor Vergata” |
Titolo
Table 2: Betuloideae (2024) Fonte
Processing by ISPRA based on SNPA data and University of Rome “Tor Vergata”
Legenda
[1] Data from the Aerobiological and Environmental Monitoring Centre of the University of Rome “Tor Vergata” |
Titolo
Table 3: Coryloideae (2024) Fonte
Processing by ISPRA based on SNPA data and University of Rome “Tor Vergata” Legenda
[1] Data from the Aerobiological and Environmental Monitoring Centre of the University of Rome “Tor Vergata”
|
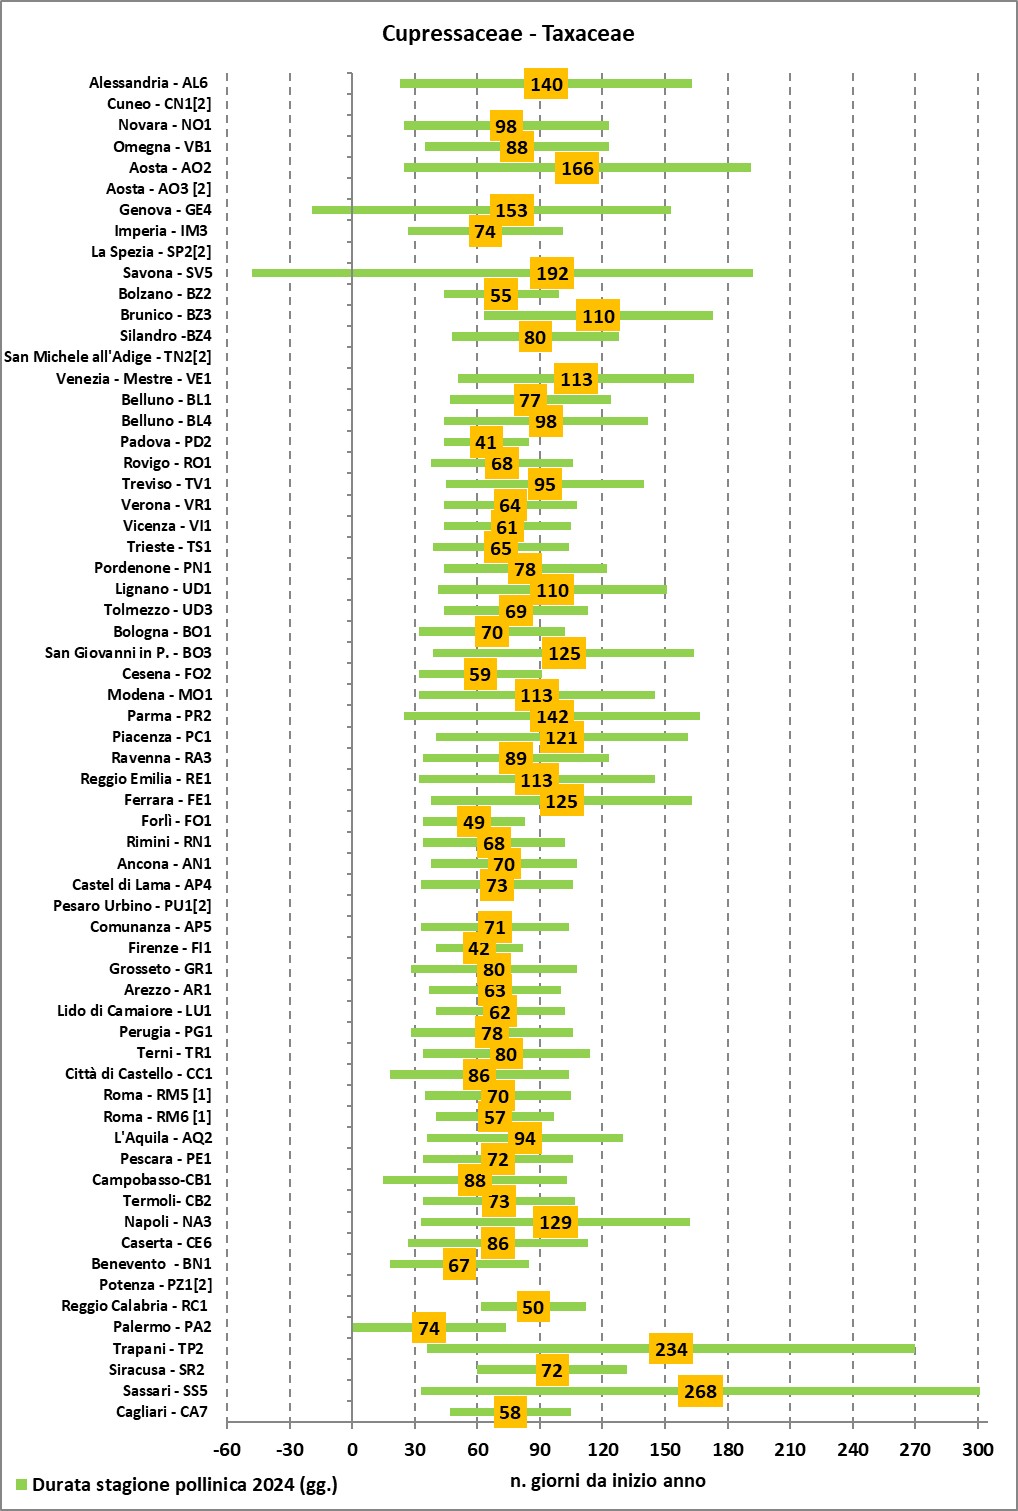
Titolo
Table 4: Cupressacea-Taxaceae (2024) Fonte
Processing by ISPRA based on SNPA data and University of Rome “Tor Vergata” Legenda
[1] Data from the Aerobiological and Environmental Monitoring Centre of the University of Rome “Tor Vergata” |
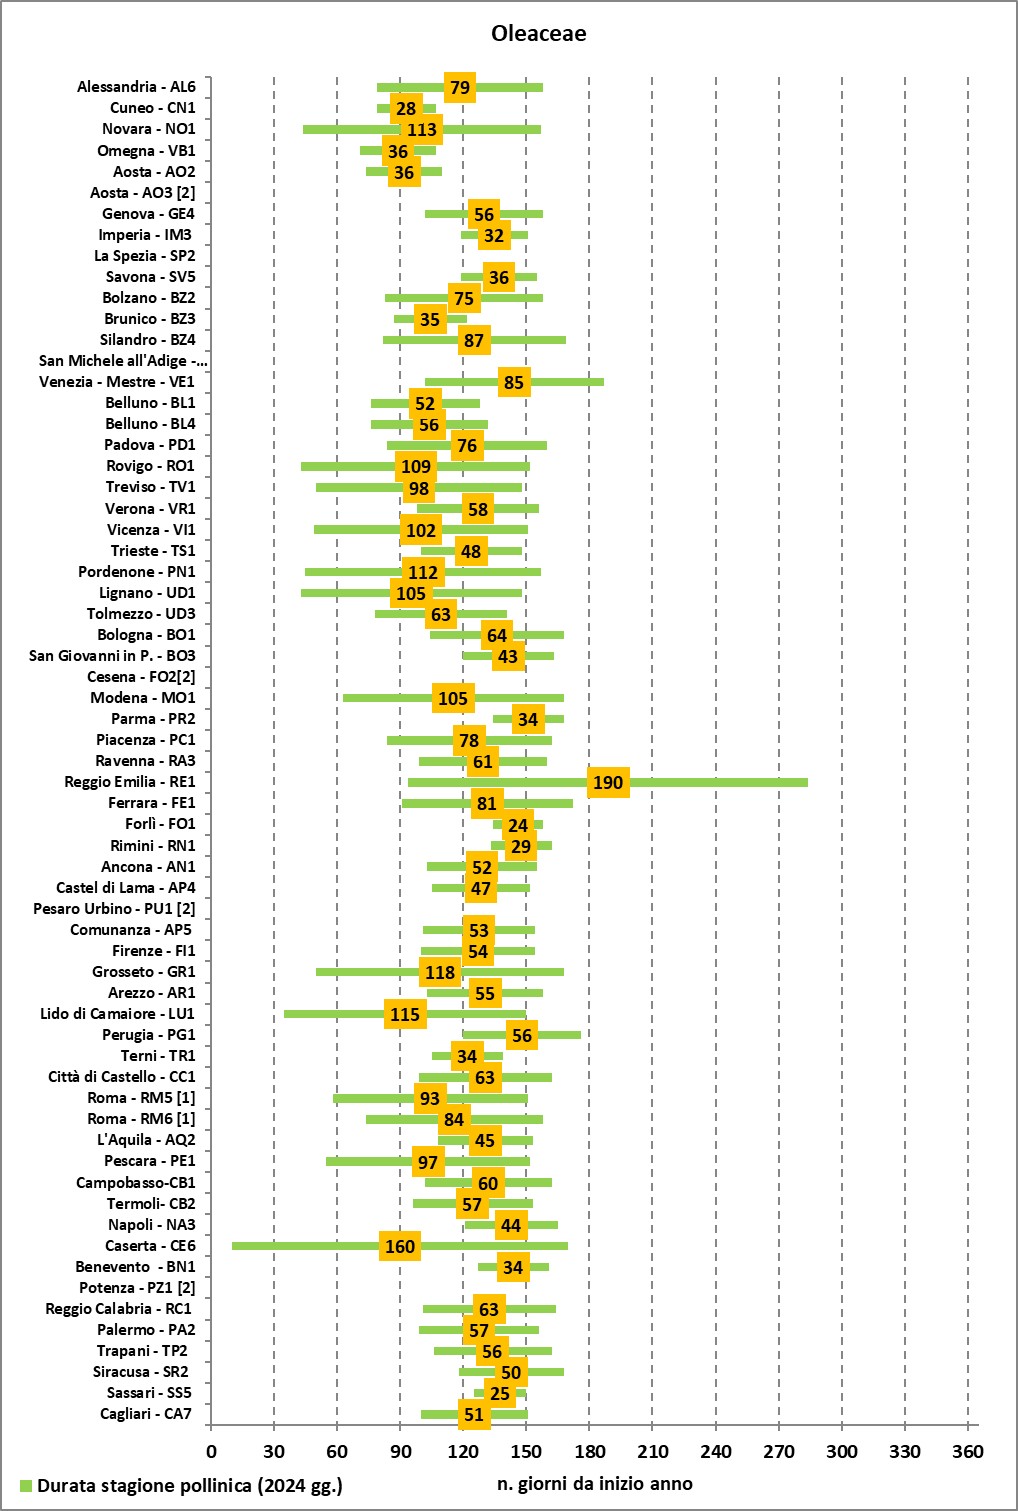
Titolo
Table 5: Oleaceae (2024) Fonte
Processing by ISPRA based on SNPA data and University of Rome “Tor Vergata” Legenda
[1] Data from the Aerobiological and Environmental Monitoring Centre of the University of Rome “Tor Vergata” |
Titolo
Table 6: Poaceae (2024) Fonte
Processing by ISPRA based on SNPA data and University of Rome “Tor Vergata” Legenda
[1] Data from the Aerobiological and Environmental Monitoring Centre of the University of Rome “Tor Vergata” |
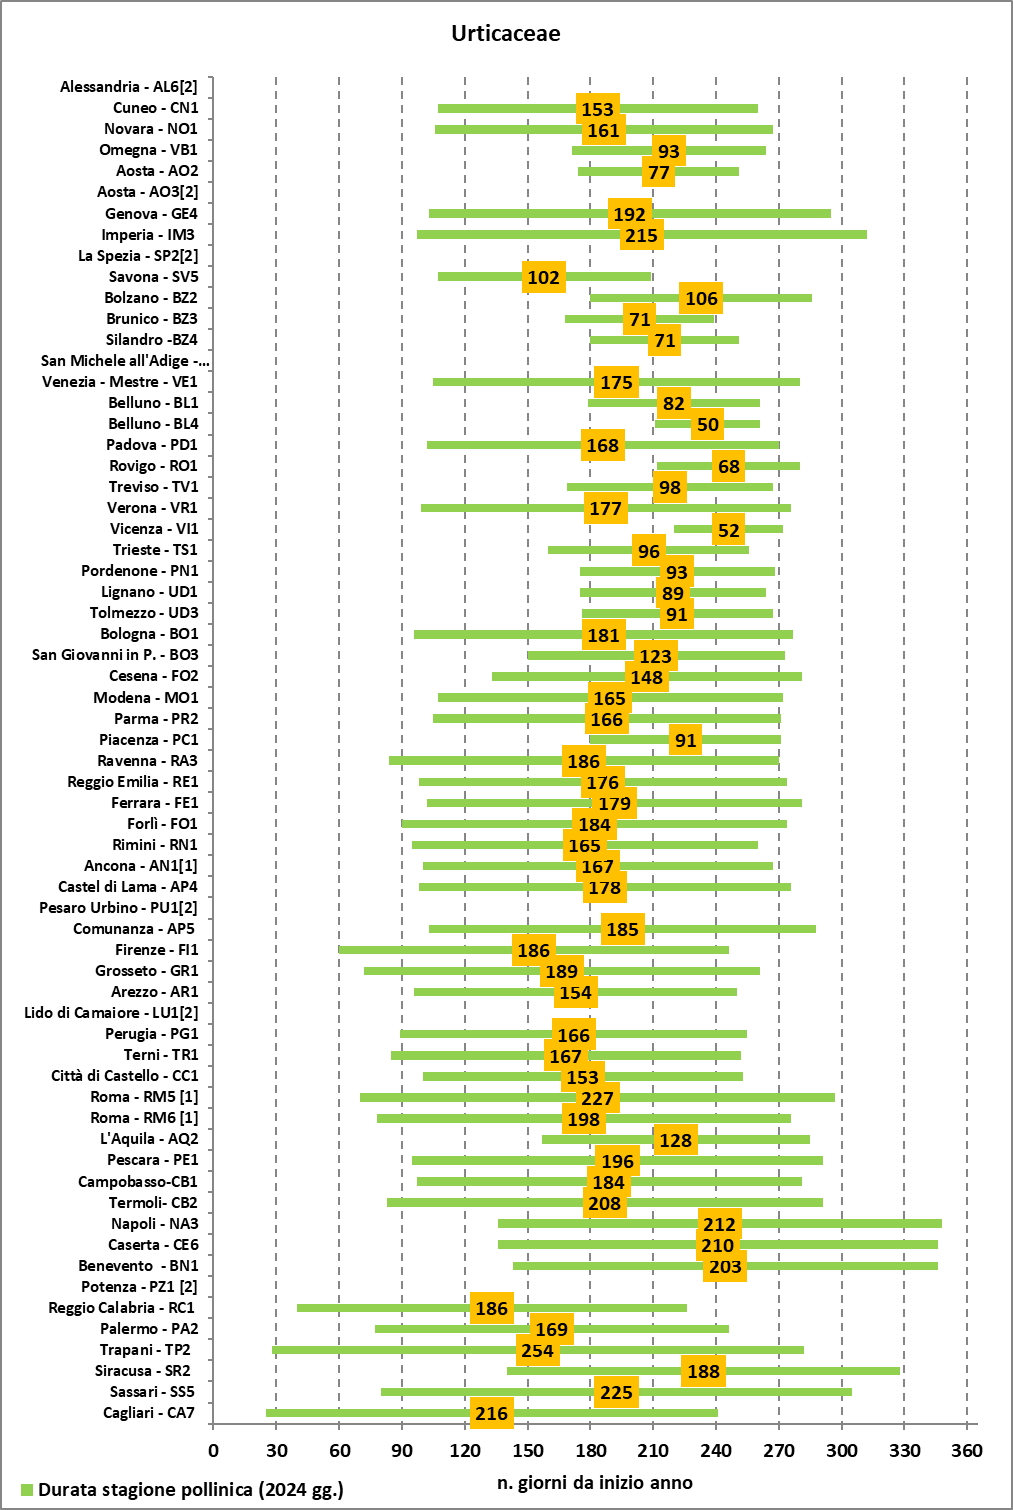
Titolo
Table 7: Urticaceae (2024) Fonte
Processing by ISPRA based on SNPA data and University of Rome “Tor Vergata” Legenda
[1] Data from the Aerobiological and Environmental Monitoring Centre of the University of Rome “Tor Vergata” |
Thumbnail
Titolo
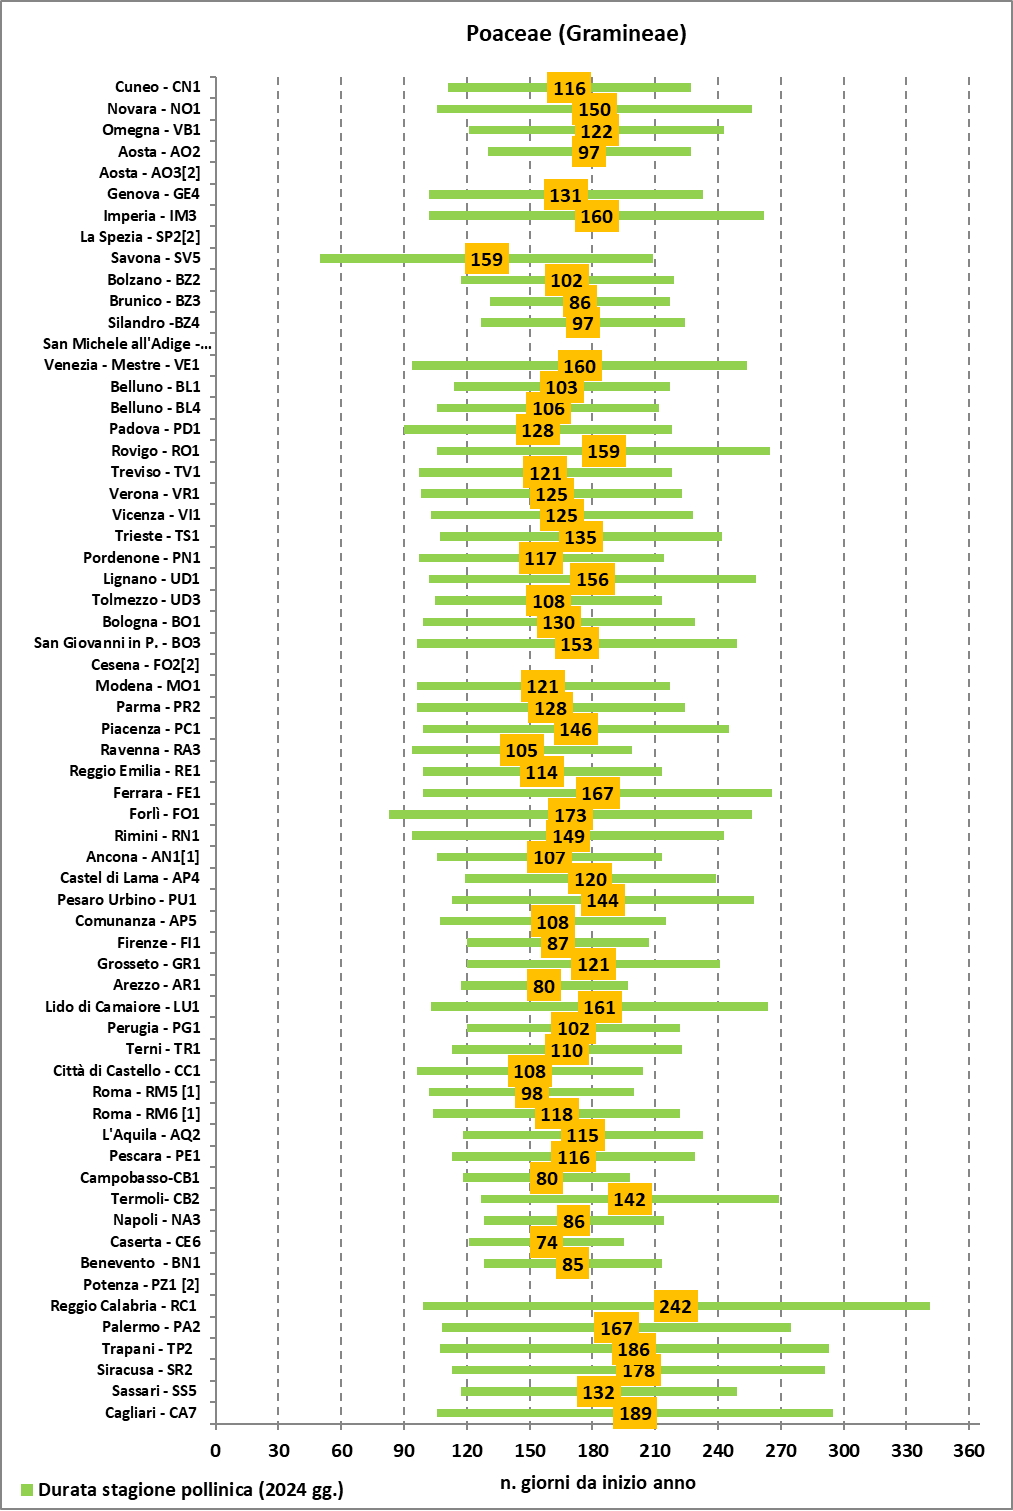
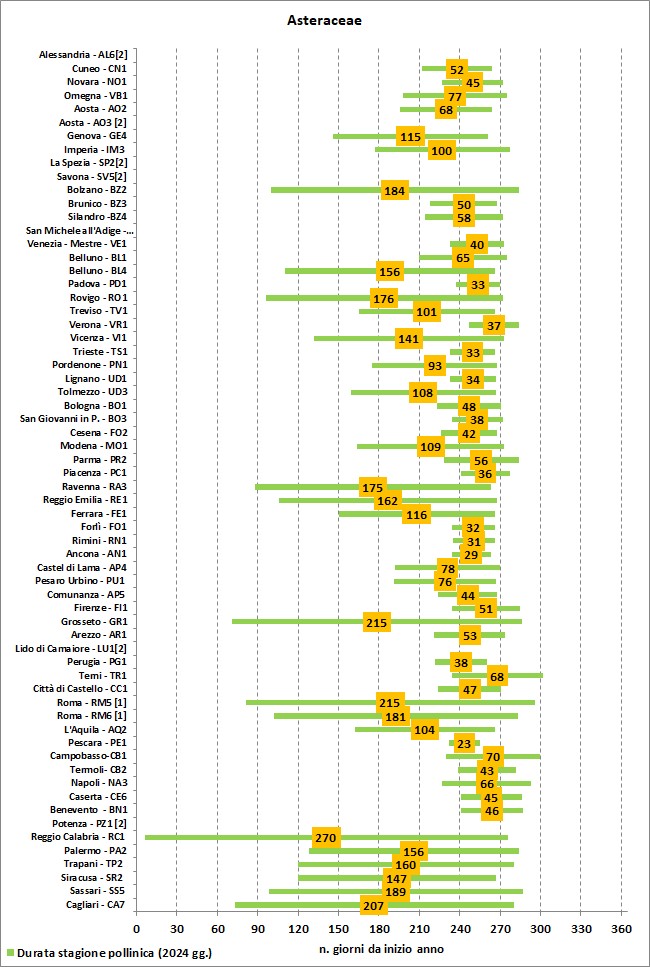
Figura 1: Stagione Pollinica - Asteraceae (2024) Fonte
Processing by ISPRA based on SNPA data and University of Rome “Tor Vergata” |
Thumbnail
Titolo
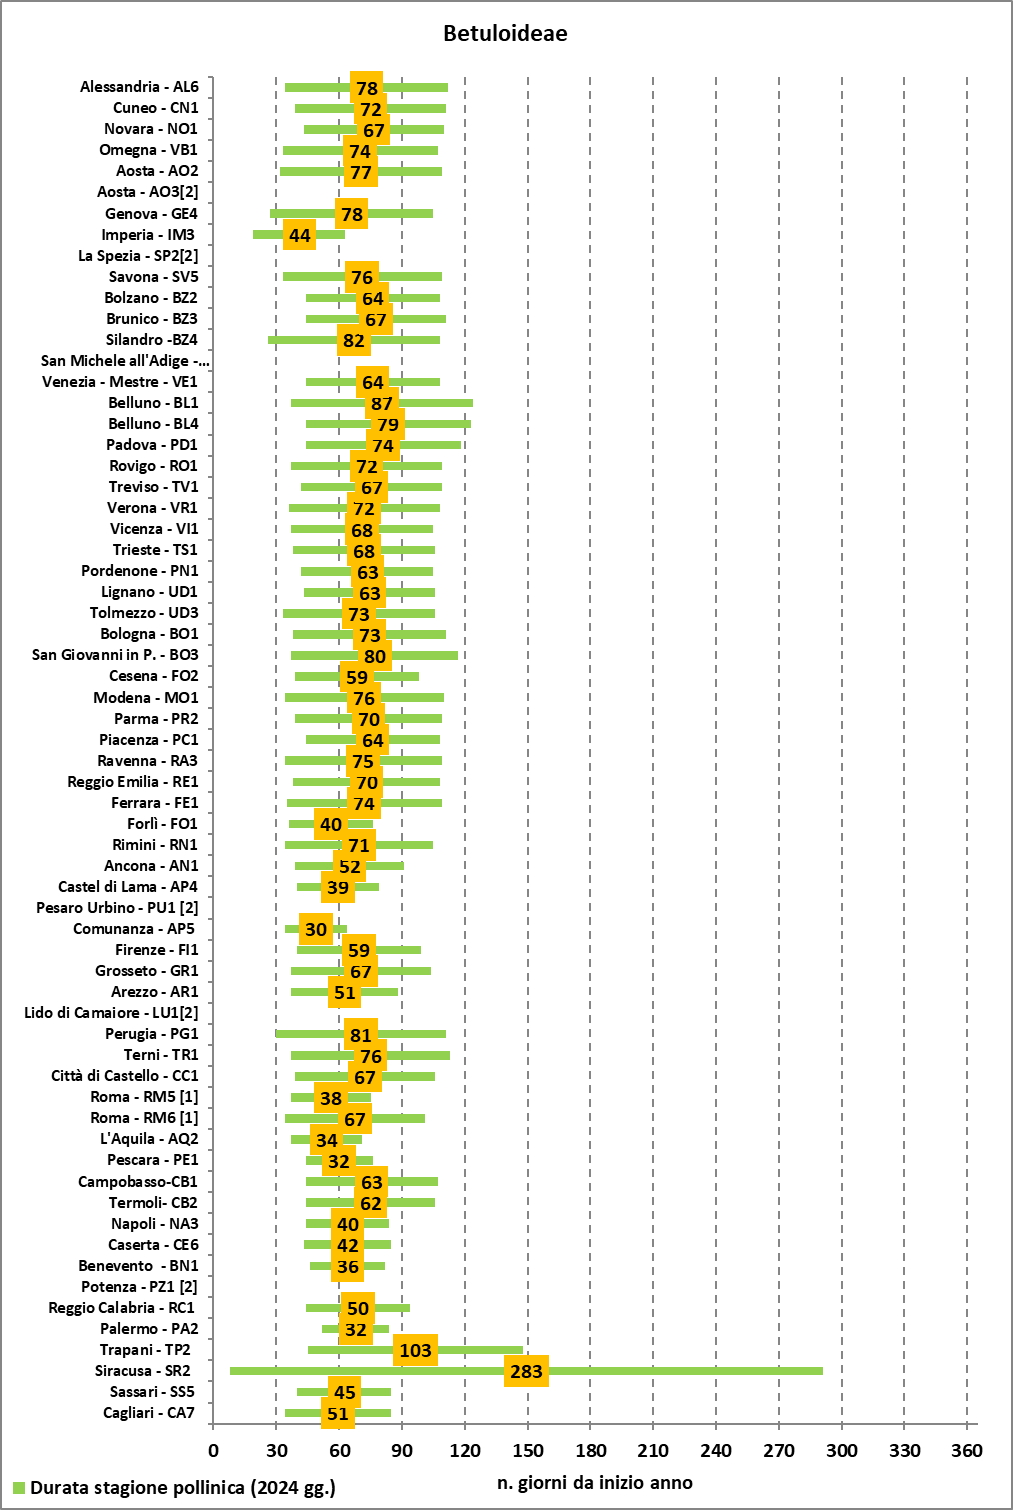
Figure 2: Betuloideae (2024) Fonte
Processing by ISPRA based on SNPA data and University of Rome “Tor Vergata” |
Thumbnail
Titolo
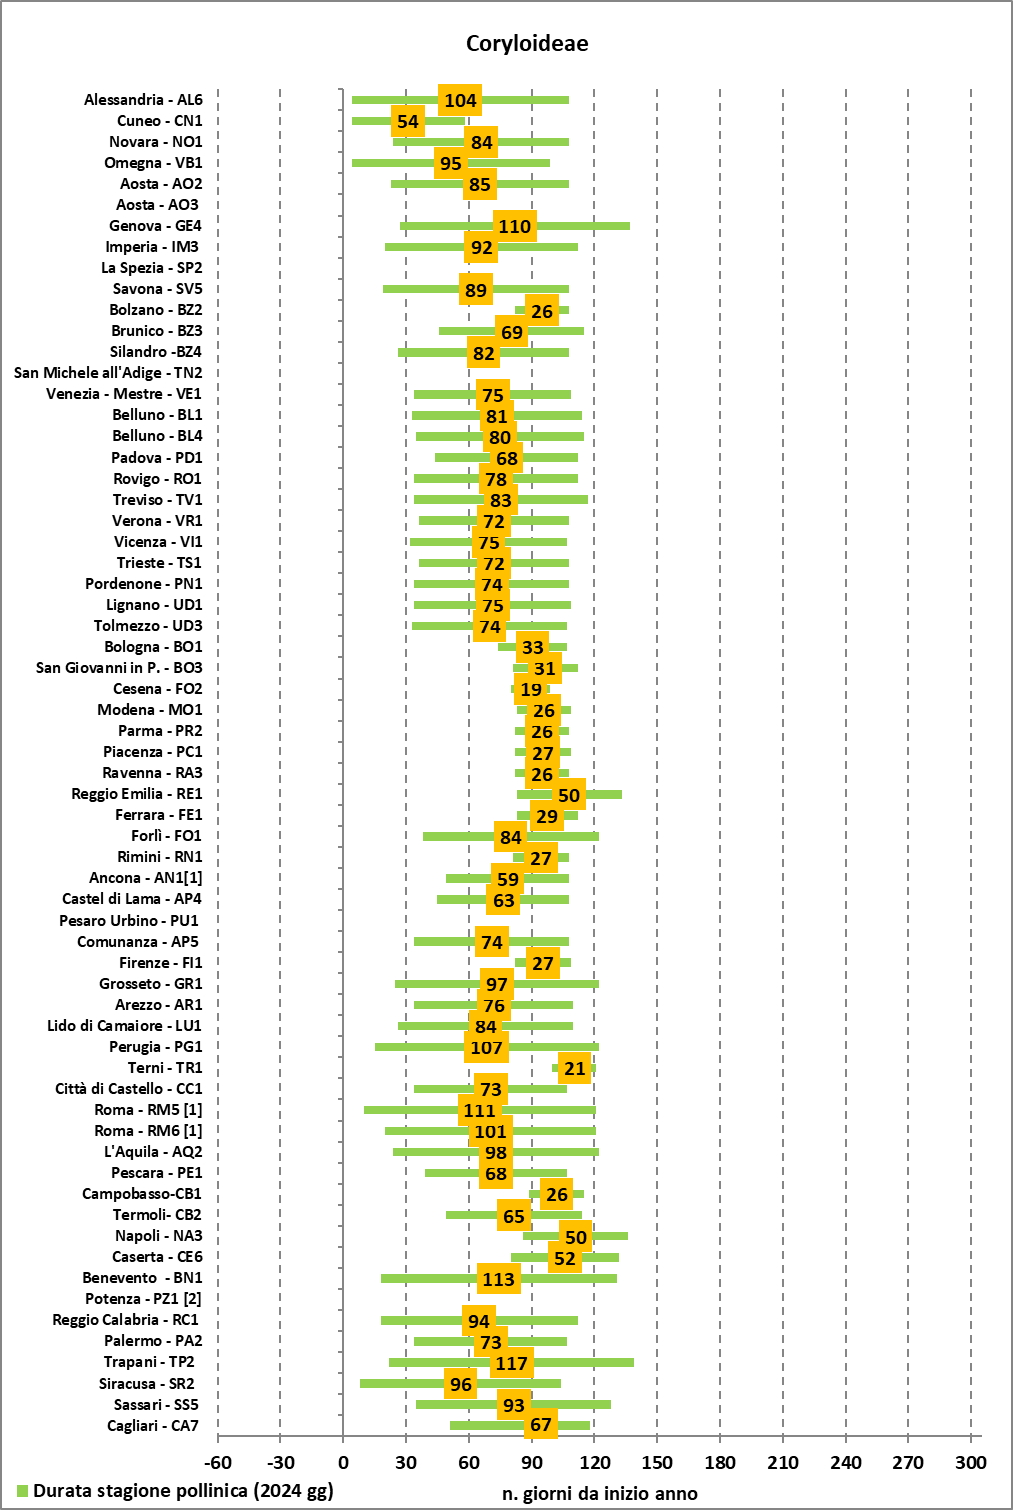
Figure 3: Coryloideae (2024) Fonte
Processing by ISPRA based on SNPA data and University of Rome “Tor Vergata” |
Thumbnail
Titolo
Figure 4: Cupressaceae-Taxaceae (2024) Fonte
Processing by ISPRA based on SNPA data and University of Rome “Tor Vergata” |
Thumbnail
Titolo
Figure 5: Oleaceae (2024) Fonte
Processing by ISPRA based on SNPA data and University of Rome “Tor Vergata” |
Thumbnail
Titolo
Figure 6: Poaceae (2024) Fonte
Processing by ISPRA based on SNPA data and University of Rome “Tor Vergata” |
Thumbnail
Titolo
Figure 7: Urticaceae (2024) Fonte
Processing by ISPRA based on SNPA data and University of Rome “Tor Vergata” |
Specifically for the different botanical families, in 2024 the average duration of the pollen season of the Asteraceae (Compositae) was 92 days, with a maximum in Calabria in Reggio Calabria (270 days) (Table 1 and Figure 1).
The average duration of the Betuloideae pollen season was 67 days, with a maximum in Sicily in Syracuse (283 days) (Table 2 and Figure 2).
The average duration of the pollen season of the Coryloideae was 69 days, with a maximum in Sicily in Trapani (117 days) (Table 3 and Figure 3).
The average duration of the pollen season of Cupressaceae-Taxaceae was 93 days, with a maximum in Sardinia in Sassari (268 days) (Table 4 and Figure 4).
The average duration of the Oleaceae pollen season was 67 days, with a maximum in Emilia-Romagna in Reggio Emilia (190 days) (Table 5 and Figure 5).
The average duration of the Poaceae (Gramineae) pollen season was 128 days, with a maximum in Reggio Calabria (242 days) (Table 6 and Figure 6).
The average duration of the Urticaceae pollen season was 154 days with a maximum in Sicily in Trapani (254 days) (Table 7 and Figure 7).
it should be noted that the more or less long duration of the pollen season is independent of the quantity of pollen emitted. To frame the phenomenon also quantitatively, it is therefore necessary to also refer to the values of the annual pollen integral (see the indicator "Allergenic and annual pollen integral"). Correct planning of mowing and pruning interventions on urban greenery must take into account the starting period of the pollen season so as to be able to contain, as far as possible, the presence of allergenic pollen in the city air. Furthermore, since these activities concern air quality in relation to human health, they are among those suitable for pursuing objective d) of the 8th Environmental Action Program (8th PAA).