Alessandro Di Menno of Bucchianico, Raffaela Gaddi, with the contribution of the POLLnet-SNPA network and the Aerobiological Monitoring Center of the University of Rome Tor Vergata
The Allergenic and Annual Pollen Integral indicator considers two integrals: the Annual Pollen Integral (IPAn) and the Allergenic Pollen Integral (IPA) which describe the quantity of pollen present in a year in the atmosphere of the locations where the monitoring stations are positioned. The Annual Whole Pollen and the Allergenic Whole Pollen are locally subject to very significant variations from one year to the next caused by the different trends of seasonal weather and climate characteristics. These are cumulative quantitative indicators which therefore do not give indications on the distribution methods of airborne pollen during the year.
The pollen integral expresses the sum of the average daily pollen concentrations in a given time interval or, equivalently, the product of the average concentration of a season and its duration. This term has traditionally been presented as an index (e. g. Annual or seasonal pollen index) but this terminology is now disused and outdated in the scientific literature (Galán et al., 2017).
The Annual Pollen Integral (IPAn) is obtained from the sum of the daily pollen concentrations of a specific family measured in the year considered, while the Allergenic Pollen Integral (IPA) is obtained from the sum of the pollen concentrations of the main and most widespread allergenic families present in the national territory. The botanical taxa considered here are: the Asteraceae (also called Compositae), the Betuloideae and the Coryloideae (subfamilies of the Betulaceae which group taxa distinct in the past in the Betulaceae and Corylaceae families), the Cupressaceae and Taxaceae (counted together), the Poaceae (also called Gramineae), the Oleaceae and the Urticaceae. The Annual Pollen Whole represents the cumulative quantity of pollen grains of a specific species, while the Allergenic Pollen Whole accounts for the overall quantity of allergenic pollen present in a specific location during the year.
Briefly evaluate the pollen allergenic load of a specific location, compare it with that of others and study its variation in space. These indications contribute to the assessment of the health risk linked to allergies and allow an initial verification of certain mitigation actions possibly implemented by the competent authorities.
Directive no. 92/43/EEC: Council Directive on the conservation of natural and semi-natural habitats and wild flora and fauna.
UNI 11108 – 2004: Air quality - Method of sampling and counting of pollen grains and airborne fungal spores.
UNI CEN/TS 16868 – 2015: Ambient Air - Sampling and analysis of pollen and fungal spores dispersed in the air for allergy monitoring networks - Hirst Volumetric Method.
UNI EN 16868 – 2019: Ambient Air - Sampling and analysis of pollen and fungal spores dispersed in the air for allergy monitoring networks - Hirst Volumetric Method.
There is no specific regulation that sets limits or concentration objectives for airborne pollen.
Galán, C., Ariatti, A., Bonini, M. Et al. (2017), Recommended terminology for aerobiological studies . Aerobiology 33, 293–295. Https://doi. org/10.1007/s10453-017-9496-0
ISPRA - Di Menno di Bucchianico A., Gaddi R., Cattani G., et al. (2021), State and trend of the main allergenic pollens in Italy (2003-2019), Reports 338/2021, ISBN:978-88-448-1037-5.
Di Menno di Bucchianico A., Gaddi R., Brighetti M. A. Et al. TO. Status and Trend of the Main Allergenic Pollen Grains and Alternaria Spores in the City of Rome (2003–2019), Sustainability 2023, 15, 6150. Https://doi. org/10.3390/su15076150.
it is a quantitative indicator that describes a phenomenon in which qualitative aspects are also fundamental. The spatial and temporal coverage of the indicator is limited.
Activation of new monitoring stations until there is at least one for each provincial capital.
SNPA (National System for Environmental Protection)
University of Rome "Tor Vergata"
The data provided by the POLLnet SNPA network is directly accessible (https://pollnet. isprambiente. it/)
The data for Rome are provided by the University of Rome “Tor Vergata” ( https://web. uniroma2. it )
Municipal (63/7,904)
2024
The Annual Whole Pollen (IPAn) is obtained from the sum of the daily concentrations of pollen of a specific family measured in the year considered, while the Whole Allergenic Pollen (IPA) is obtained from the sum of the pollen concentrations of the main and most widespread allergenic families present in the national territory: Asteraceae (or Compositae), Betuloideae, Coryloideae, Cupressaceae/Taxaceae, Poaceae (or Gramineae), Oleaceae, Urticaceae.
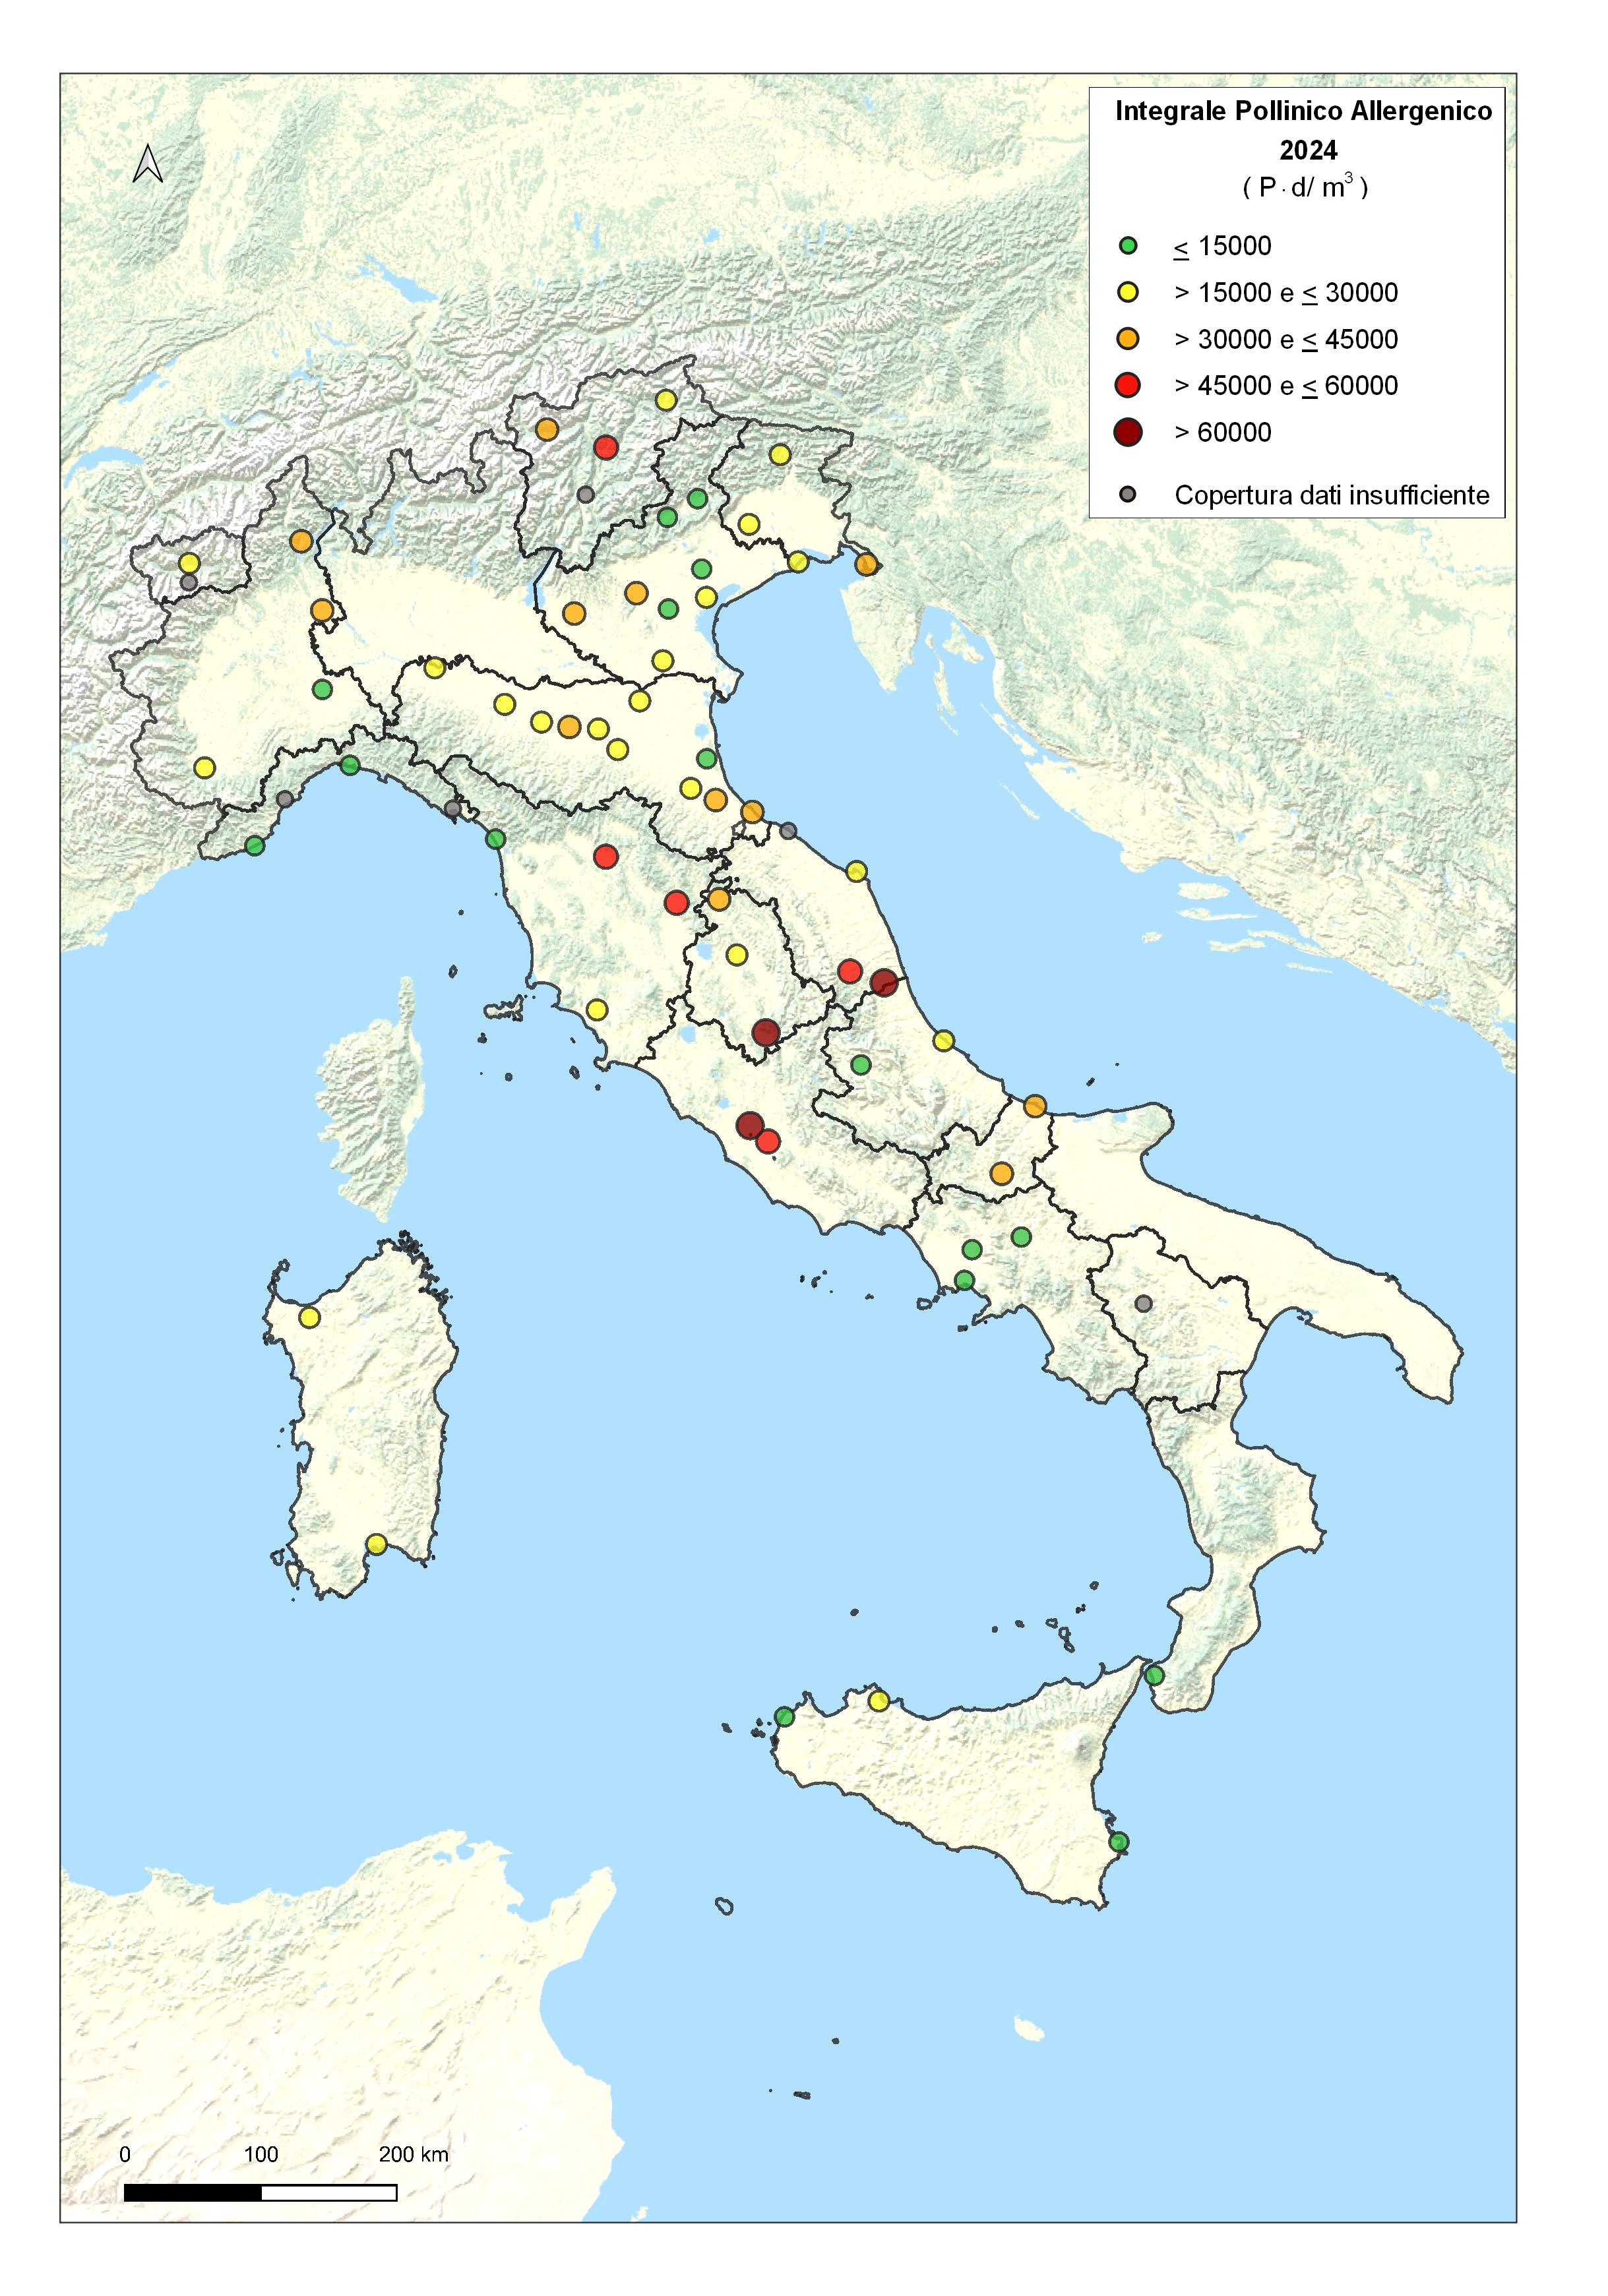
In 2024, 64 stations are active (of which 62 from the SNPA POLLnet network); for 58 of the 64 stations series are available with data coverage (DC) sufficient to process the indicator (DC > 70% in the calendar year). The territorial distribution involves 18 out of 20 regions. The variability at the territorial level is notable (Figures 1 to 8): in 2024 the maximum value of the Allergenic Pollen Integral was recorded in the municipality of Rome (in the RM6 station), with a value of 93,952 P·d/m 3 and the minimum in Genoa with 3,237 P·d/m 3 (Table 1 and Figure 8).
It is not possible to define a trend.
| Allegati |
|---|
Titolo
Table 1: ALLERGENIC AND ANNUAL POLLEN INTEGRAL (2024) Fonte
Processing by ISPRA based on SNPA and University of Rome “Tor Vergata” data Legenda
[1] Data from the Aerobiological and Environmental Monitoring Centre of the University of Rome “Tor Vergata” |
Thumbnail

Titolo
Figure 1: Seasonal Pollen Integral – Asteraceae (2024) Fonte
Processing by ISPRA based on SNPA and University of Rome “Tor Vergata” data |
Thumbnail

Titolo
Figure 2: Seasonal Pollen Integral – Betuloideae (2024) Fonte
Processing by ISPRA based on SNPA and University of Rome “Tor Vergata” data |
Thumbnail

Titolo
Figura 3: Integrale Pollinico Stagionale - Coryloideae (2024) Fonte
Processing by ISPRA based on SNPA and University of Rome “Tor Vergata” data |
Thumbnail

Titolo
Figure 4: Seasonal Pollen Integral – Cupressaceae (2024) Fonte
Processing by ISPRA based on SNPA and University of Rome “Tor Vergata” data |
Thumbnail

Titolo
Figure 5: Seasonal Pollen Integral – Oleaceae (2024) Fonte
Processing by ISPRA based on SNPA and University of Rome “Tor Vergata” data |
Thumbnail

Titolo
Figure 6: Seasonal Pollen Integral – Poaceae (2024) Fonte
Processing by ISPRA based on SNPA and University of Rome “Tor Vergata” data |
Thumbnail

Titolo
Figure 7: Seasonal Pollen Integral – Urticaceae (2024) Fonte
Processing by ISPRA based on SNPA and University of Rome “Tor Vergata” data |
Thumbnail
Titolo
Figura 8: Integrale Polinico Allergenico (2024) Fonte
Processing by ISPRA based on SNPA and University of Rome “Tor Vergata” data |
In 2024, the spatial and temporal variability of the indicator is confirmed which, in some cases, can be very accentuated. The spatial variations are essentially attributable to the location of sampling sites that reflect the general characteristics of the local vegetation, as well as being strongly influenced by their specific location on a microscale (i. e. By their greater or lesser distance from allergenic species). On the other hand, the temporal variations are mainly attributable to the weather conditions recorded during the year, which favor or depress the presence of airborne pollen.
As reported in Table 1 and Figures 1-7, the highest value is found for the Asteraceae (Compositae) in Veneto, in Verona (2,670 P·d/m 3); for the Betuloideae in Piedmont, in Omegna (10,776 P·d/m 3); for the Coryloideae in the Marche, in Comunanza (Ascoli Piceno) (14,232 P · d/m 3); for the Cupressaceae -Taxaceae in Lazio, in Rome (62,884 P·d/m 3 in the RM6 station); for the Oleaceae in Umbria, in Terni (29,636 P·d/m 3); for Poaceae (Gramineae) in Emilia Romagna, in Parma (11,254 P·d/m 3); for the Urticaceae in Lazio in Rome (18,167 P·d/m 3, in the RM6 station). Overall, the highest values of Allergenic Pollen Integral are recorded in Rome (93,952 P·d /m 3) and in Castel di Lama (Ascoli Piceno) (68,558 P·d /m 3).
It should be noted that, especially in larger urban areas, the quantity of allergenic pollen present in the atmosphere also depends on the characteristics of urban greenery and its management. Correct planning of interventions (planting of non-allergenic plants to replace allergenic ones, correct planning of mowing and pruning, good maintenance of roads, pavements and marginal areas against the aggression of almost always allergenic weeds) can lead to significant decreases in the allergenic load present in the atmosphere. Furthermore, since these activities concern air quality in relation to human health, they are among those suitable for pursuing objective d) of the 8th Environmental Action Program (8th PAA).