Panel 1
Massimiliano BULTRINI, Simona BUSCEMI, Giorgio CATTANI, Alessandra GAETA, Federica NOBILE (Dipartimento di Epidemiologia del Servizio Sanitario Regionale-Regione Lazio ASL Roma 1), Maria Antonietta REATINI, Massimo STAFOGGIA (Dipartimento di Epidemiologia del Servizio Sanitario Regionale-Regione Lazio ASL Roma 1)
Estimates of the population-weighted annual average exposure (Population Weighted Exposure, PWE) to ozone (O₃) have been developed at the municipal level using an integrated approach combining measurements and statistical models. The data, covering the period 2016–2022, allow comparison of PWE across all municipalities and provide a comprehensive overview of average exposure at the national level.
In 2022, 100% of the population was exposed to levels exceeding the WHO guideline value of 60 µg/m³, calculated as the mean of the distribution of daily maximum 8-hour moving averages during the period from April to September.
The national average PWE was 104 µg/m³ (range: 64–134 µg/m³).
No decreasing trend in exposure levels was observed during the period analyzed.
The most widely accepted health estimates attribute a significant portion of premature deaths and reductions in life expectancy to exposure to atmospheric pollutants (WHO, 2016; EEA, 2022; WHO, 2021).
Assessing population exposure and its spatial and temporal variability in the outdoor environment is a crucial step for epidemiological studies linking air pollution exposure to health effects (Caplin et al., 2019).
This indicator provides an estimate of the population-weighted average exposure (Population Weighted Exposure, PWE) to ozone (O₃) during the summer period, aggregated at the municipal level. It allows comparison across different cities and provides a comprehensive overview of average exposure at the national scale. The indicator reflects chronic population exposure and is useful for long-term health effect estimations.
Exposure values are compared with reference levels (guidelines and interim targets) recently updated by the World Health Organization (WHO, 2021).
To estimate the average population exposure to major airborne pollutants, assess exposure levels in comparison with WHO reference values (guidelines and interim targets), and evaluate temporal trends in exposure.
Legislative Decree No. 155 of 13 August 2010 and subsequent amendments, implementing Directive 2008/50/EC and Directive 2004/107/EC.
WHO (2021), Global Air Quality Guidelines. Particulate matter (PM10, PM2.5), ozone, nitrogen dioxide, sulfur dioxide, and carbon monoxide. Geneva, World Health Organization, 2021.
“A Clean Air Programme for Europe.” Brussels, 18 December 2013 COM (2013) 918 final.
“Europe that Protects: Clean Air for All.” Brussels, 17 May 2018 COM (2018) 330 final.
“Pathway to a Healthy Planet for All — EU Action Plan: Towards Zero Pollution for Air, Water, and Soil.” Brussels, 12 May 2021 COM (2021) 400 final.
In its revision of the Guidelines, WHO produced numerical risk estimates for a range of health effects associated with an increase of 10 µg/m³ in the annual average concentration of various pollutants. WHO does not define a safe threshold below which no risk exists but identifies a long-term exposure lower bound for ozone at 60 µg/m³, calculated as the mean of daily maximum 8-hour moving averages during the reference period from April to September (the warm season), termed the “Peak season ozone air quality guideline (AQG) level.” This “peak season guideline level” represents the lowest concentration at which increases in total mortality and cardiopulmonary mortality have been observed with 95% confidence.
WHO also defines “interim targets,” higher reference levels to be progressively achieved through air quality improvement policies. The interim targets for ozone proposed by WHO are 70 µg/m³ (IT 2) and 100 µg/m³ (IT 1).
EU clean air programs have set the medium- to long-term objective of aligning with WHO air quality guidelines, which are more stringent than EU air quality directive standards and are based on what is considered necessary to protect human health.
The EU Clean Air Package and the Zero Pollution Action Plan aim to reduce premature deaths linked to air pollution by more than half by 2030 compared to 2005.
Panel 2
Caplin A., Ghandehari M., Lim C., Glimcher P., Thurston G. (2019), Advancing environmental exposure assessment science to benefit society. Nature communication (2019) 10:1236. https://doi.org/10.1038/s41467-019-09155-4
EEA (2022), Health Risk Assessment of Air Pollution and the Impact of the New WHO Guidelines. Eionet Report – ETC/ATNI 2022/10.
Eurostat (2022), Sustainable development in the European Union — Monitoring report on progress towards the SDGs in an EU context — 2022 edition. (DOI): 10.2785/313289.
Stafoggia M, Bellander T, Bucci S et al. Estimation of daily PM10 and PM2.5 concentrations in Italy, 2013-2015, using a spatiotemporal land-use random-forest model. Environ Int 2019;124:170-79.
Stafoggia M, Cattani G, Ancona C, Ranzi A. La valutazione dell’esposizione della popolazione italiana all’inquinamento atmosferico nel periodo 2016-2019 per lo studio della relazione tra inquinamento atmosferico e COVID-19. Epidemiol Prev. 2020 Sep-Dec;44(5-6 Suppl 2):161-168. Italian. doi: 10.19191/EP20.5-6.S2.115. PMID: 33412807.
WHO (2016), Ambient air pollution: A global assessment of exposure and burden of disease. Geneva, World Health Organization, 2016.
WHO (2021), Global Air Quality Guidelines. Particulate matter (PM10, PM2.5), ozone, nitrogen dioxide, sulfur dioxide and carbon monoxide. Geneva, World Health Organization, 2021.
The population considered is that distributed within the 2011 permanent census sections, which represent the most recent available territorial basis. The 2021 territorial bases are currently under validation and will incorporate updates related to municipal demographics and territorial changes that have occurred since the 2011 permanent census.
The indicator expresses an average population exposure value at the municipal level. It is known that within a single municipality there is variability in pollutant concentrations, with some areas exhibiting levels higher than the average or background values. However, assessment of exposure at local or microscale levels within individual municipalities falls outside the scope of this indicator. It should be noted, however, that within municipalities, areas with higher population density are weighted more heavily in the calculation of Population Weighted Exposure (PWE).
The exposure values obtained should not be directly compared with legal limit values; for compliance assessment with legal limits, the highest value measured by individual monitoring stations must be used.
Application of high-resolution spatiotemporal models using spatiotemporal predictors, satellite data, and air quality monitoring data.
Data quality assessment
DEP: Department of Epidemiology, Regional Health Service, Lazio Region – ASL RME
ISPRA: Higher Institute for Environmental Protection and Research
ISTAT: National Institute of Statistics
SNPA: National System for Environmental Protection
ISPRA – Database InfoARIA
ISTAT – www.demo.istat.it
National, Regional, Municipal (7,904/7,914)
2016-2022
Indicator assessment
The model uses as the response variable the daily average concentrations measured at monitoring stations distributed across the national territory and as explanatory variables a selection of spatial and temporal predictors. Monitoring data are collected and archived by ISPRA in the InfoAria database, in accordance with Directive 2008/50/EC (and its national transposition, Legislative Decree No. 155/2010) and Commission Implementing Decision 2011/850/EU.
A machine learning model, random forest, was developed to relate the daily concentrations from monitoring stations with spatial predictors (population density, road network, land cover, altitude, artificial surfaces, etc.) and spatiotemporal predictors (dispersion models, meteorology) to estimate daily average O₃ levels per km² across the Italian territory.
Using the daily concentrations estimated by the random forest model, the average population exposure (“population-weighted exposure,” PWE) was calculated by weighting the concentration of each pollutant at the cell level by the resident population within that cell.
The “national average concentration value” is computed as the population-weighted mean of the estimated concentrations for each municipality, with weights proportional to the resident population.
Finally, the percentage distribution of the resident population exposed to different O₃ concentration ranges is estimated.
In 2022, 100% of the population was exposed to ozone levels exceeding the WHO guideline value of 60 µg/m³ (calculated as the mean of the distribution of daily maximum 8-hour moving averages during the reference period from April to September) as well as the Interim Target 2 (70 µg/m³). Additionally, 47% of the population was exposed to levels exceeding IT1 (100 µg/m³).
Regarding the exceedance of IT1, the regions of Lombardy, Piedmont, and Valle d’Aosta reached 100% of the population exposed, followed by Emilia-Romagna with 87%, and Friuli Venezia Giulia and Veneto, both with 94% (Figure 1 - Table 1).
The national average PWE was 104 µg/m³ (range: 64–134 µg/m³) (Figure 2).
As shown in Figure 2, over the seven years considered, there is no observed decreasing trend in the mean values of the Population Weighted Exposure (PWE). The national average remains around 100 µg/m³ throughout the analyzed period.
Although the trend has not been quantitatively assessed using statistical methods and refers to a relatively short period, it appears consistent with observations from the past decade at air quality monitoring stations.
From 2016 to 2022, 100% of the population continued to be exposed to ozone concentrations exceeding the WHO guideline value. Between 2017 and 2020, a reduction was observed in the proportion of the population exposed to levels above Interim Target 1, with a corresponding increase in the percentage exposed to levels between IT1 and IT2; however, this reduction does not appear confirmed in the last two years (Figure 3).
Data
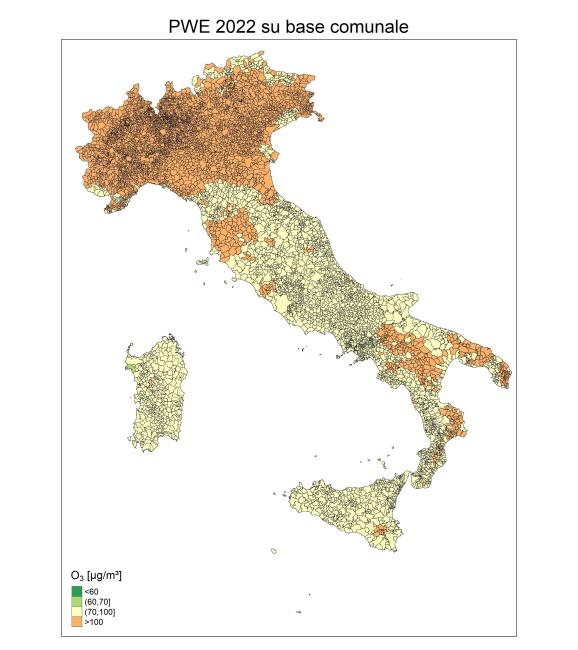
Figure 1: Population-weighted average exposure to ozone (O₃) at the municipal level (2022)
Analysis by ISPRA based on data from the Department of Epidemiology of the Regional Health Service of Lazio
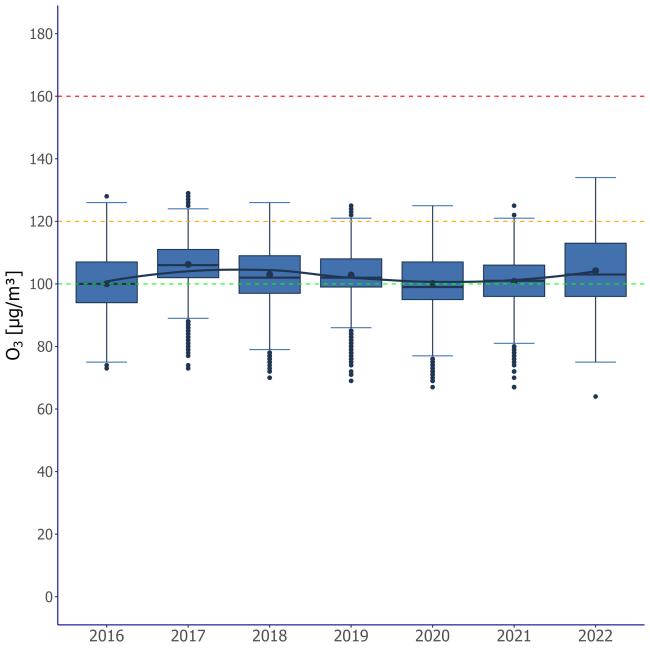
Figure 2: Annual distribution of PWE values (population‑weighted average exposure to ozone (O₃) at the municipal level)
Analysis by ISPRA based on data from the Department of Epidemiology of the Regional Health Service of Lazio
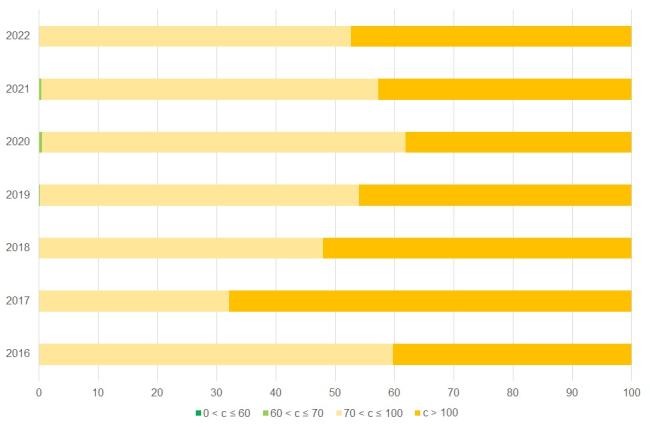
Figure 3: Ozone — Percentage of population exposed to O₃ concentrations by exposure range and year
Analysis by ISPRA based on data from the Department of Epidemiology of the Regional Health Service of Lazio
The four PWE categories shown correspond to the WHO guideline value and the two interim targets.
Table 1 – O₃. Population-weighted exposure (PWE) by region: percentage distribution by exposure category (2022)
Analysis by ISPRA based on data from the Department of Epidemiology of the Regional Health Service of Lazio
PWE: population-weighted average exposure (Population Weighted Exposure)
The four PWE categories shown correspond to the WHO guideline value and the two interim targets.
The indicator aligns with those used at the European level by the European Environment Agency (EEA) and globally by the World Health Organization (WHO) to monitor exposure. Furthermore, it serves as the basis for exposure assessment to develop health risk assessments and burden of disease estimates consistent with the methodologies employed by these two supranational organizations.
With reference to the United Nations Sustainable Development Goals (SDGs), the methodological approach is consistent with that used to calculate the indicator supporting monitoring progress toward Goal 11 (making cities and human settlements inclusive, safe, resilient, and sustainable), specifically target 11.6 (by 2030, substantially reduce the adverse per capita environmental impact of cities, particularly regarding air quality and waste management).
From a methodological standpoint, the estimated exposure also underpins one of the indicators useful for monitoring progress toward Goal 3 (ensure healthy lives and promote well-being for all at all ages), specifically target 3.9 (by 2030, substantially reduce the number of deaths and illnesses from hazardous chemicals and air, water, and soil pollution and contamination).